Embed Size (px)
Citation preview

1 of 47Copyright © 2010 Pearson Education, Inc. · Economics · R. Glenn Hubbard, Anthony Patrick O’Brien, 3e.
Cha
pter
3:
Whe
re P
rices
Com
e F
rom
: T
he I
nter
actio
n of
Dem
and
and
Sup
ply

2 of 47Copyright © 2010 Pearson Education, Inc. · Economics · R. Glenn Hubbard, Anthony Patrick O’Brien, 3e.
Cha
pter
3:
Whe
re P
rices
Com
e F
rom
: T
he I
nter
actio
n of
Dem
and
and
Sup
ply

3 of 47Copyright © 2010 Pearson Education, Inc. · Economics · R. Glenn Hubbard, Anthony Patrick O’Brien, 3e.
Cha
pter
3:
Whe
re P
rices
Com
e F
rom
: T
he I
nter
actio
n of
Dem
and
and
Sup
ply
CHAPTER 3
Where PricesCome From:The Interaction of Demand and Supply
Fernando Quijano
Prepared by:
The intense competition among firms selling
energy drinks is a striking example of how the market responds to
changes in consumer tastes.

4 of 47Copyright © 2010 Pearson Education, Inc. · Economics · R. Glenn Hubbard, Anthony Patrick O’Brien, 3e.
Cha
pter
3:
Whe
re P
rices
Com
e F
rom
: T
he I
nter
actio
n of
Dem
and
and
Sup
ply
3.1 The Demand Side of the MarketDiscuss the variables that influence demand.
3.2 The Supply Side of the MarketDiscuss the variables that influence supply.
3.3 Market Equilibrium: Putting Demand and Supply TogetherUse a graph to illustrate market equilibrium.
3.4 The Effect of Demand and Supply Shifts on EquilibriumUse demand and supply graphs to predict changes in prices and quantities
Chapter Outline and Learning ObjectivesWhere Prices
Come From: The Interaction of Demand and Supply
CHAPTER 3

5 of 47Copyright © 2010 Pearson Education, Inc. · Economics · R. Glenn Hubbard, Anthony Patrick O’Brien, 3e.
Cha
pter
3:
Whe
re P
rices
Com
e F
rom
: T
he I
nter
actio
n of
Dem
and
and
Sup
ply
Perfectly Competitive Market A market that meets the conditions of (1) many buyers and sellers, (2) all firms selling identical products, and (3) no barriers to new firms entering the market.
Where Prices Come From:The Interaction of Demand and Supply

6 of 47Copyright © 2010 Pearson Education, Inc. · Economics · R. Glenn Hubbard, Anthony Patrick O’Brien, 3e.
Cha
pter
3:
Whe
re P
rices
Com
e F
rom
: T
he I
nter
actio
n of
Dem
and
and
Sup
ply
Demand schedule A table showing the relationship between the price of a product and the quantity of the product demanded.
Quantity demanded The amount of a good or service that a consumer is willing and able to purchase at a given price.
Demand curve A curve that shows the relationship between the price of a product and the quantity of the product demanded.
Market demand The demand by all the consumers of a given good or service.
The Demand Side of the Market
Demand Schedules and Demand Curves
Discuss the variables that influence demand.
3.1 LEARNING OBJECTIVE

7 of 47Copyright © 2010 Pearson Education, Inc. · Economics · R. Glenn Hubbard, Anthony Patrick O’Brien, 3e.
Cha
pter
3:
Whe
re P
rices
Com
e F
rom
: T
he I
nter
actio
n of
Dem
and
and
Sup
ply FIGURE 3-1
A Demand Schedule and Demand Curve
The Demand Side of the Market
Demand Schedules and Demand Curves
As the price changes, consumers change the quantity of energy drinks they are willing to buy. We can show this as a demand schedule in a table or as a demand curve on a graph. The table and graph both show that as the price of energy drinks falls, the quantity demanded rises. When the price of energy drinks is $3.00, consumers buy 60 million cans per day. When the price drops to $2.50, consumers buy 70 million cans. Therefore, the demand curve for energy drinks is downward sloping.
Discuss the variables that influence demand.
3.1 LEARNING OBJECTIVE

8 of 47Copyright © 2010 Pearson Education, Inc. · Economics · R. Glenn Hubbard, Anthony Patrick O’Brien, 3e.
Cha
pter
3:
Whe
re P
rices
Com
e F
rom
: T
he I
nter
actio
n of
Dem
and
and
Sup
ply
The Demand Side of the Market
Law of demand The rule that, holding everything else constant, when the price of a product falls, the quantity demanded of the product will increase, and when the price of a product rises, the quantity demanded of the product will decrease.
The Law of Demand
Discuss the variables that influence demand.
3.1 LEARNING OBJECTIVE

9 of 47Copyright © 2010 Pearson Education, Inc. · Economics · R. Glenn Hubbard, Anthony Patrick O’Brien, 3e.
Cha
pter
3:
Whe
re P
rices
Com
e F
rom
: T
he I
nter
actio
n of
Dem
and
and
Sup
ply
The Demand Side of the Market
Substitution effect The change in the quantity demanded of a good that results from a change in price, making the good more or less expensive relative to other goods that are substitutes.
Income effect The change in the quantity demanded of a good that results from the effect of a change in the good’s price on consumers’ purchasing power.
What Explains the Law of Demand?
Discuss the variables that influence demand.
3.1 LEARNING OBJECTIVE

10 of 47Copyright © 2010 Pearson Education, Inc. · Economics · R. Glenn Hubbard, Anthony Patrick O’Brien, 3e.
Cha
pter
3:
Whe
re P
rices
Com
e F
rom
: T
he I
nter
actio
n of
Dem
and
and
Sup
ply
The Demand Side of the Market
Ceteris paribus (“all else equal”) condition The requirement that when analyzing the relationship between two variables—such as price and quantity demanded—other variables must be held constant.
A shift of a demand curve is an increase or a decrease in demand. A movement along a demand curve is an increase or a decrease in the quantity demanded.
Holding Everything Else Constant:The Ceteris Paribus Condition
Discuss the variables that influence demand.
3.1 LEARNING OBJECTIVE

11 of 47Copyright © 2010 Pearson Education, Inc. · Economics · R. Glenn Hubbard, Anthony Patrick O’Brien, 3e.
Cha
pter
3:
Whe
re P
rices
Com
e F
rom
: T
he I
nter
actio
n of
Dem
and
and
Sup
ply
FIGURE 3-2
Shifting theDemand Curve
Holding Everything Else Constant:The Ceteris Paribus Condition
The Demand Side of the Market
When consumers increase the quantity of a product they want to buy at a given price, the market demand curve shifts to the right, from D1 to D2.When consumers decrease the quantity of a product they want to buy at any given price, the demand curve shifts to the left, from D1 to D3.
Discuss the variables that influence demand.
3.1 LEARNING OBJECTIVE

12 of 47Copyright © 2010 Pearson Education, Inc. · Economics · R. Glenn Hubbard, Anthony Patrick O’Brien, 3e.
Cha
pter
3:
Whe
re P
rices
Com
e F
rom
: T
he I
nter
actio
n of
Dem
and
and
Sup
ply
The Demand Side of the Market
Normal good A good for which the demand increases as income rises and decreases as income falls.
Inferior good A good for which the demand increases as income falls and decreases as income rises.
Variables That Shift Market Demand
• Income
Many variables other than price can influence market demand.
Discuss the variables that influence demand.
3.1 LEARNING OBJECTIVE

13 of 47Copyright © 2010 Pearson Education, Inc. · Economics · R. Glenn Hubbard, Anthony Patrick O’Brien, 3e.
Cha
pter
3:
Whe
re P
rices
Com
e F
rom
: T
he I
nter
actio
n of
Dem
and
and
Sup
ply
Are Big Macs an Inferior Good?
McDonald’s restaurants experienced increased sales during 2008 and 2009, despite the recession.
Makingthe
Connection
Big Macs seem to fit the economic definition of an inferior good because demand increased as income fell. But remember that inferior goods are not necessarily of low quality, they are just goods for which consumers increase their demand as their incomes fall.
YOUR TURN: Test your understanding by doing related problem 1.8 at the end of this chapter.
Discuss the variables that influence demand.
3.1 LEARNING OBJECTIVE

14 of 47Copyright © 2010 Pearson Education, Inc. · Economics · R. Glenn Hubbard, Anthony Patrick O’Brien, 3e.
Cha
pter
3:
Whe
re P
rices
Com
e F
rom
: T
he I
nter
actio
n of
Dem
and
and
Sup
ply
The Big Macs Prices at Different Places Making
the
Connection
資料來源: http://kuso4ever.blogspot.com/2009/10/n.html

15 of 47Copyright © 2010 Pearson Education, Inc. · Economics · R. Glenn Hubbard, Anthony Patrick O’Brien, 3e.
Cha
pter
3:
Whe
re P
rices
Com
e F
rom
: T
he I
nter
actio
n of
Dem
and
and
Sup
ply
The Demand Side of the Market
Substitutes Goods and services that can be used for the same purpose.
Complements Goods and services that are used together.
Variables That Shift Market Demand
• Prices of related goods
Consumers can be influenced by an advertising campaign for a product.
• Tastes
Discuss the variables that influence demand.
3.1 LEARNING OBJECTIVE

16 of 47Copyright © 2010 Pearson Education, Inc. · Economics · R. Glenn Hubbard, Anthony Patrick O’Brien, 3e.
Cha
pter
3:
Whe
re P
rices
Com
e F
rom
: T
he I
nter
actio
n of
Dem
and
and
Sup
ply
The Demand Side of the Market
Demographics The characteristics of a population with respect to age, race, and gender.
• Population and demographics
• Expected future prices
Consumers choose not only which products to buy but also when to buy them.
Variables That Shift Market Demand
Discuss the variables that influence demand.
3.1 LEARNING OBJECTIVE

17 of 47Copyright © 2010 Pearson Education, Inc. · Economics · R. Glenn Hubbard, Anthony Patrick O’Brien, 3e.
Cha
pter
3:
Whe
re P
rices
Com
e F
rom
: T
he I
nter
actio
n of
Dem
and
and
Sup
ply
The Aging of the Baby Boom Generation
Makingthe
Connection
What effects will the aging of the baby boom generation have on the economy?Older people have a greater demand for medical care than do younger people.Aging boomers will also have an effect on the housing market.
YOUR TURN: Test your understanding by doing related problem 1.9 at the end of this chapter.
Discuss the variables that influence demand.
3.1 LEARNING OBJECTIVE

18 of 47Copyright © 2010 Pearson Education, Inc. · Economics · R. Glenn Hubbard, Anthony Patrick O’Brien, 3e.
Cha
pter
3:
Whe
re P
rices
Com
e F
rom
: T
he I
nter
actio
n of
Dem
and
and
Sup
ply
How about the situations in
Taiwan ?
Makingthe
Connection
65歲以上人口占總人口比率:即年齡在 65歲以上的人口占總人口比率。
Discuss the variables that influence demand.
3.1 LEARNING OBJECTIVE

19 of 47Copyright © 2010 Pearson Education, Inc. · Economics · R. Glenn Hubbard, Anthony Patrick O’Brien, 3e.
Cha
pter
3:
Whe
re P
rices
Com
e F
rom
: T
he I
nter
actio
n of
Dem
and
and
Sup
ply
The Demand Side of the Market
Variables That Shift Market Demand
TABLE 3-1
Variables That Shift Market Demand Curves
Discuss the variables that influence demand.
3.1 LEARNING OBJECTIVE

20 of 47Copyright © 2010 Pearson Education, Inc. · Economics · R. Glenn Hubbard, Anthony Patrick O’Brien, 3e.
Cha
pter
3:
Whe
re P
rices
Com
e F
rom
: T
he I
nter
actio
n of
Dem
and
and
Sup
ply
The Demand Side of the Market
Variables That Shift Market Demand
TABLE 3-1
Variables That Shift Market Demand Curves
Discuss the variables that influence demand.
3.1 LEARNING OBJECTIVE

21 of 47Copyright © 2010 Pearson Education, Inc. · Economics · R. Glenn Hubbard, Anthony Patrick O’Brien, 3e.
Cha
pter
3:
Whe
re P
rices
Com
e F
rom
: T
he I
nter
actio
n of
Dem
and
and
Sup
ply
The Demand Side of the Market
Variables That Shift Market Demand
TABLE 3-1
Variables That Shift Market Demand Curves
Discuss the variables that influence demand.
3.1 LEARNING OBJECTIVE

22 of 47Copyright © 2010 Pearson Education, Inc. · Economics · R. Glenn Hubbard, Anthony Patrick O’Brien, 3e.
Cha
pter
3:
Whe
re P
rices
Com
e F
rom
: T
he I
nter
actio
n of
Dem
and
and
Sup
ply
The Demand Side of the Market
Variables That Shift Market Demand
TABLE 3-1
Variables That Shift Market Demand Curves
Discuss the variables that influence demand.
3.1 LEARNING OBJECTIVE

23 of 47Copyright © 2010 Pearson Education, Inc. · Economics · R. Glenn Hubbard, Anthony Patrick O’Brien, 3e.
Cha
pter
3:
Whe
re P
rices
Com
e F
rom
: T
he I
nter
actio
n of
Dem
and
and
Sup
ply FIGURE 3-3
A Change in Demand versus a Change in Quantity Demanded
If the price of digital music players falls from $3.00 to $2.50, the result will be a movement along the demand curve from point A to point B—an increase in quantity demanded from 60 million cans to 70 million cans. If consumers’ incomes increase, or if another factor changes that makes consumers want more of the product at every price, the demand curve will shift to the right—an increase in demand. In this case, the increase in demand from D1 to D2 causes the quantity of energy drinks demanded at a price of $3.00 to increase from 60 million cans at point A to 80 million cans at point C.
A Change in Demand versus a Change in Quantity Demanded
The Demand Side of the Market Discuss the variables that influence demand.
3.1 LEARNING OBJECTIVE
24 of 47Copyright © 2010 Pearson Education, Inc. · Economics · R. Glenn Hubbard, Anthony Patrick O’Brien, 3e.
Cha
pter
3:
Whe
re P
rices
Com
e F
rom
: T
he I
nter
actio
n of
Dem
and
and
Sup
ply
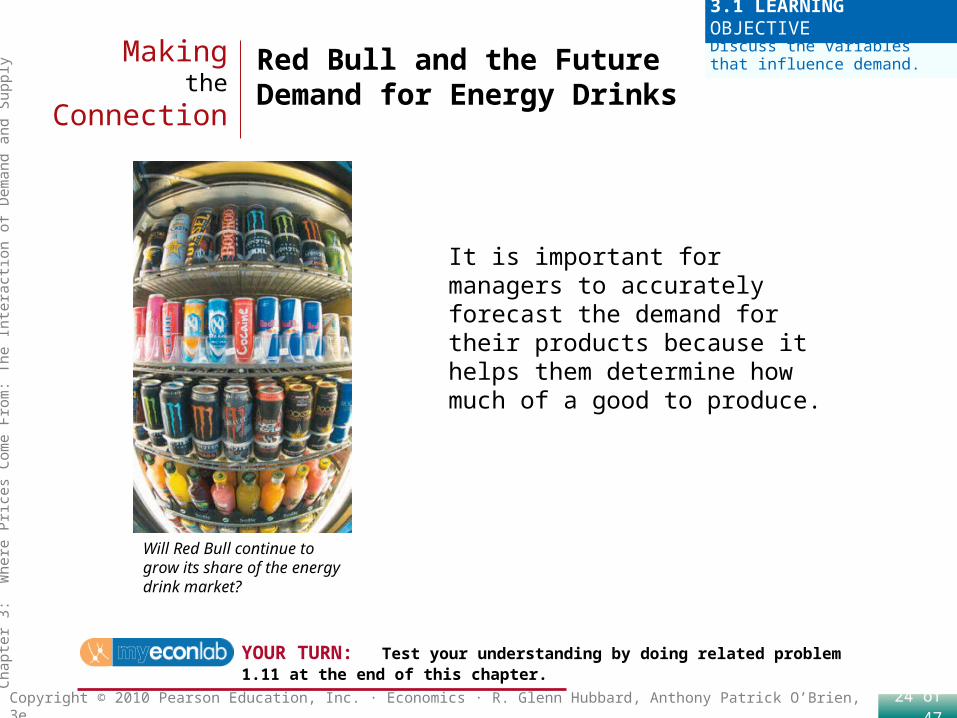
Red Bull and the FutureDemand for Energy Drinks
Makingthe
Connection
Will Red Bull continue to grow its share of the energy drink market?
It is important for managers to accurately forecast the demand for their products because it helps them determine how much of a good to produce.
YOUR TURN: Test your understanding by doing related problem 1.11 at the end of this chapter.
Discuss the variables that influence demand.
3.1 LEARNING OBJECTIVE

25 of 47Copyright © 2010 Pearson Education, Inc. · Economics · R. Glenn Hubbard, Anthony Patrick O’Brien, 3e.
Cha
pter
3:
Whe
re P
rices
Com
e F
rom
: T
he I
nter
actio
n of
Dem
and
and
Sup
ply
Energy Drinks in TaiwanMakingthe
Connection
Discuss the variables that influence demand.
3.1 LEARNING OBJECTIVE
資料來源:楊志浩 (2006)台灣地區機能性提神飲料消費者消費行為之分析與探討

26 of 47Copyright © 2010 Pearson Education, Inc. · Economics · R. Glenn Hubbard, Anthony Patrick O’Brien, 3e.
Cha
pter
3:
Whe
re P
rices
Com
e F
rom
: T
he I
nter
actio
n of
Dem
and
and
Sup
ply
Supply schedule A table that shows the relationship between the price of a product and the quantity of the product supplied.
Supply curve A curve that shows the relationship between the price of a product and the quantity of the product supplied.
The Supply Side of the Market
Supply Schedules and Supply Curves
Quantity supplied The amount of a good or service that a firm is willing and able to supply at a given price.
Discuss the variables that influence supply.
3.2 Learning Objective

27 of 47Copyright © 2010 Pearson Education, Inc. · Economics · R. Glenn Hubbard, Anthony Patrick O’Brien, 3e.
Cha
pter
3:
Whe
re P
rices
Com
e F
rom
: T
he I
nter
actio
n of
Dem
and
and
Sup
ply
The Supply Side of the Market
Supply Schedules and Supply Curves
FIGURE 3-4
A Supply Schedule and Supply Curve
As the price changes, Red Bull, Monster Energy, Rockstar, and the other firms producing energy drinks change the quantity they are willing to supply. We can show this as a supply schedule in a table or as a supply curve on a graph.The supply schedule and supply curve both show that as the price of energy drinks rises, firms will increase the quantity they supply.At a price of $2.50 per can, firms will supply 90 million cans. At a price of $3.00, firms will supply 100 million cans.
Discuss the variables that influence supply.
3.2 Learning Objective

28 of 47Copyright © 2010 Pearson Education, Inc. · Economics · R. Glenn Hubbard, Anthony Patrick O’Brien, 3e.
Cha
pter
3:
Whe
re P
rices
Com
e F
rom
: T
he I
nter
actio
n of
Dem
and
and
Sup
ply
The Supply Side of the Market
Law of supply The rule that, holding everything else constant, increases in price cause increases in the quantity supplied, and decreases in price cause decreases in the quantity supplied.
The Law of Supply
Discuss the variables that influence supply.
3.2 Learning Objective

29 of 47Copyright © 2010 Pearson Education, Inc. · Economics · R. Glenn Hubbard, Anthony Patrick O’Brien, 3e.
Cha
pter
3:
Whe
re P
rices
Com
e F
rom
: T
he I
nter
actio
n of
Dem
and
and
Sup
ply
The Supply Side of the Market
FIGURE 3-5
Shifting the Supply Curve
The Law of Supply
When firms increase the quantity of a product they want to sell at a given price, the supply curve shifts to the right. The shift from S1 to S3 represents an increase in supply.When firms decrease the quantity of a product they want to sell at a given price, the supply curve shifts to the left.The shift from S1 to S2 represents a decrease in supply.
Discuss the variables that influence supply.
3.2 Learning Objective

30 of 47Copyright © 2010 Pearson Education, Inc. · Economics · R. Glenn Hubbard, Anthony Patrick O’Brien, 3e.
Cha
pter
3:
Whe
re P
rices
Com
e F
rom
: T
he I
nter
actio
n of
Dem
and
and
Sup
ply
The Supply Side of the Market
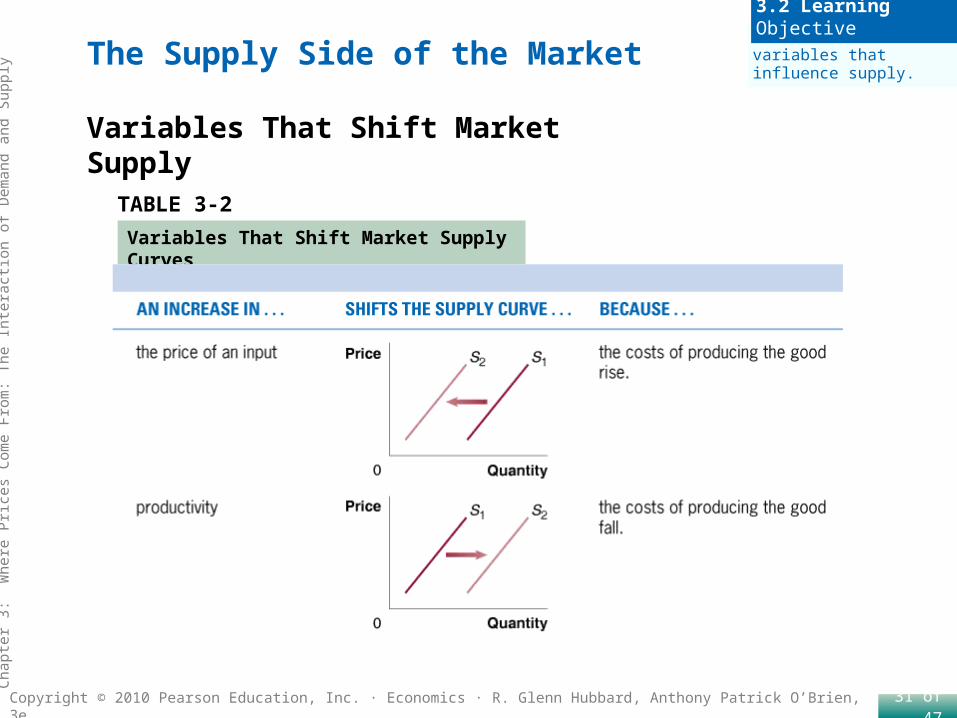
Variables That Shift Market Supply
• Prices of substitutes in production
• Number of firms in the market
• Expected future prices
Technological change A positive or negative change in the ability of a firm to produce a given level of output with a given quantity of inputs.
The following are the most important variables that shift market supply:
• Prices of inputs
• Technological change
Discuss the variables that influence supply.
3.2 Learning Objective
31 of 47Copyright © 2010 Pearson Education, Inc. · Economics · R. Glenn Hubbard, Anthony Patrick O’Brien, 3e.
Cha
pter
3:
Whe
re P
rices
Com
e F
rom
: T
he I
nter
actio
n of
Dem
and
and
Sup
ply
The Supply Side of the Market
Variables That Shift Market Supply
TABLE 3-2
Variables That Shift Market Supply Curves
Discuss the variables that influence supply.
3.2 Learning Objective

32 of 47Copyright © 2010 Pearson Education, Inc. · Economics · R. Glenn Hubbard, Anthony Patrick O’Brien, 3e.
Cha
pter
3:
Whe
re P
rices
Com
e F
rom
: T
he I
nter
actio
n of
Dem
and
and
Sup
ply
The Supply Side of the Market
Variables That Shift Market Supply
TABLE 3-2
Variables That Shift Market Supply Curves (continued)
Discuss the variables that influence supply.
3.2 Learning Objective

33 of 47Copyright © 2010 Pearson Education, Inc. · Economics · R. Glenn Hubbard, Anthony Patrick O’Brien, 3e.
Cha
pter
3:
Whe
re P
rices
Com
e F
rom
: T
he I
nter
actio
n of
Dem
and
and
Sup
ply
The Supply Side of the Market
Variables That Shift Market Supply
TABLE 3-2
Discuss the variables that influence supply.
3.2 Learning Objective
Variables That Shift Market Supply Curves (continued)

34 of 47Copyright © 2010 Pearson Education, Inc. · Economics · R. Glenn Hubbard, Anthony Patrick O’Brien, 3e.
Cha
pter
3:
Whe
re P
rices
Com
e F
rom
: T
he I
nter
actio
n of
Dem
and
and
Sup
ply
The Supply Side of the Market
FIGURE 3-6
A Change in Supply versus a Change in Quantity Supplied
A Change in Supply versus a Change in Quantity Supplied
If the price of energy drinks rises from $2.00 to $2.50 per can, the result will be a movement up the supply curve from point A to point B—an increase in quantity supplied by Red Bull, Monster Energy, Rockstar, and the other firms from 80 million to 90 million cans.If the price of an input decreases or another factor changes that makes sellers supply more of the product at every price, the supply curve will shift to the right—an increase in supply.In this case, the increase in supply from S1 to S2 causes the quantity of energy drinks supplied at a price of $2.50 to increase from 90 million cans at point B to 110 million cans at point C.
Discuss the variables that influence supply.
3.2 Learning Objective

35 of 47Copyright © 2010 Pearson Education, Inc. · Economics · R. Glenn Hubbard, Anthony Patrick O’Brien, 3e.
Cha
pter
3:
Whe
re P
rices
Com
e F
rom
: T
he I
nter
actio
n of
Dem
and
and
Sup
ply
Market Equilibrium: Putting Demandand Supply Together
FIGURE 3-7
Market Equilibrium
Where the demand curve crosses the supply curve determines market equilibrium. In this case, the demand curve for energy drinks crosses the supply curve at a price of $2.00 and a quantity of 80 million cans. Only at this point is the quantity of energy drinks consumers are willing to buy equal to the quantity that Red Bull, Monster Energy, Rockstar, and the other firms are willing to sell: The quantity demanded is equal to the quantity supplied.
Use a graph to illustrate market equilibrium.
3.3 Learning Objective

36 of 47Copyright © 2010 Pearson Education, Inc. · Economics · R. Glenn Hubbard, Anthony Patrick O’Brien, 3e.
Cha
pter
3:
Whe
re P
rices
Com
e F
rom
: T
he I
nter
actio
n of
Dem
and
and
Sup
ply
Market equilibrium A situation in which quantity demanded equals quantity supplied.
Competitive market equilibrium A market equilibrium with many buyers and many sellers.
Market Equilibrium: Putting Demandand Supply Together
Use a graph to illustrate market equilibrium.
3.3 Learning Objective
37 of 47Copyright © 2010 Pearson Education, Inc. · Economics · R. Glenn Hubbard, Anthony Patrick O’Brien, 3e.
Cha
pter
3:
Whe
re P
rices
Com
e F
rom
: T
he I
nter
actio
n of
Dem
and
and
Sup
ply
Market Equilibrium: Putting Demandand Supply Together
Surplus A situation in which the quantity supplied is greater than the quantity demanded.
Shortage A situation in which the quantity demanded is greater than the quantity supplied.
How Markets Eliminate Surpluses and Shortages
Use a graph to illustrate market equilibrium.
3.3 Learning Objective

38 of 47Copyright © 2010 Pearson Education, Inc. · Economics · R. Glenn Hubbard, Anthony Patrick O’Brien, 3e.
Cha
pter
3:
Whe
re P
rices
Com
e F
rom
: T
he I
nter
actio
n of
Dem
and
and
Sup
ply
Market Equilibrium: Putting Demandand Supply Together
FIGURE 3-8
The Effect of Surpluses and Shortages on the Market Price
How Markets Eliminate Surpluses and Shortages
When the market price is above equilibrium, there will be a surplus. In the figure, a price of $2.50 for energy drinks results in 90 million cans being supplied but only 70 million cans being demanded, or a surplus of 20 million. As Red Bull, Monster Energy, Rockstar, and the other firms cut the price to dispose of the surplus, the price will fall to the equilibrium of $2.00.When the market price is below equilibrium, there will be a shortage. A price of $1.00 results in 100 million cans being demanded but only 60 million cans being supplied, or a shortage of 40 million cans. As consumers who are unable to buy energy drinks offer to pay higher prices, the price will rise to the equilibrium of $2.00.
Use a graph to illustrate market equilibrium.
3.3 Learning Objective

39 of 47Copyright © 2010 Pearson Education, Inc. · Economics · R. Glenn Hubbard, Anthony Patrick O’Brien, 3e.
Cha
pter
3:
Whe
re P
rices
Com
e F
rom
: T
he I
nter
actio
n of
Dem
and
and
Sup
ply
Market Equilibrium: Putting Demandand Supply Together
Demand and Supply Both Count
Keep in mind that the interaction of demand and supply determines the equilibrium price.
Neither consumers nor firms can dictate what the equilibrium price will be.
No firm can sell anything at any price unless it can find a willing buyer, and no consumer can buy anything at any price without finding a willing seller.
Use a graph to illustrate market equilibrium.
3.3 Learning Objective

40 of 47Copyright © 2010 Pearson Education, Inc. · Economics · R. Glenn Hubbard, Anthony Patrick O’Brien, 3e.
Cha
pter
3:
Whe
re P
rices
Com
e F
rom
: T
he I
nter
actio
n of
Dem
and
and
Sup
ply
The Effect of Demand and SupplyShifts on Equilibrium
FIGURE 3-9
The Effect of an Increase in Supply on Equilibrium
The Effect of Shifts in Supply on Equilibrium
1. As Coca-Cola enters the market for energy drinks, a larger quantity of energy drinks will be supplied at every price, so the market supply curve shifts to the right, from S1 to S2, which causes a surplus of
cans at the original price, P1.
2. The equilibrium price falls from P1 to P2.
3. The equilibrium quantity rises from Q1 to
Q2.
If a firm enters a market, as Coca-Cola entered the market for energy drinks when it launched Full Throttle, the equilibrium price will fall, and the equilibrium quantity will rise:
Use demand and supplygraphs to predict changesin prices and quantities.
3.4 Learning Objective

41 of 47Copyright © 2010 Pearson Education, Inc. · Economics · R. Glenn Hubbard, Anthony Patrick O’Brien, 3e.
Cha
pter
3:
Whe
re P
rices
Com
e F
rom
: T
he I
nter
actio
n of
Dem
and
and
Sup
ply
The Falling Price ofLCD Televisions
Makingthe
Connection
An increase in supply drove the price of a typical large LCD television from $4,000 in fall 2004 to $1,000 at the end of 2008, increasing the quantity demanded worldwide from 8 million to 105 million.
YOUR TURN: Test your understanding by doing related problem 4.7 at the end of this chapter.
Use demand and supplygraphs to predict changesin prices and quantities.
3.4 Learning Objective

42 of 47Copyright © 2010 Pearson Education, Inc. · Economics · R. Glenn Hubbard, Anthony Patrick O’Brien, 3e.
Cha
pter
3:
Whe
re P
rices
Com
e F
rom
: T
he I
nter
actio
n of
Dem
and
and
Sup
ply
2004-2009年全球 LCD出貨量及成長預估
Makingthe
Connection
Use demand and supplygraphs to predict changesin prices and quantities.
3.4 Learning Objective
2003 2004 2005 2006 2007 2008 20093.93 8.71 17.8 29.907 40.374 50.81 61.45
121.63 104.36 68.02 35 25.85 20.94LCD TV出貨量成長率(%)
年份
資料來源:資策會MIC, 2005 年 2月

43 of 47Copyright © 2010 Pearson Education, Inc. · Economics · R. Glenn Hubbard, Anthony Patrick O’Brien, 3e.
Cha
pter
3:
Whe
re P
rices
Com
e F
rom
: T
he I
nter
actio
n of
Dem
and
and
Sup
ply
The Effect of Demand and SupplyShifts on Equilibrium
FIGURE 3-10
The Effect of an Increase in Demand on Equilibrium
The Effect of Shifts in Demand on Equilibrium
Increases in income will cause the equilibrium price and quantity to rise:
1. Because energy drinks are a normal good, as income grows, the quantity demanded increases at every price, and the market demand curve shifts to the right, from D1 to D2, which
causes a shortage of energy drinks at the original price, P1.
2. The equilibrium price rises from P1 to P2.
3. The equilibrium quantity rises from Q1 to Q2.
Use demand and supplygraphs to predict changesin prices and quantities.
3.4 Learning Objective

44 of 47Copyright © 2010 Pearson Education, Inc. · Economics · R. Glenn Hubbard, Anthony Patrick O’Brien, 3e.
Cha
pter
3:
Whe
re P
rices
Com
e F
rom
: T
he I
nter
actio
n of
Dem
and
and
Sup
ply
The Effect of Demand and SupplyShifts on Equilibrium
FIGURE 3-11
Shifts in Demand and Supply over Time
The Effect of Shifts in Demand and Supply over Time
In panel (a), demand shifts to the right more than supply, and the equilibrium price rises:
1. Demand shifts to the right more than supply.2. Equilibrium price rises from P1 to P2.
In panel (b), supply shifts to the right more than demand, and the equilibrium price falls:
1. Supply shifts to the right more than demand.2. Equilibrium price falls from P1 to P2.
Use demand and supplygraphs to predict changesin prices and quantities.
3.4 Learning Objective

45 of 47Copyright © 2010 Pearson Education, Inc. · Economics · R. Glenn Hubbard, Anthony Patrick O’Brien, 3e.
Cha
pter
3:
Whe
re P
rices
Com
e F
rom
: T
he I
nter
actio
n of
Dem
and
and
Sup
ply
The Effect of Demand and SupplyShifts on Equilibrium
TABLE 3-3
How Shifts in Demand and Supply Affect Equilibrium Price (P) and Quantity (Q)
The Effect of Shifts in Demand and Supply over Time
SUPPLY CURVE UNCHANGED
SUPPLY CURVESHIFTS TO THE RIGHT
SUPPLY CURVE SHIFTS TO THE LEFT
DEMAND CURVE UNCHANGED
Q unchangedP unchanged
Q increasesP decreases
Q decreasesP increases
DEMAND CURVESHIFTS TO THE RIGHT Q increases
P increases
Q increasesP increases ordecreases
Q increases or decreases P increases
DEMAND CURVESHIFTS TO THE LEFT
Q decreasesP decreases
Q increases or decreasesP decreases
Q decreasesP increases ordecreases
Use demand and supplygraphs to predict changesin prices and quantities.
3.4 Learning Objective

46 of 47Copyright © 2010 Pearson Education, Inc. · Economics · R. Glenn Hubbard, Anthony Patrick O’Brien, 3e.
Cha
pter
3:
Whe
re P
rices
Com
e F
rom
: T
he I
nter
actio
n of
Dem
and
and
Sup
ply
The Effect of Demand and SupplyShifts on Equilibrium
Shifts in a Curve versus Movements along a Curve
Don’t Let This Happen to YOU!Remember: A Change in a Good’s Price Does NotCause the Demand or Supply Curve to Shift
YOUR TURN: Test your understanding by doing related problems 4.13 and 4.14 at the end of this chapter.
Use demand and supplygraphs to predict changesin prices and quantities.
3.4 Learning Objective
When analyzing markets using demand and supply curves, it is important to remember that when a shift in a demand or supply curve causes a change in equilibrium price, the change in price does not cause a further shift in demand or supply.

47 of 47Copyright © 2010 Pearson Education, Inc. · Economics · R. Glenn Hubbard, Anthony Patrick O’Brien, 3e.
Cha
pter
3:
Whe
re P
rices
Com
e F
rom
: T
he I
nter
actio
n of
Dem
and
and
Sup
ply
How Does Advertising Help Red Bull Increase Demand for Its Energy Drink?
AN INSIDE LOOK>>
Advertising may cause an increase in the demand for Red Bull.