Embed Size (px)
Citation preview
1
October 29, 2010
California Tourism Outlook 2010-2011
Dan MishellDirector, Research
California Travel & Tourism Commission
2
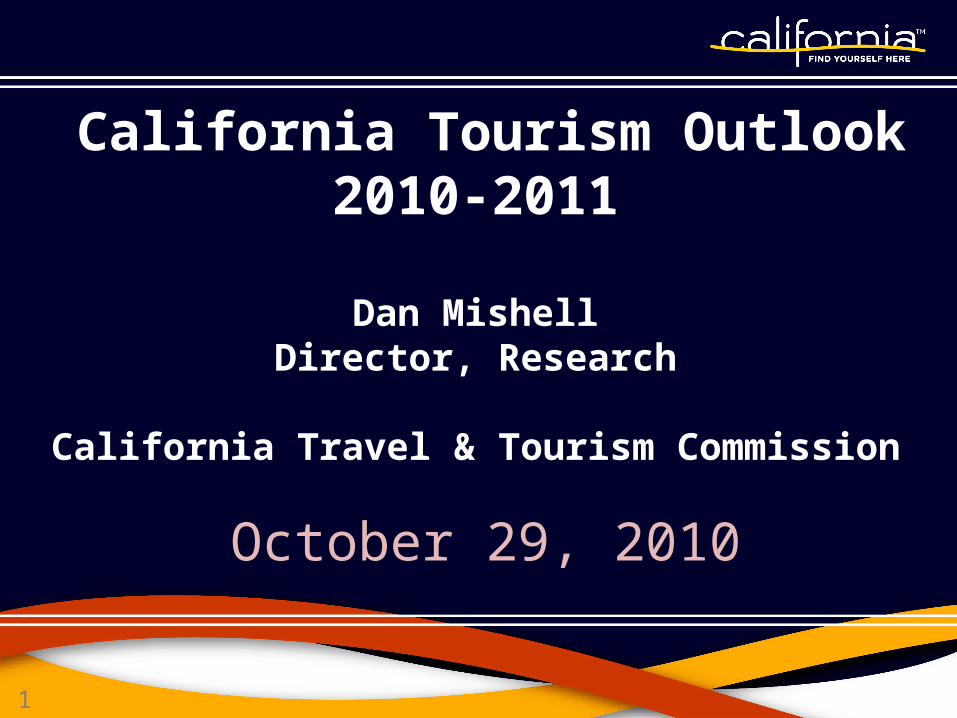
2008 2009 2010 2011 2012 2013 2014Total Visits -1.6% -5.8% 4.0% 3.1% 3.0% 2.7% 2.3%
Domestic
Total Visits -1.6% -5.6% 3.8% 2.9% 2.8% 2.5% 2.2%
Leisure Visits -1.0% -6.0% 3.2% 3.0% 2.9% 2.6% 2.2%
International
Total
% change -1.6% -7.9% 6.2% 5.9% 5.3% 4.2% 3.4%
Overseas 6.1% -13.7% 9.8% 5.5% 5.1% 4.5% 4.1%
Mexico -8.7% -3.4% 3.7% 6.5% 5.8% 4.1% 3.0%
Canada 9.5% -6.6% 5.1% 3.8% 3.5% 3.2% 2.9%
Leisure
% change 0.3% -7.5% 5.7% 6.6% 4.6% 4.1% 4.3%
Overseas 14.0% -13.7% 8.5% 5.9% 5.4% 5.2% 4.8%
Mexico -8.7% -3.4% 4.1% 7.8% 4.4% 3.6% 4.3%
Canada 9.5% -6.6% 5.0% 2.9% 3.3% 2.9% 2.8%
97.5 87.7 94.2 99.5 105.6 112.0 117.6
% change 2.5% -10.1% 7.4% 5.6% 6.2% 6.1% 5.0%Domestic 79.2 72.1 77.0 80.7 85.0 89.8 94.3% change 1.0% -9.0% 6.8% 4.8% 5.3% 5.7% 5.0%International 18.3 15.6 17.2 18.8 20.6 22.2 23.3% change 9.6% -14.8% 10.5% 9.0% 9.9% 7.7% 4.8%
California Tourism Summary(Annual % change)
Total Expenditures ($ billions)
Source: Tourism Economics. Historical sources: TNS Global (domestic); CIC Research, OTTI (international); Dean Runyan (expenditures)
3
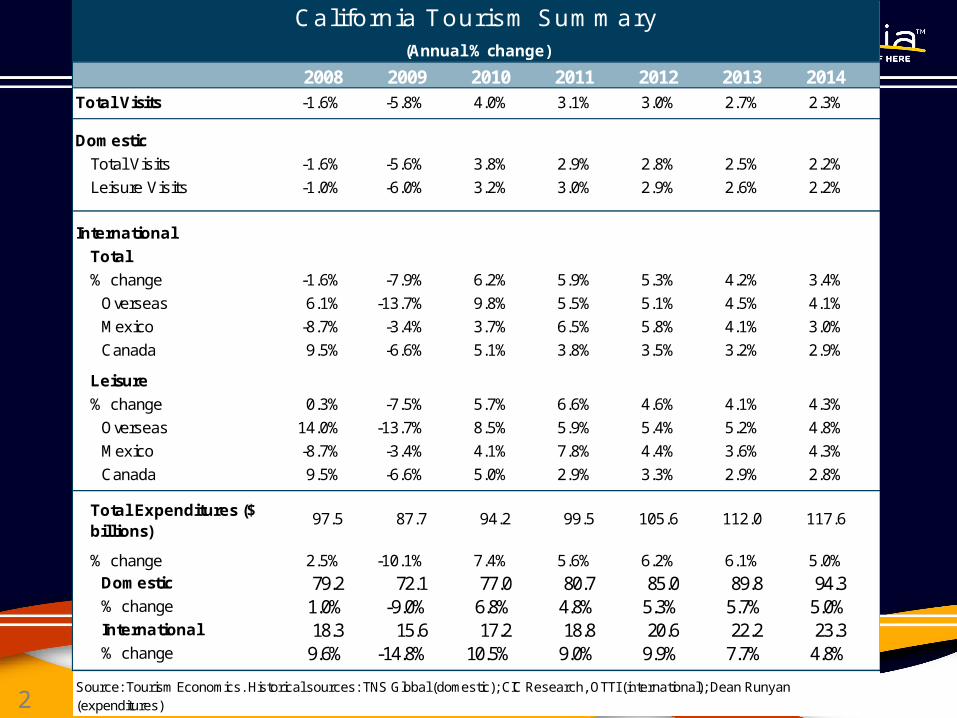
California Tourism Mission
California has over 100 destination marketing organizations, and over 50 tourism business districts. (CTTC, Civitas)
CTTC provides a statewide platform for promoting the California brand to leisure travelers.
MISSION: To develop and maintain marketing programs in partnership with the state’s travel industry that keep California top-of-mind as a premier travel destination.

4
California’s Leisure Visitors
58%
42%
Spending
73%
27%
Person-Trips
DomesticInternational
36 million non-resident leisure person-trips in 2009
$24 billion in spending by non-resident leisure travelers
Sources: DK Shifflet & Assoc.; US Dept. of Commerce; CIC Research, Inc., Stats Canada

5
Domestic Leisure Overview
Six primary states account for nearly half of non-resident visits and 1/3 of non-resident spending in California.
Sources: DK Shifflet & Assoc.; TNS TravelsAmerica

6
International Market Overview, 2009
Canada UKJapan
Australia
Germany
Mexico (a
ir)
S. Korea
China India
France
Scandinavia
S. Americ
a0
200,000
400,000
600,000
800,000
1,000,000
1,200,000
1,400,000
$0$200,000$400,000$600,000$800,000$1,000,000$1,200,000$1,400,000$1,600,000$1,800,000
Visit
ors
Spen
ding
in M
illio
ns
Lead
Mature
Emerging
Secondary
2009
Mexico Total • 6.3million visitors• $760 million spending
Sources: US Dept. of Commerce; CIC Research; Stats Canada; CTTC
7
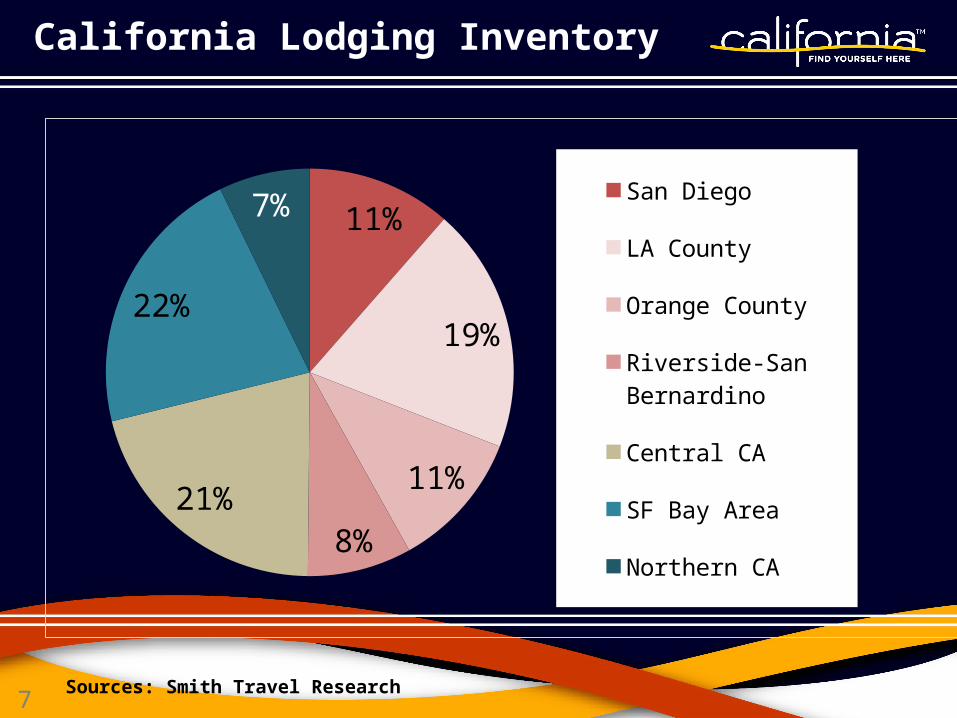
California Lodging Inventory
11%
19%
11%
8%21%
22%
7% San Diego
LA County
Orange County
Riverside-San Bernardino
Central CA
SF Bay Area
Northern CA
Sources: Smith Travel Research

8
04 05 06 07 08 09 10-60
-50
-40
-30
-20
-10
0
10
West region U.S.
Confidence Has Stabilized, but at a Low Level
Sources: ABC News, Washington Post
Consumer confidence index
The New Normal

9
2009 2010E 2011F 2012F
Unemployment rate 9.3 9.7 9.8 8.2
CPI -0.3 1.5 1.9 3.1Real personal disp. income 0.6 1.5 2.5 3.3
Real consumer spending -1.2 1.3 2.9 4.5
Real GDP -2.6 2.8 3.4 4.9Total after-tax profits 2.6 26.0 2.0 10.8
% change yr ago except unemployment rate
The New Normal
Recovery Will Proceed at a Tepid Pace
Sources: Moody’s Analytics, BLS, BEA

10
JapanFrance
U.K.Germany
CanadaAustralia
MexicoSouth Korea
IndiaChina
-10 0 10 20 30 40 50 60
2009-2014 2009
• China and India will remain growth leaders• Economies in Japan and Western Europe will be slower to recover• Australia shows no signs of slowing
New Normal – GDP
11
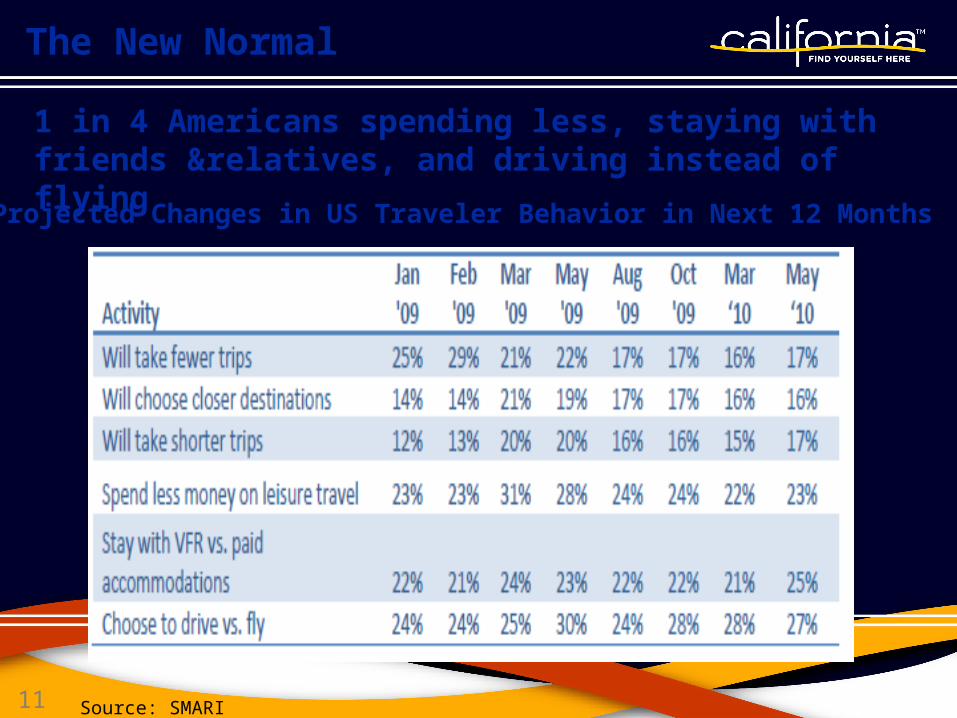
Projected Changes in US Traveler Behavior in Next 12 Months
1 in 4 Americans spending less, staying with friends &relatives, and driving instead of flying
Source: SMARI
The New Normal

12
Consumer Trends
• Recovery consumers are redefining value in a new era of consequences
• Consumers want transparency, trustworthiness and authenticity.
• The definition of “luxury” is morphing and now consumers want meaning along with material goods
The New Normal
Compiled from: The New Experience of Luxury Synovate 06/10, : PwC The New Consumer Paradigm: Permanent or Fleeting 10/09, Brand Keys 02/10, A Darwinian Tale The Futures Co 11/09

13
Forecast Overview
• Stronger than expected recovery in 2010 to date
• Visits will moderate in the second half of the year against headwinds from the economy and comparisons to late 2009
• The economic outlook is marred by uncertainty

14
CA Hotel Regional Occupancy
Source: Smith Travel Research
•Business and international travel are up
•Leisure travelers trading up from day to overnight
United St
ates
California
Anaheim LA SD SF
Oaklan
d
Riversi
de/SB
Sacra
mento
San Jo
se
CA South/C
entra
l
CA North
CA North
Centra
l
CA Centra
l Coast
0.0
5.0
10.0
15.0
20.0
Room Demand % Change by Region YTD August
GatewayRuralOther

15
Strong start to 2010…
-10%
0%
10%
20%
30%
40%
50%
60%To
tal
Chi
na
Indi
a
Japa
n
S. K
orea
Aus
tral
ia
U.K
.
Ger
man
y
Fra
nce
S. A
mer
ica
Mex
ico
(Air)
International Arrivals in California% change year ago, 2010H1
Source : CIC Research, OTTI
• International arrivals up 14% through June
16
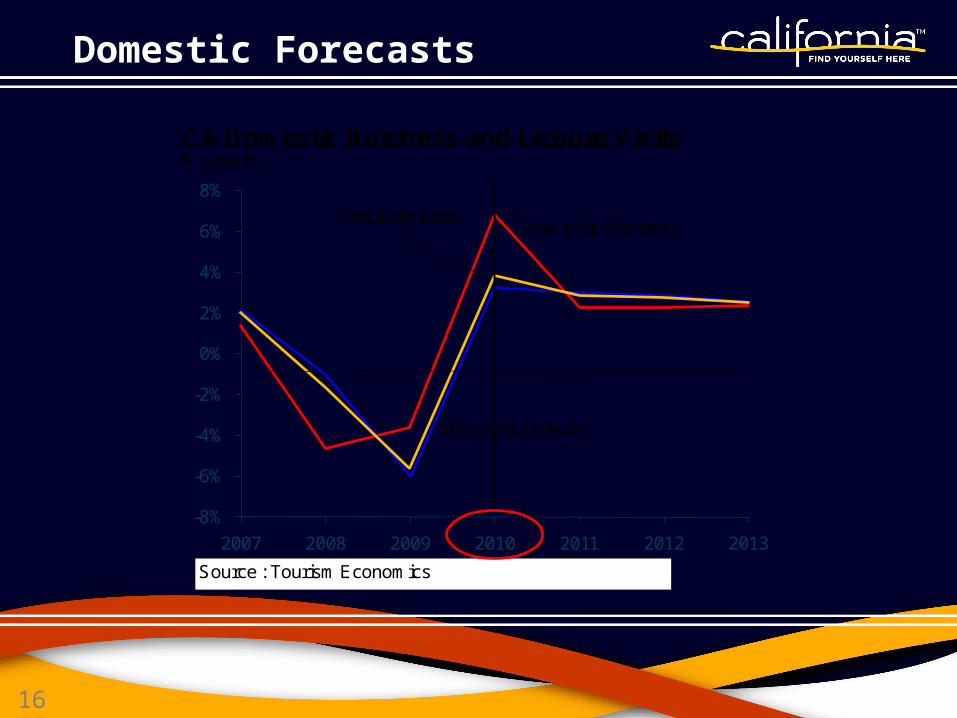
-8%
-6%
-4%
-2%
0%
2%
4%
6%
8%
2007 2008 2009 2010 2011 2012 2013
CA Domestic Business and Leisure Visits% growth
Source : Tourism Economics
Domestic Leisure
Domestic BusinessTotal Domestic
Domestic Forecasts

17
Domestic Forecasts
-8%
-6%
-4%
-2%
0%
2%
4%
6%
2008 2009 2010 2011 2012 2013
Domestic Leisure Visits% growth
Source : Tourism Economics
Previous Forecast
Current Forecast
-6%
-4%
-2%
0%
2%
4%
6%
8%
2008 2009 2010 2011 2012 2013
Domestic Business Visits% growth
Source : Tourism Economics
Previous Forecast
Current Forecast

18
-10%
-8%
-6%
-4%
-2%
0%
2%
4%
6%
8%
10%
12%
2006 2007 2008 2009 2010 2011 2012 2013
CA International Inbound Travelannual % growth
Source : Tourism Economics
US inbound travel
CA inbound travel
International Forecast
19
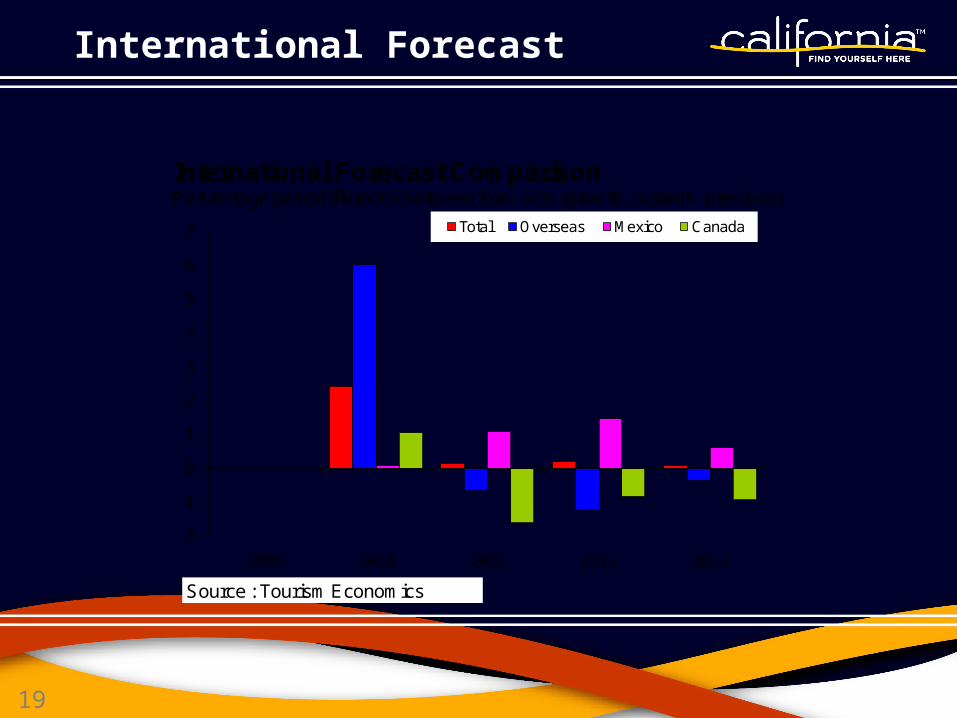
-2
-1
0
1
2
3
4
5
6
7
2009 2010 2011 2012 2013
Total Overseas Mexico Canada
International Forecast ComparisonPercentage point difference between forecasts (growth, current - previous)
Source : Tourism Economics
International Forecast

20
-20%
-15%
-10%
-5%
0%
5%
10%
15%
2008 2009 2010 2011 2012 2013 2014
CA Visitor Expenditures% growth
Source : Dean Runyan, Tourism Economics
Total
Domestic
International
Spending Forecast

21
Spending Forecast
-15%
-10%
-5%
0%
5%
10%
15%
2008 2009 2010 2011 2012 2013
Visitor Spending% growth
Source : Tourism Economics
Previous ForecastCurrent Forecast
22
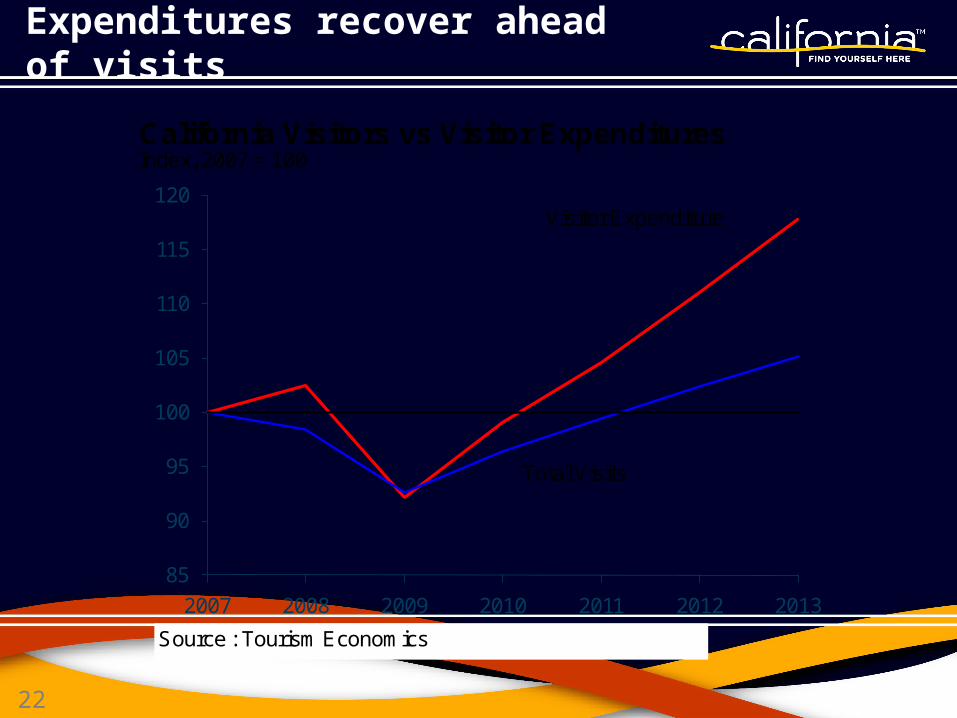
Expenditures recover ahead of visits
85
90
95
100
105
110
115
120
2007 2008 2009 2010 2011 2012 2013
California Visitors vs Visitor ExpendituresIndex, 2007 = 100
Source : Tourism Economics
Visitor Expenditure
Total Visits
23
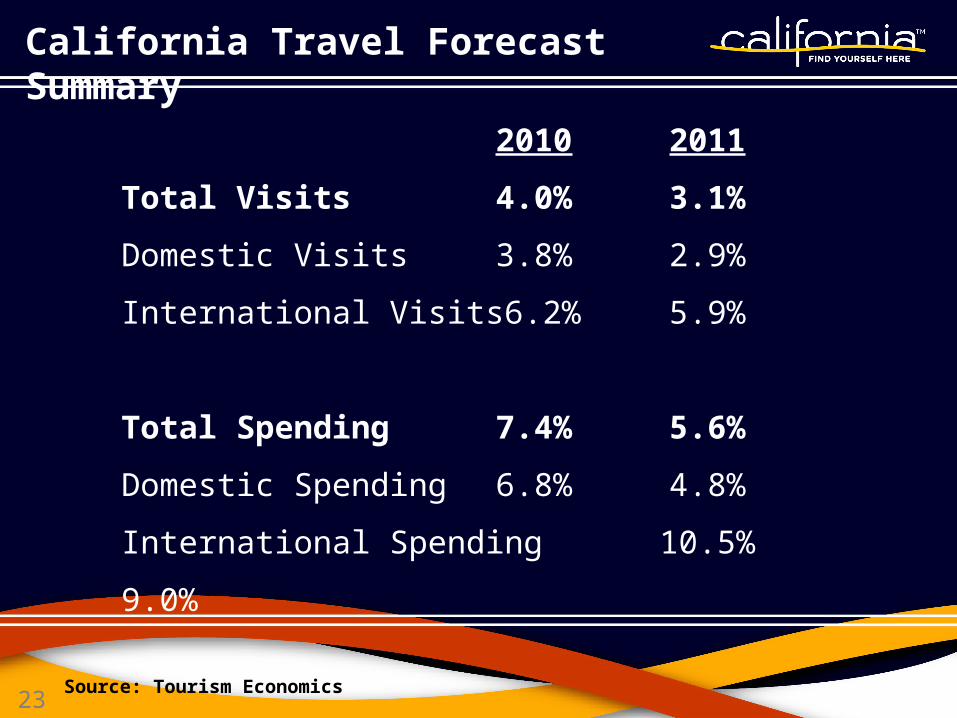
2010 2011
Total Visits 4.0% 3.1%
Domestic Visits 3.8% 2.9%
International Visits 6.2% 5.9%
Total Spending 7.4% 5.6%
Domestic Spending 6.8% 4.8%
International Spending 10.5% 9.0%
California Travel Forecast Summary
Source: Tourism Economics

24
2008 2009 2010 2011 2012 2013 2014Total Visits -1.6% -5.8% 4.0% 3.1% 3.0% 2.7% 2.3%
Domestic
Total Visits -1.6% -5.6% 3.8% 2.9% 2.8% 2.5% 2.2%
Leisure Visits -1.0% -6.0% 3.2% 3.0% 2.9% 2.6% 2.2%
International
Total
% change -1.6% -7.9% 6.2% 5.9% 5.3% 4.2% 3.4%
Overseas 6.1% -13.7% 9.8% 5.5% 5.1% 4.5% 4.1%
Mexico -8.7% -3.4% 3.7% 6.5% 5.8% 4.1% 3.0%
Canada 9.5% -6.6% 5.1% 3.8% 3.5% 3.2% 2.9%
Leisure
% change 0.3% -7.5% 5.7% 6.6% 4.6% 4.1% 4.3%
Overseas 14.0% -13.7% 8.5% 5.9% 5.4% 5.2% 4.8%
Mexico -8.7% -3.4% 4.1% 7.8% 4.4% 3.6% 4.3%
Canada 9.5% -6.6% 5.0% 2.9% 3.3% 2.9% 2.8%
97.5 87.7 94.2 99.5 105.6 112.0 117.6
% change 2.5% -10.1% 7.4% 5.6% 6.2% 6.1% 5.0%Domestic 79.2 72.1 77.0 80.7 85.0 89.8 94.3% change 1.0% -9.0% 6.8% 4.8% 5.3% 5.7% 5.0%International 18.3 15.6 17.2 18.8 20.6 22.2 23.3% change 9.6% -14.8% 10.5% 9.0% 9.9% 7.7% 4.8%
California Tourism Summary(Annual % change)
Total Expenditures ($ billions)
Source: Tourism Economics. Historical sources: TNS Global (domestic); CIC Research, OTTI (international); Dean Runyan (expenditures)
tourism.visitcalifornia.com/research
Full Forecast Available Online