Embed Size (px)
Citation preview

1
NAWIPS Migration Briefingto
Development Collaboration
David Plummer
NAWIPS Software Development Team Lead
NCEP / NCO
29 September 2010

What is NAWIPS?
• Software suite that supports National Centers’ forecast operations and development activities– GUI and text-based apps– Includes local applications and scripts– Runs everywhere including CCS and Compute Farm– “Soup to nuts”
• Hardware independent– No specific hardware and few system software requirements
• Development team since 1992
2

What is NAWIPS?
• Software development follows an incremental, generalized approach– Support requirements of diverse customers
• HPC, OPC, CPC, SPC, NHC, AWC, SWPC• PR, AR, RFCs• UNIDATA
• Must bring functionality to the field quickly
• Strength is in foundation libraries– GEMPAK
3

What is NAWIPS?
GEMPAK Foundation Libraries
Application Libraries
Device DriversGPLT
GEMPAK Apps / Local Apps(SFMAP, GDPLOT2, etc.)
GUI Apps(NMAP, NSHARP, etc.)
4

Merging
• National Centers Perspective in CAVE– No changes to other perspectives (D2D, Hydro, etc.)
NMAP2 NTRANSNWX NSHARP
AWIPS2 CAVE NC Perspective
NAWIPS GUI Apps
GEMPAK text Apps
AWIPS2 Services
(Database - read access only)
5
What are we doing?
• Decoders– McIDAS : remapped as well as native projections (GVAR)– GRIB2 : movable grids, named storms, named dispersion models, etc.– Radar mosaic– AWW – advisory, watch, warning : FFA, SVRL, WARN, WCN, WOU,
WSTM, WTCH– SIGMETs : Conv, NConv, Int’l, AIRMET– WCP (watch corner point)– FFG– TCM (tropical cyclone)– NCSCAT : various scatterometer
6

What are we doing?
• National Centers Perspective - general– Combines functionality of 4 legacy GUI applications
• NMAP2 – data display and product generation• NTRANS – multipanel• NSHARP – vertical profile display, diagnostics and editing• NWX – FOS text product select and display
– Gray box conversion• Some variances unavoidable or negotiated
– Much development is new• Leveraged Raytheon implementations where possible
– Flexibility is key
7

What are we doing?
• National Centers Perspective - display– No “localized” spatial scales
– No “short fuse” driven interface• Heavy use of SPFs• Ability to adjust data request and rendering attributes prior to
loading
– Freely configurable via tables• Concept of “desk” (user -> desk -> site -> baseline)• Allows for pre-ops setup
8
What are we doing?
• National Centers Perspective - display– Flexible timeline
• Not restricted to current data• Archived data, case studies
– Multiple editors (tabs)• Leverage Eclipse RCP features• Unlimited number of animation sequences
– Configurable, multiple panes• Leveraged Raytheon framework• Temporal and spatial synchronization (or not)• Ensembles
9

What are we doing?
• National Centers Perspective - display– Flexible timeline
• Not restricted to current data• Archived data, case studies
– Multiple editors (tabs)• Leverage Eclipse RCP features• Unlimited number of animation sequences
– Configurable, multiple panes• Leveraged Raytheon framework• Temporal and spatial synchronization (or not)• Ensembles
10

What are we doing?
• National Centers Perspective – NSHARP view– SkewT-Hodograph Analysis and Research Program
– Profile display and analysis • Skew-T, wind profile, hodo• Animation
– Multiple data types• UAIR, PFC, [drops, grids, aircraft, …]
– Multiple pages of diagnostics• Configurable and expandable for additional development
– Interactive• User may adjust graphic (temp, dwpt, wind)• Adjustments reflected in diagnostics
11

What are we doing?
• National Centers Perspective – NSHARP view– Profile display and analysis
• Skew-T, wind profile, hodo• Animation
– Multiple data types• UAIR, PFC, [drops, grids, aircraft, …]
– Multiple pages of diagnostics• Configurable and expandable for additional development
– Interactive• User may adjust graphic (temp, dwpt, wind)• Adjustments reflected in diagnostics
12
What are we doing?
• National Centers Perspective – NWX view– FOS text data selection and display– Graphical selection– Identifiers are mapped into groups and individual products
• Real word interface• Public Products -> State Fcst Discussion, Zone Forecasts, etc.• NHC Products -> Outlooks, Hurricane Discussions, etc.
– Handles scheduled and unscheduled• Forecasts vs. Warnings
– Some products internally decoded for additional information• Graphical display• HPC QPF contours, UV Index
13

What are we doing?
• National Centers Perspective – NWX view– FOS text data selection and display– Graphical selection– Identifiers are mapped into groups and individual products
• Real word interface• Public Products -> State Fcst Discussion, Zone Forecasts, etc.• NHC Products -> Outlooks, Hurricane Discussions, etc.
– Handles scheduled and unscheduled• Forecasts vs. Warnings
– Some products internally decoded for additional information• Graphical display• HPC QPF contours, UV Index
14

What are we doing?
• National Centers Perspective – PGEN view– Product Generation – “PGEN”– Generalized framework for (virtually) all operational products
• Text, images (web), grids, KML, etc.
– Highly configurable• Consistency for forecaster, consistency in products
– Drawing and editing capabilities
– Implemented in AWIPS2 as a “resource”• Operability simultaneous with any data• Should be accessible in other perspectives
15

Product Generation
• Basics– “Product-centric”
• Forecaster indicates what product is being worked• Palette, file names, layers, and other specs adjust to product• More than one product may be active
– Layers virtualized in the framework
– Control panel for active products and layers• Toggle display and rendering characteristics
– Time filtering available
16

Product Generation
• Objects– Drawable Elements (DE)
• Internal canonical XML implementation– JAXB
• Geo-referenced– Display projection irrelevant
• Foundation of primitive single- and multi-point Java classes– More complicated DEs extend primitive classes
• Rendering via Factory design pattern
17

Product Generation
• Objects– Primitives
• Fronts (all types), lines (numerous styles), symbols, combo-symbols, vectors (barbs, arrows, dir arrows, hash), markers, circles (ellipse), text
• Rendering attributes: color, line thickness, etc.
– Extended and compound collections• Jet, Aviation text, tracks, SIGMETs (international, convective, non-
convective, airmet), CCFP, Svr Wx Watch / Status / Cancel, Contours, Cloud, Turbulence, VAA, Tropical Cyclone Advisory (TCA), G-AIRMET, SPC Outlooks
• Attributes as needed
18
Product Generation
• Editing actions– Select– Copy– Move– Modify– Connect– Add point– Delete (DE, point, part, all)– Rotate– Flip– Interpolate– Extrapolate
19

PGEN
• Products - XML files
20
<?xml version="1.0" encoding="UTF-8" standalone="yes"?><Products xmlns:ns2="group" xmlns:ns3="http://www.example.org/productType"> <Product name="Default" type="Default" forecaster="Default" center="Default" onOff="true" useFile="false" filePath="./" fileName="Default.xml"> <Layer name="Default" onOff="true" monoColor="false" filled="false"> <Color red="255" green="255" blue="0" alpha="255"/> <DrawableElement> <DECollection pgenCategory="MET" pgenType="JET" collectionName="Jet"> <DrawableElement> <DECollection collectionName="WindInfo"> <DrawableElement> <Text pgenCategory="Text" pgenType="General Text" fontSize="18.0" fontName="Courier" style="REGULAR" justification="CENTER" rotation="35.394715202004875" rotationRelativity="SCREEN_RELATIVE" mask="false" outline="false" yOffset="0" xOffset="0"> <Color red="0" green="255" blue="0" alpha="255"/> <Point Lat="41.03506519765785" Lon="-103.3693874062878"/> </Text> </DrawableElement> </DECollection> <Line pgenCategory="Lines" lineWidth="2.0" sizeScale="2.0" smoothFactor="2" closed="false" filled="false" fillPattern="SOLID" pgenType="FILLED_ARROW"> <Color red="0" green="255" blue="0" alpha="255"/> <Color red="0" green="255" blue="0" alpha="255"/> </Line> </DrawableElement> </DECollection> </DrawableElement> </Layer> </Product></Products>
PGEN
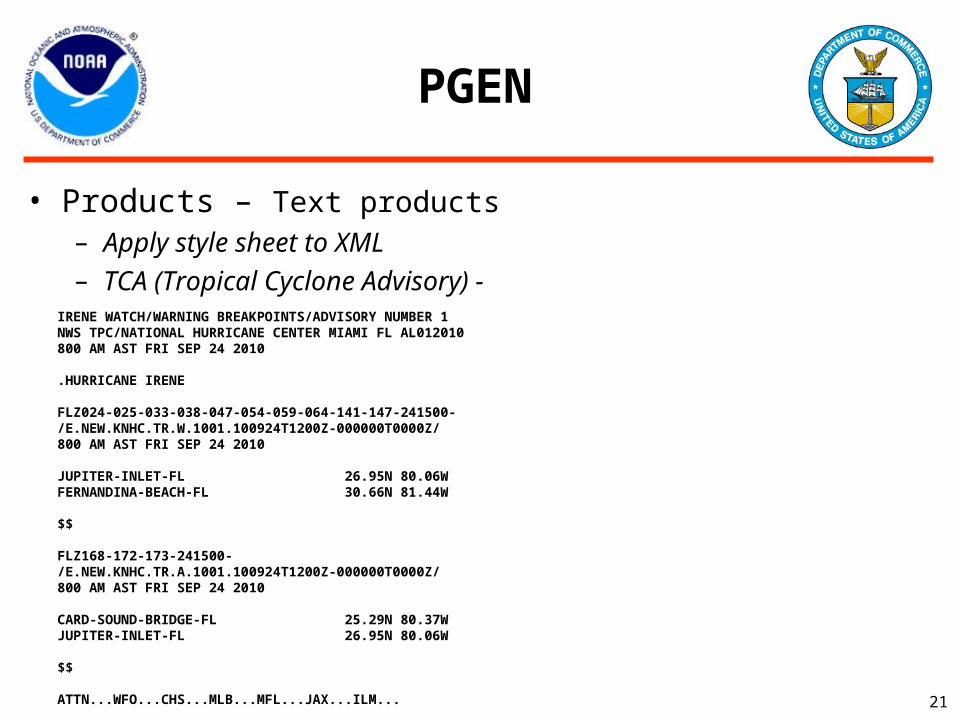
• Products – Text products– Apply style sheet to XML – TCA (Tropical Cyclone Advisory) -
21
IRENE WATCH/WARNING BREAKPOINTS/ADVISORY NUMBER 1NWS TPC/NATIONAL HURRICANE CENTER MIAMI FL AL012010800 AM AST FRI SEP 24 2010
.HURRICANE IRENE
FLZ024-025-033-038-047-054-059-064-141-147-241500-/E.NEW.KNHC.TR.W.1001.100924T1200Z-000000T0000Z/800 AM AST FRI SEP 24 2010
JUPITER-INLET-FL 26.95N 80.06WFERNANDINA-BEACH-FL 30.66N 81.44W
$$
FLZ168-172-173-241500-/E.NEW.KNHC.TR.A.1001.100924T1200Z-000000T0000Z/800 AM AST FRI SEP 24 2010
CARD-SOUND-BRIDGE-FL 25.29N 80.37WJUPITER-INLET-FL 26.95N 80.06W
$$
ATTN...WFO...CHS...MLB...MFL...JAX...ILM...

PGEN
• Products – grids– Any grid size / projection can be created from the Contour DE
• Contour DE is a collection of multi- and single-point DEs• Includes info about field (eg., parameter, level, valid time, etc.)• Includes default rendering information (eg., contour interval)
– Contour DE allows for relative minima and maxima– Extended graph-to-grid algorithm
• Includes minima / maxima• Includes “bounded area” processing
– wave height contours in Atl cannot influence pts in Gulf– SPC Outlook only within CONUS
• Includes optional discrete interval processing
22

PGEN
• Products – images– Save XML file– Run script containing GEMPAK program
• Input XML file• Set DEVICE driver to desired format (PS, GIF, etc.)
– Same XML file can produce multiple displays• Device driver and projection independent
– Most NCEP web images derived via this method
23

What are we doing?
24
25
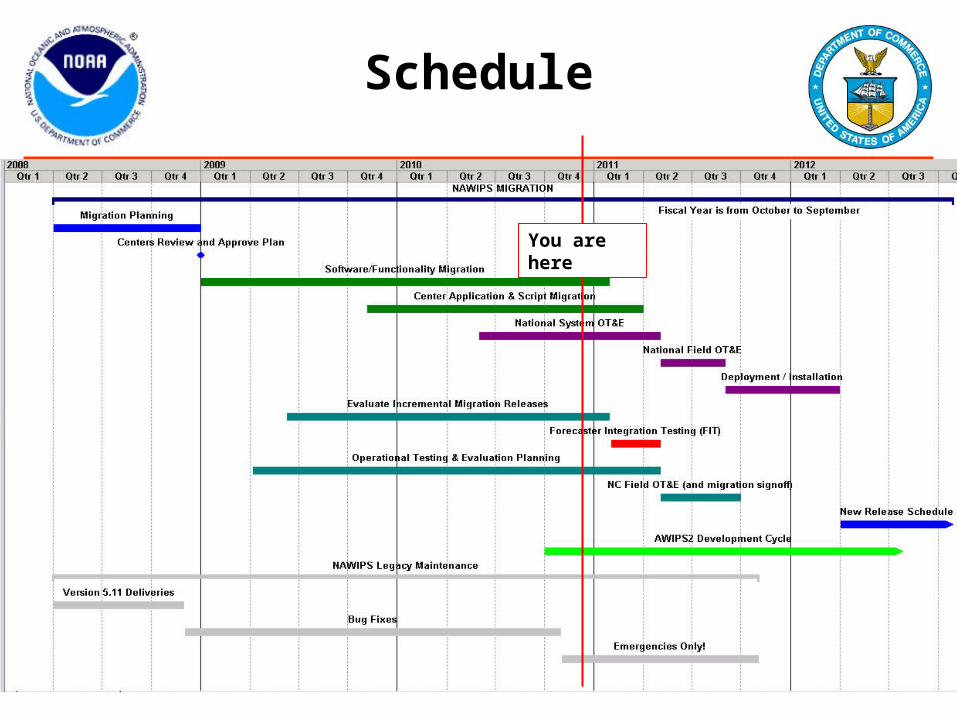
Schedule
You are here