Embed Size (px)
Citation preview

1
Measuring and analyzing customer satisfaction
Kan, Ch 14Steve Chenoweth, RHIT

2
Recall from Week 1
CSSE576 Learning Outcomes: Acceptance• Effectively verify customer
satisfaction.• On-site and beta testing• Customer surveys• Analyzing data

3
And from Week 2
How do we know if it’s “quality”?• Mean time to failure• Defect density• Customer problems• Customer
satisfaction…
Do you see “quality” here?
4
Customer Satisfaction Metrics
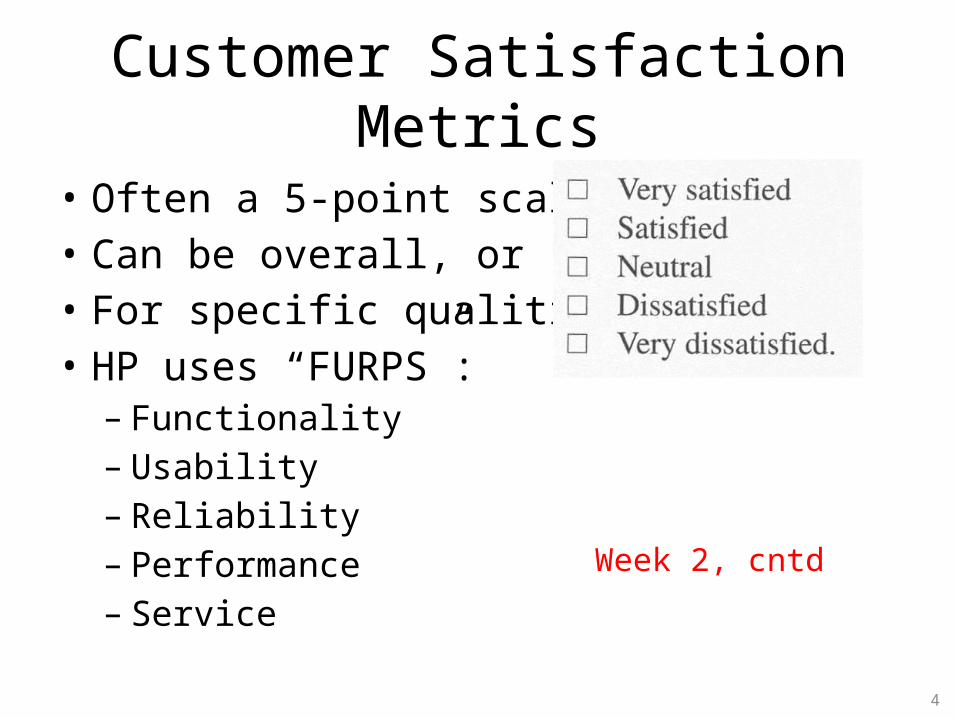
• Often a 5-point scale:• Can be overall, or• For specific qualities.• HP uses “FURPS”:– Functionality– Usability– Reliability– Performance– Service
Week 2, cntd

5
Customer Sat
• Can be expressed to the customer as a question, in different ways:
• Completely satisfied?• Satisfied?• Dissatisfied?• Neutral or worse?
Most commonly asked for
Week 2, cntd

6
Relative scope of the 3 metrics
• These are subset relationships
Week 2, cntd

7
And from Week 7 (last week)
Why availability?• In Ch 14 to follow, Kan shows that, in his studies,
availability stood out as being of highest importance to customer satisfaction.
• It’s closely related to reliability, which we’ve been studying all along.
Right – We’re not the only ones with availability problems. Consider the renewable energy industry!

8
So, on to cust sat proper!
• The ultimate validation of quality.• Tom Demarco claims that
Microsoft Word is a GreatProduct. Why?– So many people use it.
• TQM: Customer satisfaction is the direct link with ongoing use.– A leading indicator of
future sales.
Wham-O! A great product in action, 1957. 25 Millionwere sold in under 4 months.

9
It’s a real thing (psychologically)
• Starts with customer expectations prior to purchase. “Anticipated performance.”
• Could be, say (Miller, 1977):– Ideal– Expected– Minimum tolerable– Desirable
• Link is to perception of filling that need after purchase.– Does it perform
“as expected”?

10
The Disconfirmation Model• Compares expectations and perceived product
performance.• Traditional paradigm is based on:– Expectations– Performance– Disconfirmation– Satisfaction
• A sum of satisfactions over the features used.
• Has both cognitive and affective components.
CS = Customer Sat. The “Disconfirmation” proves indirectly the two ? Relationships.
11
Two marketing events are involved
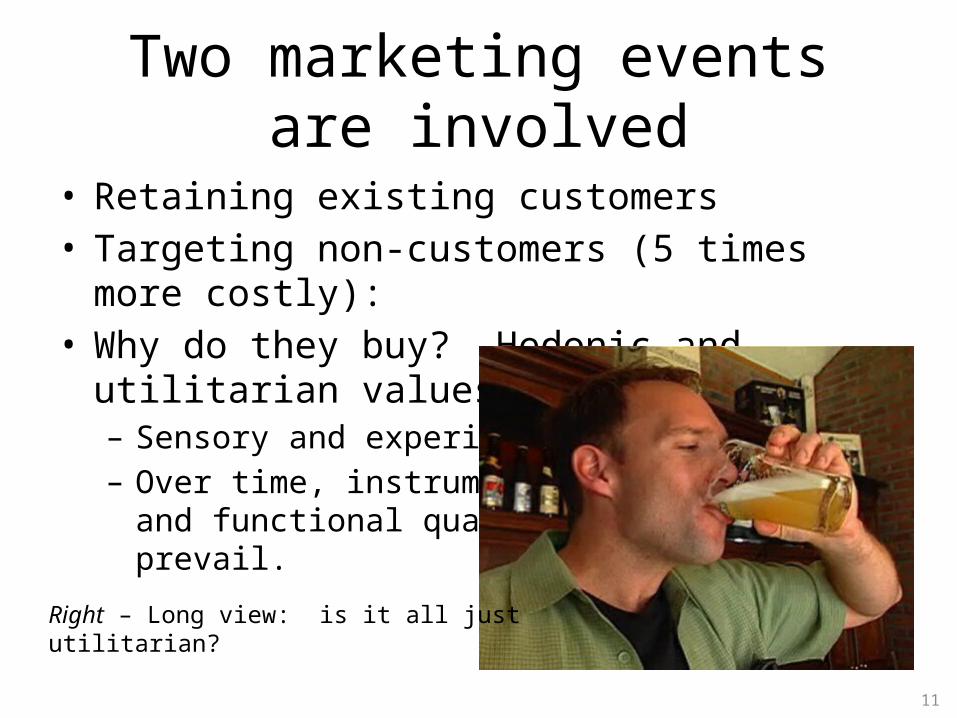
• Retaining existing customers• Targeting non-customers (5 times more costly): • Why do they buy? Hedonic and utilitarian values:– Sensory and experiential– Over time, instrumental
and functional qualities prevail.
Right – Long view: is it all justutilitarian?

12
Can you do better?
• In the 1990’s, at NCR, we tried for “customer delight.”
• Found it’s mighty hard to sustain!
Right – Here’s the problem:

13
Use surveys to measure?
• Maybe you already have the data?– Ongoing customer relationships with marketing– Complaint data– Customer visits– Customer advisory
councils & user conferences
– Trouble tickets• Or, it’s time for a
survey!
14
Different methods different results
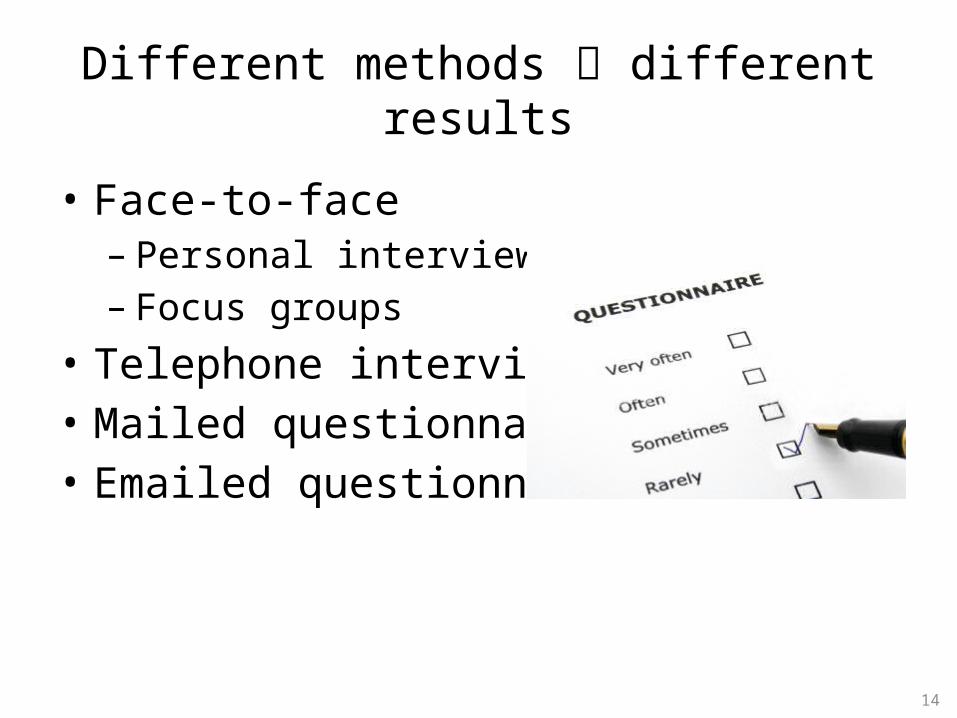
• Face-to-face– Personal interview– Focus groups
• Telephone interviews• Mailed questionnaires• Emailed questionnaires

15
Face-to-face
• High validity– You can read facial
expressions and gestures.– Easy to ask follow-up
questions.– Can use exhibits to aid
in explanations• But, interviewers also
tend to deviate fromthe agenda as theybuild a personal relationship!
“So, how do you like your new car sound system?” – Asked better if they were in the car?

16
Telephone interviews
• Less expensive• Easy to monitor for quality• Can be computer-aided• Easier to keep short• More balkers
Say, how about those new servers in the cloud!?

17
Mailed / emailed
• Looks like junk mail• Low response rates– Respondents may differ from those ignoring
• Questionnaire must be pre-validated– Need professional knowledge and experience
• How do you “sample” a large customer base?– It’s an art form

18
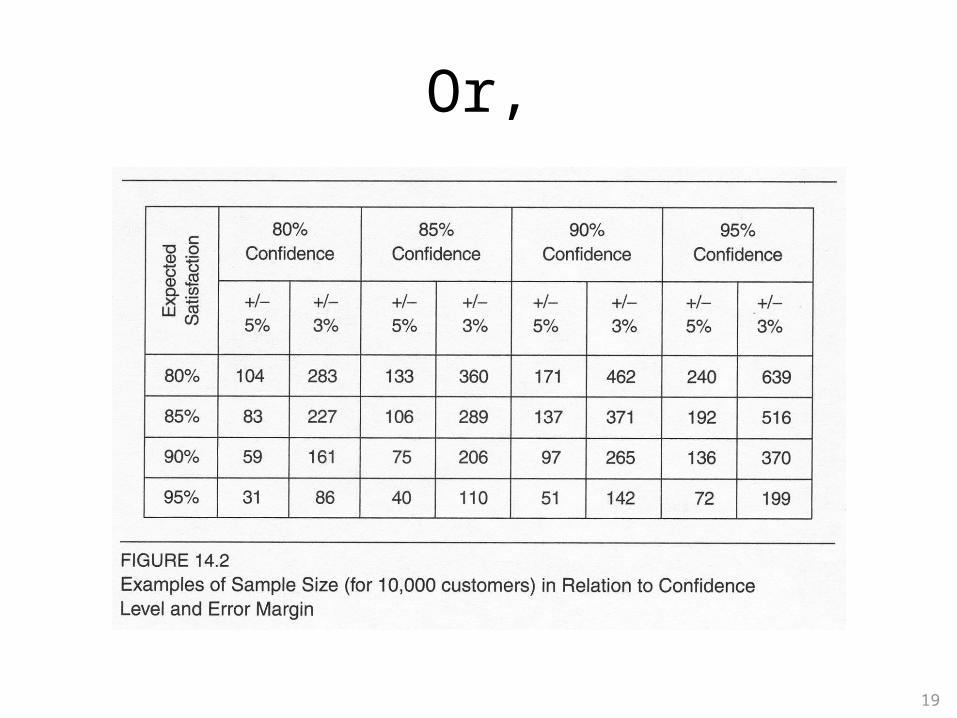
How big is big enough?
19
Or,

20
What rating scale to use?
• Most common:– Very satisfied– Satisfied– Neutral– Dissatisfied– Very dissatisfied
• Then look at thedistribution ofresponses…
The satisfied customer in action. Wait! They aren’t using the product!
21
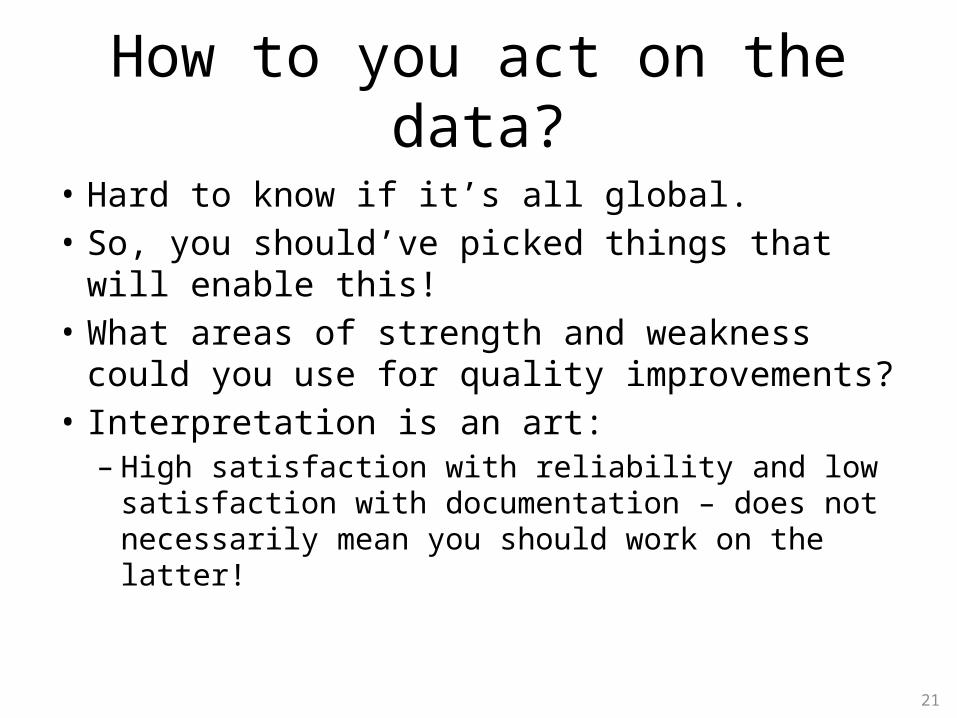
How to you act on the data?
• Hard to know if it’s all global.• So, you should’ve picked things that will
enable this!• What areas of strength and weakness could
you use for quality improvements?• Interpretation is an art:– High satisfaction with reliability and low
satisfaction with documentation – does not necessarily mean you should work on the latter!

22
Kan’s UPRIMD-A parameters

23
Multiple regression analysis

24
Logistic regression coefficients
25
How about organizational sat?
• This can color satisfaction with products.• Satisfaction and loyalty could be primarily
company-based.– Support and service span products.– Marketing does, too!– Company image is
considered.
26
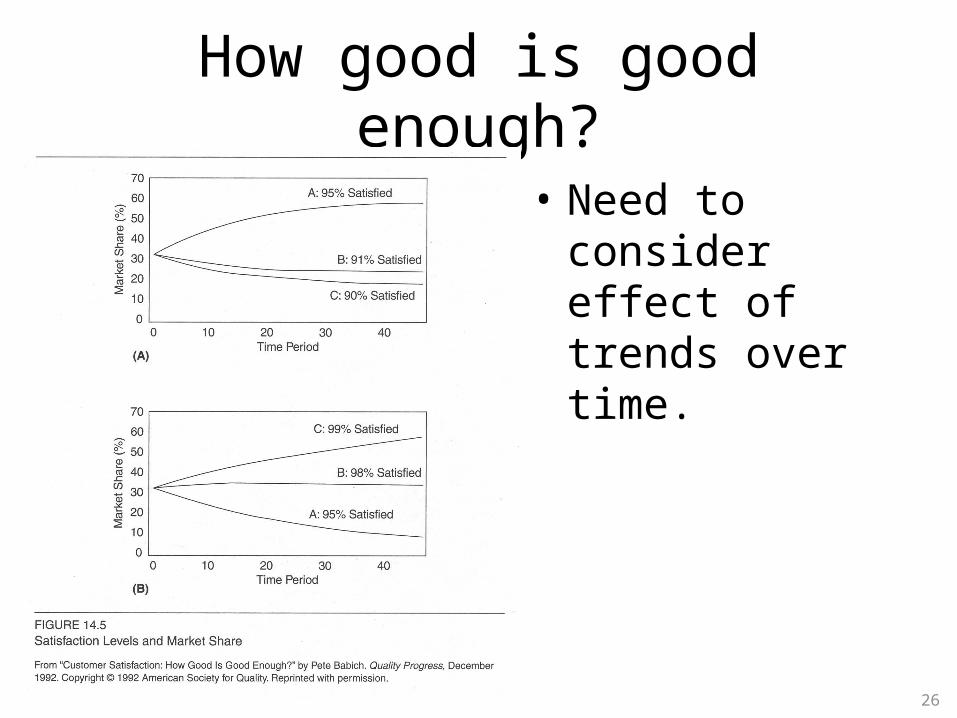
How good is good enough?
• Need to consider effect of trends over time.

27
Recommendations for small orgs
• Post-purchase call back program• Complaint management process*• Customer satisfaction survey program
*Likely to be most important!
• Leverage the benefits of customer involvement in:– Requirements– Design– Functional verification test– Various forms of customer testing


![Kristin Chenoweth - The Girl in 14G[1]](https://img.dokumen.tips/doc/110x75/55407b524a7959b41d8b4ae1/kristin-chenoweth-the-girl-in-14g1.jpg)


