Embed Size (px)
Citation preview

1
Local Government Partnership Meeting
June 8, 2009

2
Welcome and Introductions
Cindi Holmstrom, DirectorDepartment of Revenue

3
Announcements & Housekeeping Items
Miki Gearhart, Local Government Partnership Facilitator

4
2009 Legislative SessionDrew Shirk, Legislative LiaisonLegislation and Policy Division
• SB 5511 City-County Assistance Distribution
• SSB 5571 E-file/E-pay
• ESHB 2075 Digital Products
• SB 6173 Seller’s Permit
• ESSB 6170 Environmental Tax Incentives

Washington State Economic and Revenue Forecast Council
Economic and Revenue Outlook
Presented toDOR Local Government Partnership
Eric SwensonSenior Economic Forecaster
June 8, 2009Olympia, Washington

Eric Swenson
Economic and Revenue Outlook
8 Jun 2009
Slide 6 Washington State Economic and Revenue Forecast Council
Summary
• We expect the recession will trough in the 3rd quarter, followed by weak growth until mid-2010
• Our current outlook is modestly weaker than in March
• Washington’s economy will recover at the same time as the nation
• Job losses in the state are expected to continue through the end of 2009
• The unemployment rate is expected to continue to rise into 2010
• Excluding property tax, collections to date are about 7 percent below our March forecast.

Eric Swenson
Economic and Revenue Outlook
8 Jun 2009
Slide 7 Washington State Economic and Revenue Forecast Council
The recession trough is in sight
Recession trough in sight – rate of decline in activity slows or levels off, equity markets recover, initial jobless claims peak
Housing bubble bursts - sub-prime mortgage defaults trigger a credit crisis, bear market
Economy in recession – job losses; consumer and business spending falls
Recession trough – expected in Q3; activity turns around, but job losses continue
Slow recovery – job losses level off, but the unemployment rate keeps rising; housing will be late to recover
We are here
Recession trough in sight – rate of decline in activity slows or levels off, equity markets recover, initial jobless claims peak
State Revenues will recover only after the economic recovery gains traction -some time in the first half of 2010

Eric Swenson
Economic and Revenue Outlook
8 Jun 2009
Slide 8 Washington State Economic and Revenue Forecast Council
Bank lending to businesses and consumers is easing
Net Tightening minus EasingPercent
-40
-20
0
20
40
60
80
100
2000 2002 2004 2006 2008
For large and medium firms For small businessesCredit cards Other consumer loans
Source: Federal Reserve Board, Senior Loan Officers Quarterly Survey, data through April 2009 survey

Eric Swenson
Economic and Revenue Outlook
8 Jun 2009
Slide 9 Washington State Economic and Revenue Forecast Council
Corporate bond issuance volume is recovering
USD, billions
0
50
100
150
200
250
J an-08 Apr-08 J ul-08 Oct-08 J an-09 Apr-09
Source: SIFMA, data through April 2009
Y-T-D issuance is 50% higher than year ago, and 5 times what it was in the last four months of 2008

Eric Swenson
Economic and Revenue Outlook
8 Jun 2009
Slide 10 Washington State Economic and Revenue Forecast Council
The S&P 500 typically turns up two quarters prior to the recession trough
0.6
0.8
1
1.2
1.4
1.6
-12 -10 -8 -6 -4 -2 2 4 6 8 10 12
1973-75 1980-82 1990-91 2001
Quarters Prior Recession Trough Quarters AfterFor each recession, the S&P 500 index has been normalized to 1 at the recession trough
Source: S&P, NBER, ERFC
Eric Swenson
Economic and Revenue Outlook
8 Jun 2009
Slide 11 Washington State Economic and Revenue Forecast Council
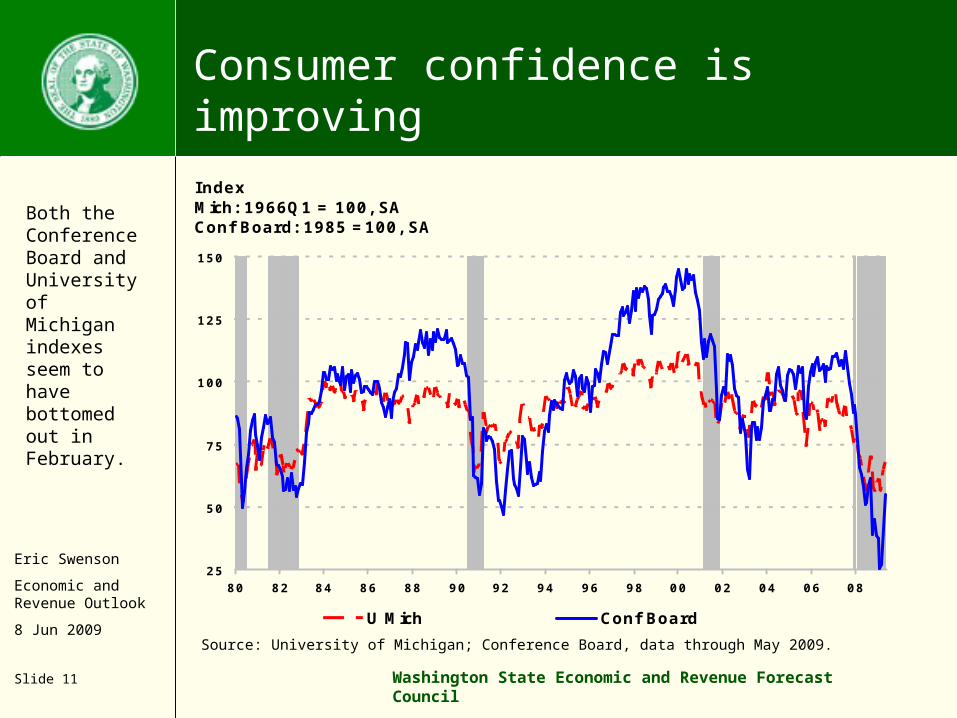
Consumer confidence is improvingIndex Mich: 1966Q1 = 100, SAConf Board: 1985 =100, SA
25
50
75
100
125
150
80 82 84 86 88 90 92 94 96 98 00 02 04 06 08
U Mich Conf Board
Source: University of Michigan; Conference Board, data through May 2009.
Both the Conference Board and University of Michigan indexes seem to have bottomed out in February.

Eric Swenson
Economic and Revenue Outlook
8 Jun 2009
Slide 12 Washington State Economic and Revenue Forecast Council
Initial jobless claims appear to have peaked
Initial Claims, SA, 4-wk MA
6,000
9,000
12,000
15,000
18,000
Jan 08 Mar 08 May 08 Jul 08 Sep 08 Oct 08 Dec 08 Feb 09 Apr 09
250,000
375,000
500,000
625,000
750,000
WA U.S.Source: ESD, ERFC, data through May 2009
Initial jobless claims appear to have peaked in late February for Washington and mid-March for the U.S.

Eric Swenson
Economic and Revenue Outlook
8 Jun 2009
Slide 13 Washington State Economic and Revenue Forecast Council
Housing starts have stopped declining
Thousands, SA, 3MMA
0
500
1000
1500
2000
2500
00 01 02 03 04 05 06 07 08 09
Single Family Total
The level of housing starts has been relatively stable since February.

Eric Swenson
Economic and Revenue Outlook
8 Jun 2009
Slide 14 Washington State Economic and Revenue Forecast Council
Automotive sales have stabilized at around 9 million, annualized
0
4
8
12
16
20
1990 1992 1994 1996 1998 2000 2002 2004 2006 2008
Mill
ion U
nits,
SA
AR
US Light Trucks US Cars
Source: Autodata Corporation; data through May 2009

Eric Swenson
Economic and Revenue Outlook
8 Jun 2009
Slide 15 Washington State Economic and Revenue Forecast Council
Source: Bureau of Economic Analysis, ERFC
SAAR, percent
-7.5%
-5.0%
-2.5%
0.0%
2.5%
5.0%
2008 2009 2010 2011
June March
The U.S. Real GDP forecast shows a mildly slower recovery than in March
SAAR, percent
-7.5%
-5.0%
-2.5%
0.0%
2.5%
5.0%
2008 2009 2010 2011
June March
U.S. Real GDP

Eric Swenson
Economic and Revenue Outlook
8 Jun 2009
Slide 16 Washington State Economic and Revenue Forecast Council
The recovery in WA personal income growth is expected to match the nation’s
Percent change, year ago
-3
0
3
6
9
12
15
80 83 86 89 92 95 98 01 04 07 10
Washington U.S.
Source: ERFC June 2009 preliminary forecast; actual data through 2008Q4

Eric Swenson
Economic and Revenue Outlook
8 Jun 2009
Slide 17 Washington State Economic and Revenue Forecast Council
Source: Bureau of Economic Analysis, ERFC
The outlook for personal income growth is weaker in the near term
WA nominal personal income growth
Y/ Y percent
-2.5%
0.0%
2.5%
5.0%
7.5%
2008 2009 2010 2011
June March

Eric Swenson
Economic and Revenue Outlook
8 Jun 2009
Slide 18 Washington State Economic and Revenue Forecast Council
WA employment lagged the nation in the downturn, but will recover at about the same rate as the nation
Percent change, year ago
-6
-4
-2
0
2
4
6
8
80 83 86 89 92 95 98 01 04 07 10
Washington U.S.
Source: ERFC June 2009 forecast, actual through April 2009
Eric Swenson
Economic and Revenue Outlook
8 Jun 2009
Slide 19 Washington State Economic and Revenue Forecast Council
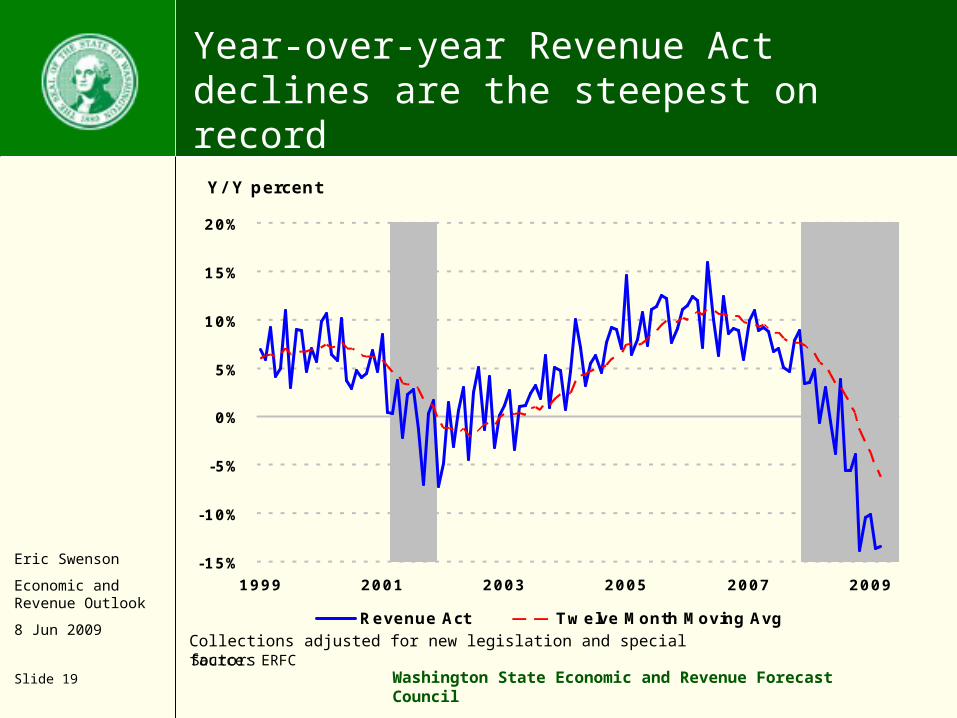
Year-over-year Revenue Act declines are the steepest on record
Y/ Y percent
-15%
-10%
-5%
0%
5%
10%
15%
20%
1999 2001 2003 2005 2007 2009
Revenue Act Twelve Month Moving AvgCollections adjusted for new legislation and special factorsSource: ERFC

Eric Swenson
Economic and Revenue Outlook
8 Jun 2009
Slide 20 Washington State Economic and Revenue Forecast Council
The gap between income and taxable activity has widened
Net Revenue Act Collections* and State Personal Income
-15%
-10%
-5%
0%
5%
10%
15%
20%
1987 1990 1993 1996 1999 2002 2005 2008
Percent Change, year ago
Adjusted Revenue Act Collections Personal Income
* Adjusted for new legislation and special factors
Source: ERFC

Eric Swenson
Economic and Revenue Outlook
8 Jun 2009
Slide 21 Washington State Economic and Revenue Forecast Council
Revenue growth relative to income continues to drop
* Adjusted for new legislation and special factors
Source: ERFC; data through 2009Q1
Growth in Net Revenue Act Collections* Relative to Growth in State Personal Income
-15%
-10%
-5%
0%
5%
10%
87 91 95 99 03 07Y-O
-Y G
row
th in
Pers
on
al In
com
e M
inu
s R
evA
ct
Gro
wth

Eric Swenson
Economic and Revenue Outlook
8 Jun 2009
Slide 22 Washington State Economic and Revenue Forecast Council
Taxable Sales Growth: Retail and Non-Retail Trade
-15%
-10%
-5%
0%
5%
10%
15%
1991 1994 1997 2000 2003 2006
Ch
an
ge f
rom
Year-
Ag
o Q
uart
er
Retail Trade (NAICS 44-45) Non Retail Trade
The decline in non-retail trade caught up to the decline in retail trade in the fourth quarter.
Retail trade represented 43.6 percent of taxable activity in the fourth quarter of 2008.
The decline in taxable retail sales steepened in the fourth quarter
Eric Swenson
Economic and Revenue Outlook
8 Jun 2009
Slide 23 Washington State Economic and Revenue Forecast Council
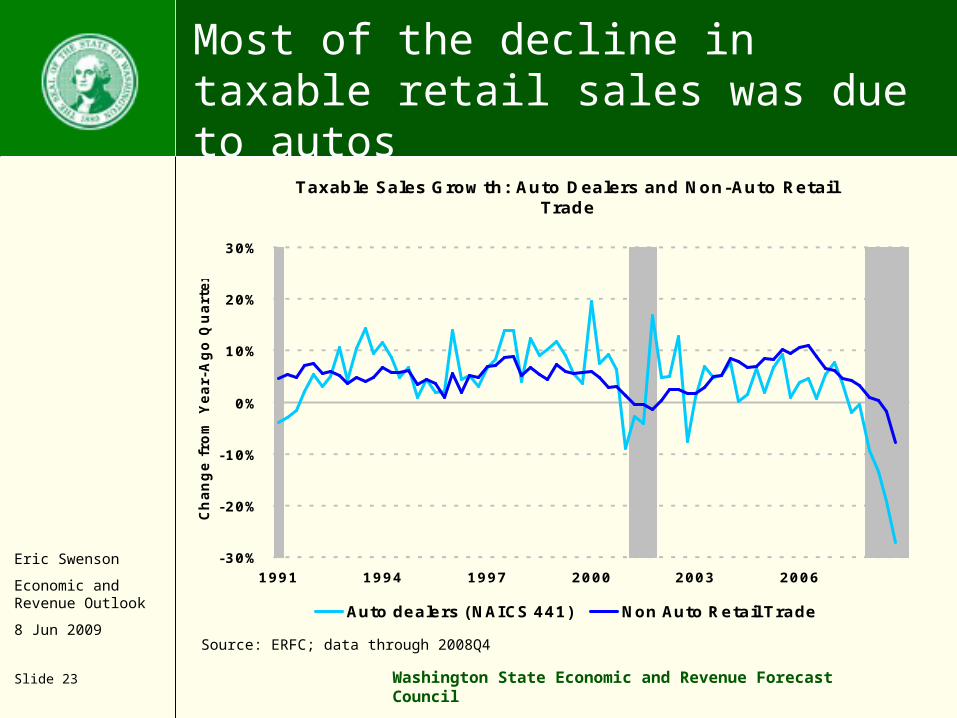
Most of the decline in taxable retail sales was due to autos
Taxable Sales Growth: Auto Dealers and Non-Auto Retail Trade
-30%
-20%
-10%
0%
10%
20%
30%
1991 1994 1997 2000 2003 2006
Ch
an
ge f
rom
Year-
Ag
o Q
uart
er
Auto dealers (NAICS 441) Non Auto Retail Trade
Source: ERFC; data through 2008Q4

Eric Swenson
Economic and Revenue Outlook
8 Jun 2009
Slide 24 Washington State Economic and Revenue Forecast Council
WA motor vehicle sales have yet to level off
WA New Vehicle Registrations
5
10
15
20
25
1990 1994 1998 2002 2006
2
4
6
8
10
Car Truck
Thousands, sa, 3mmaCar Truck
Source: WA State DOL, Data through April 2009

Eric Swenson
Economic and Revenue Outlook
8 Jun 2009
Slide 25 Washington State Economic and Revenue Forecast Council
B&O activity "fell off a cliff" in the fourth quarter
Growth of Taxable B&O Income
-15%
-10%
-5%
0%
5%
10%
15%
20%
1991 1994 1997 2000 2003 2006
Ch
an
ge f
rom
Year-
Ag
o Q
uart
er
Source: ERFC; data through 2008Q4
Eric Swenson
Economic and Revenue Outlook
8 Jun 2009
Slide 26 Washington State Economic and Revenue Forecast Council
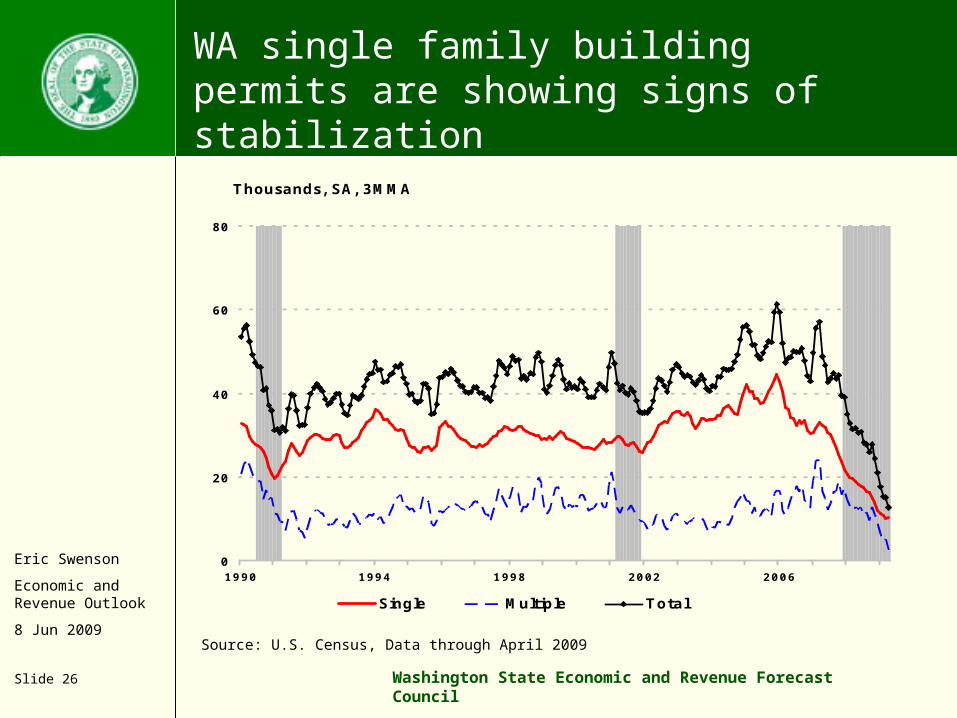
WA single family building permits are showing signs of stabilization
Thousands, SA, 3MMA
0
20
40
60
80
1990 1994 1998 2002 2006
Single Multiple Total
Source: U.S. Census, Data through April 2009

Eric Swenson
Economic and Revenue Outlook
8 Jun 2009
Slide 27 Washington State Economic and Revenue Forecast Council
Source: Bureau of Economic Analysis, ERFC
The outlook for housing is weaker
Y/ Y percent
-75%
-50%
-25%
0%
25%
50%
75%
100%
2008 2009 2010 2011
June March
WA housing permits

Eric Swenson
Economic and Revenue Outlook
8 Jun 2009
Slide 28 Washington State Economic and Revenue Forecast Council
Is the decline in Real Estate Excise Tax coming to an end?
USD, billions
0
1
2
3
4
5
6
7
8
9
10
90 92 94 96 98 00 02 04 06 08
Source: ERFC, data through May 2009
WA Taxable REET Activity, SA

Eric Swenson
Economic and Revenue Outlook
8 Jun 2009
Slide 29 Washington State Economic and Revenue Forecast Council
REET improvement is likely to come from more transactions, not value
*Taxable activity divided by the total number of transactions.
Activity based on real estate excise tax paid at closing.
Real Estate Activity - Number of Transactions and Value Per Transaction*
-60%
-40%
-20%
0%
20%
40%
60%
80%
1988 1992 1996 2000 2004 2008
Percent Change, year ago
Total Number of Transactions Value per Transaction
Source: ERFC, data through March 2009
Eric Swenson
Economic and Revenue Outlook
8 Jun 2009
Slide 30 Washington State Economic and Revenue Forecast Council
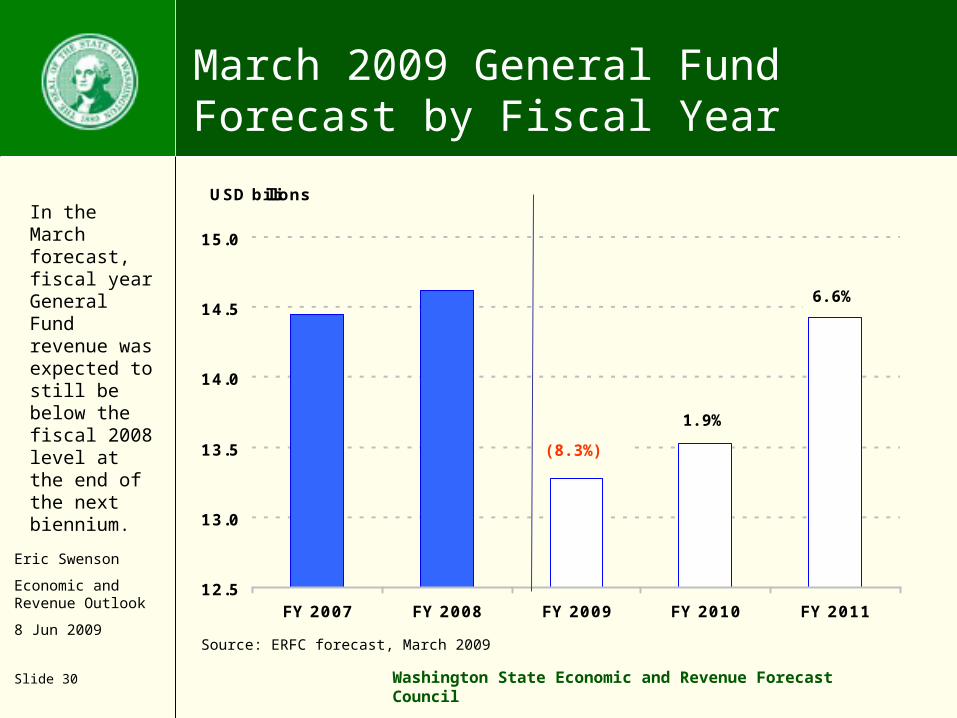
March 2009 General Fund Forecast by Fiscal Year
USD billions
12.5
13.0
13.5
14.0
14.5
15.0
FY 2007 FY 2008 FY 2009 FY 2010 FY 2011
(8.3%)
1.9%
6.6%
Source: ERFC forecast, March 2009
In the March forecast, fiscal year General Fund revenue was expected to still be below the fiscal 2008 level at the end of the next biennium.

Eric Swenson
Economic and Revenue Outlook
8 Jun 2009
Slide 31 Washington State Economic and Revenue Forecast Council
Conclusion
• The economy is still likely to bottom out at the same time as we had estimated in March, but at a lower level of activity
• Washington’s economy is well positioned to recover at the same time as the nation
• The recovery in state revenues will lag the recovery in activity
• Stay tuned for our next revenue forecast on June 18th.

Eric Swenson
Economic and Revenue Outlook
8 Jun 2009
Slide 32 Washington State Economic and Revenue Forecast Council
Questions
Economic & Revenue Forecast Council1025 E. Union Avenue, Suite 544Olympia WA 98504-0912
www.erfc.wa.gov360-570-6100

33
Valerie L. Torres
DOR Research Division
Impact of the Economy on Property Tax Levies

34
Past levy + additions
Additions: Limit factor (aka – “one percent” or “101 percent”) New construction, improvements, wind turbines Change in state-assessed properties
Property Tax – Regular Levies

35
Taxing district with population < 10,000–101 percent (additional 1 percent)
Taxing district with population > 10,000–The lesser of
•101 percent•100 percent + “inflation”
Inflation: Percentage change in the Implicit Price Deflator (IPD)
Limit Factor

36
History of Inflation
Percent Change in IPD
1.90%1.42%
2.61%
1.89%
1.16%
1.84%
2.39%2.54%
3.42%
2.084%
4.527%
0.85%
0.00%0.50%
1.00%1.50%
2.00%2.50%
3.00%3.50%
4.00%4.50%
5.00%
1998 1999 2000 2001 2002 2003 2004 2005 2006 2007 2008 2009
Taxes Due in

37
In March 2009 the Washington Economic Revenue and Forecast Council predicted a negative percentage change in the IPD.
What happens with a negative IPD?Limit Factor = 100% + (-1.00%) = 99%
Levies would not grow!
Taxing districts with a population of more than 10,000 could increase the limit factor to 101 percent with a finding of substantial need.
Any taxing district can exceed the limit factor with the approval of a majority of the voters (lid lift).
Percentage Change in the IPD

38
Levies are fairly constant.
So when the levy is constant, if the value increases, then the rate decreases.
Similarly, if the value decreases, then the rate increases.
In March 2009 the Washington Economic Revenue and Forecast Council predicted a negative percentage change in market value.
Rate = Levy / Value

39
Market Value
Percentage Change in Market Value
7.69% 8.08% 8.78% 7.97%5.88%
4.16%6.46%
13.15%
19.33%
15.28%
6.48%4.76%
(6.31)%
(9.38)%
(15.0)%
(10.0)%
(5.0)%
0.0%
5.0%
10.0%
15.0%
20.0%
25.0%
1999 2000 2001 2002 2003 2004 2005 2006 2007 2008 2009 2010 2011 2012
Taxes Due InYellow highlighted values are forecasted -- all others are actuals

40
Most taxing districts will not be impacted.
However, taxing districts which have both
1. A levy rate close to the statutory maximum rate and
2. A value decline
Could have a levy limited by the statutory maximum rate.
If Market Value Declines …

41
State Levy Collections
State Levy Collections
0%
5%
10%
15%
20%
25%
30%
35%
40%
Mar
chApr
ilM
ayJu
ne July
Augus
t
Septe
mbe
r
Octo
ber
Novem
ber
Decem
ber
Janu
ary
Februa
ry
Month
Pe
rce
nta
ge
of
To
tal
2002-03
2004-05
2006-07
2008-09

42
Statewide Property Tax Collections
Collections Percent as Percent of
Year Collections Current Roll Recession Dates
1984 92.5 99.31983 92.6 100.71982 90.8 100.0 July 1981 - November 19821981 89.8 99.2 July 1981 - November 19821980 89.3 98.3 January 1980 - July 19801979 91.7 100.0
Decrease in collections for the year
After a year or two the percentage of the current roll increases, usually to over 100 percent, indicating the payment of back taxes.

43
Property Tax Special Notice
“Determining the Limit Factor for Increases in Property Tax Levies,” Issued April 22, 2009
Property Tax Statistics
Department of Revenue web site, under “About Us,” under “Get Statistics and Reports”
Statistics for taxes due in 2009 available in September.
Available Sources of Data

44
2009 Property Tax Legislation
David Saavedra, Property Tax Division

45
• E2SHB 1208 – Property tax administration
• HB 1295 – Relating to agricultural fairs
• 2SHB 1484 – Relating to habitat open space
• HB 1619 – School levies used for M & O (maintenance and operation)
• SHB 1733 – Relating to the property tax current use valuation programs
• EHB 1815– Relating to current use valuation under the farm and agricultural land classification
• HB 2331 – Increases document recording fees from $10 to $30.
• 2SSB 5045 – Regarding community revitalization financing
• SB 5355– Regarding initial levy rates for rural county library districts.
• SSB 5368 – Relating to making provisions for all counties to value property annually for property tax purposes
• SSB 5401 – Relating to habitat open space
• SB 5426 – Annexation to a fire district.
• 2SSB 5433 – Relating to modifying provisions of local option taxes
• SB 5680 – Relating to the property tax exemption for non profit artistic, scientific, historical, and performing arts organizations
• E2SSB 5688 – Further expanding the rights and responsibilities of state registered domestic partners
• ESSB 5901 – Relating to modifying provisions of the local infrastructure financing tool program
46
The Leasehold Excise Tax and Tenant Refunds
Stuart ThronsonAssistant Director, Special Programs

47
■ Leasehold Excise Tax Overview
■ RCW 82.29A.120 – Allowable Credit
■ Current use of the Credit and why it’s important
■ Causes
■ How you can help get the right answer
■ What DOR can do to help
For Today…

48
The Leasehold Excise Tax
■ An excise tax on the private lease of public property (82.29A RCW)
■ In lieu of Property Tax
■ Levied on contract rent
■ Current rate is 12.84%
6% is county and city
6.84% is state
■ Collected and reported to DOR by the lessor

49
RCW 82.29A.120 – Allowable Credit
1) With respect to a leasehold interest … there shall be allowed a credit against the tax as otherwise computed equal to the amount, if any, that such tax exceeds the property tax that would apply to such leased property ... if it were privately owned by the lessee…

50
Current use of the Credit
Tenants notify DOR or the public lessor and request a refund of overpaid LET.
DOR makes a determination of whether LET has been overpaid.
We research the value of the property as shown by the County Assessor and calculate the property
tax.
DOR than issues a refund and adjusts the local LET distribution to reflect the local’s portion of the refund.

51
Why an issue?
The average Property Tax Levy Rate in WA for calendar year 2008 was $9.72 per thousand (the LET excise tax is 12.84%).
Public property values are often not kept current at the county level.
Low (or zero) assessed property values multiplied by low levy rates equals large LET refunds under the credit.

52
Why an issue?
In FY 2008 DOR issued $4.9 million in LET refunds
State Portion $2,656,076
Local Portion $2,243,924
$2.4 million was to one taxpayer in one Port District
Total LET collections for FY08 were $41.7 million
In FY 2009 to date DOR has issued $1.2 million in refunds

53
Why an issue?
Achieves a legal result, but probably not the right result.
Creates an uneven playing field.
Puts stress on Local tax coffers
Refunds are being made for prior periods
Administratively a burden for all

54
What can you do?
Monitor your LET property assessed values.
When was the last time appraised?
Recent improvements?
Work with the County Assessor to maintain current values
Ask DOR for assistance.

55
What is DOR doing?
Currently in the process of sending all public entity LET reporters an offer of assistance letter.
DOR offers to review rent data and derive an advisory property value at the parcel level via an income valuation method.

56
BREAK
57
Reviewing the Mitigation Detail Files
Matthew BryanDOR, Research Division

58
Miki Gearhart
DOR, Legislation and Policy Division
2009 Legislation Highlights - Local Sales/Use Taxes

59
2SHB 1290 Tourism Promotion Areas – Lodging charges
SHB 1751 Rural County Tax for public facilities – Extension of time
EHB 2299 Public Facilities Districts – Formation, operation, & non-state funding
2SSB 5045 Local Revitalization Financing (LRF) – State funding for local infrastructure
ESSB 5321 Annexation Services Tax – Large annexations, certain annexing cities
2SSB 5433 Modifying Provisions of Local Option Taxes – Non-supplant removed
SB 5511 City-County Assistance (6050 Distributions) – Data and SST mitigation
SB 5540 High Capacity Transportation Service
ESSB 5901 Modifying Local Infrastructure Financing Tool (LIFT) Program Provisions
2009 Legislation Highlights - Local Sales/Use Taxes
60
Current Law:
Cities and counties can create tourism promotion areas (TPA), except King Co. and cities in King Co.
Lodging facilities within the TPA will collect a lodging charge for each night of stay
Lodging charges can be up to $2 per night of stay
The rate of charge can depend on up to 6 different criteria
Highlights of 2SHB 1290:
King Co and cities in King county can now create TPAs
Local Tourism Promotion Areas (2SHB 1290)

61
Quick review of how state-shared local sales/use taxes work
State Sales/Use Tax State Tax 6.5%State-Shared Local Sales/Use Taxes Rural County Tax for Public Facilities 0.09% 6.5% City Annextion Tax 0.2% -1.82% City/County LIFT Tax 1.0% 4.68% City/County LRF Tax 0.5% Distributed to State PFD Regional Ctr 0.033%Subtotal 1.82%Local Sales/Use Taxes 1.82% City/County Basic 0.5% 1.7% City/County Optional 0.5% 3.52% Criminal Justice 0.1% Distributed to Local Governments Transit 0.2% Public Health/Safety 0.3% County Chem/Mental Health 0.1%Subtotal 1.7%
8.2%Total Combined State and Local Sales/Use Tax rate paid by consumer
Example: city location code area (not a real city)

62
Current Law:
A state-shared local sales tax with maximum rate 0.09% and used for fund public facilities in rural counties
Counties eligible to impose the tax are those with an average population density of less than 100 residents per square mile or counties that are smaller than 225 square miles
Tax first authorized July 1, 1998 at a .04% rate and limited to 25 years from date first imposed
32 counties impose the tax
Rural county tax – Extension of time (SHB 1751)

63
Highlights of EHB 1751:
The 25 year limit is reset from the date the tax was first imposed at a 0.09% rate as long as the rate was increased to 0.09% before August 1, 2009. (Most counties increased their rate to 0.09% in 2007, but a few increased the rate in 2008 and 2009.)
Rural county tax – Extension of time (SHB 1751)

64
Highlights of 2SSB 5045:
New program administered by DOR - New form of tax increment financing to fund local infrastructure
To seek a limited amount of state funding through a state-shared local sales/use tax, the city, county, or port that creates a revitalization area must apply to the Department.
Establishes 7 demonstration projects that can be approved by the Department in 2009 (applications due no later than Sept 1)
Allows additional project applications for a state contribution to be approved on a first-come basis (applications accepted beginning Sept 1, 2009)
MORE DETAILS – NEXT ON THE AGENDA
Local Revitalization Financing (LRF) (2SSB 5045)

65
Current Law:
Cities in King, Snohomish, and Pierce counties (except Seattle)
Must commence annexation before January 1, 2010
May impose a state-shared “annexation tax” for up to 10 years (city-wide not just in annexation area)
Used to provide, maintain, and operate municipal services for the annexation area. Annexation tax revenues limited to amount needed the fill the funding gap to provide services for the annexation area
Annexation Tax - Certain Annexing Cities (ESSB 5321)

66
Current Law continued:
Tax rate depends on size of annexed area
0.1% for each annexation area with a population between 10,000 and 20,000
0.2% for an annexation area with a population over 20,000
The maximum cumulative tax rate a city can impose is 0.2 percent.
Annexation Tax - Certain Annexing Cities (ESSB 5321)

67
Highlights of ESSB 5321:
The date when annexations must be commenced to qualify is extended to January 1, 2015 and “commenced” is clarified
Each subsequent rate increase due to new qualified annexation area has it’s own 10 year limit
The maximum tax rate increased from 0.2 percent to 0.3 percent, beginning July 1, 2011, if the city commenced annexation of an area before January 1, 2010, that would have otherwise allowed the city to increase the rate.
Annexation Tax - Certain Annexing Cities (ESSB 5321)
68
More highlights of ESSB 5321:
Allows Seattle to impose the annexation tax for an annexation having certain characteristics with a max rate of 0.85% but limited to $5 million a state fiscal year. Annexation tax at this rate may not be used for more than one annexation
Bellevue can qualify for the annexation tax if the city annexes an area with a population over 4,000.
Annexation Tax - Certain Annexing Cities (ESSB 5321)

69
Current Law:
In 2005, the city-county assistance account (CCAA) was created in ESSB 6050. City-County assistance account distributions are sometimes referred to as “6050 distributions”
The CCAA provides funds to cities and counties that were most severely impacted by the repeal of the motor vehicle excise tax. The CCAA is funded by a portion (1.6 percent) of state real estate excise tax revenues.
Distributions from the CCAA are made quarterly based on amounts certified by the Dept. of Revenue by March 1st of each year.
Elements of the formulae used to determine the amounts to be distributed include local sales tax revenues, assessed property values, and population.
City-County Assistance (SB 5511)

70
Highlights of SB 5511:
Certification date changed from March 1st to October 1st, beginning October 1, 2009.
A 30-day review period of the Department's certification each year is provided
After the certification becomes final, no changes may be made to the certification.
City-County Assistance - 6050 Distributions (SB 5511)

71
More highlights of SB 5511:
Incorporates streamlined sales tax (SST) mitigation payments into the determination of eligibility for, and amounts of, distributions from the CCAA.
SST mitigation distributions are treated as annual distributions of local sales and use taxes imposed by the city or county
Includes, after an initial transition period, fiscal year data for both local sales tax distributions and SST mitigation payments in calculating CCAA distributions, instead of using calendar year data.
City-County Assistance - 6050 Distributions (SB 5511)

72
Current Law:
A form of tax increment financing used by some cities and counties to finance local public improvement projects intended to encourage economic development or redevelopment.
Annual increases in revenues from local sales and use taxes and local property taxes are measured and used to pay bonds issued to finance the public improvements.
The state contribution is in the form of a state-shared local sales and use tax (LIFT tax) – max $1 million per year for 25 years
Community Economic Revitalization Board (CERB) awarded nine projects throughout the state -- Applications are no longer accepted.
Modifying Local Infrastructure Financing Tool (LIFT) (ESSB 5901)

73
Highlights of ESSB 5901:
Limitations on the rate for the state-shared LIFT tax are clarified
Existing LIFT jurisdictions must select a LIFT tax rate by September 1, 2009, for the max LIFT tax that will eventually be imposed
Incremental state and local sales and use tax revenue will be based on estimates made by sponsoring local governments rather than measurements made by DOR (DOR will assist if requested)
Modifying Local Infrastructure Financing Tool (LIFT) (ESSB 5901)

74
More highlights of ESSB 5901:
After the first year that the local government estimates the state has benefited through increased tax revenues as much as the LIFT award amount, the annual state contribution awarded is only limited to the amount of local matching funds dedicated in the preceding year
Requirement to issue bonds by end of 5th year is modified. LIFT tax will cease after the end of the 5th year if the no indebtedness is issued and no construction of the public improvements commenced in the RDA
Required information in annual reports submitted by a sponsoring local government are expanded
Modifying Local Infrastructure Financing Tool (LIFT) (ESSB 5901)

75
Implementation information and DOR contacts for 2009 local sales/use tax related legislation will be posted to local government web page as soon as possible
In the mean time…
Questions?
Miki Gearhart
Legislation & Policy Division
360 570-6127
James Petit
Tax Account Administration
360 902-7037

76
June 2009
Local Revitalization Financing (LRF)
James Petit DOR, Tax Account Administration Division

77
Presentation Outline
Overview of LRF Program
Application Process and Steps
State-shared Local LRF Tax (state contribution)
Local Matching Funds
Estimating/Measuring Growth in Revenues
Annual Reporting
DOR Contacts

78
LRF Legislation
Chapter 270, Laws of 2009
Second Substitute Senate Bill 5045
Community Revitalization Financing
Effective Date: 07/26/2009

79
What is Local Revitalization Financing(LRF)?
• Essentially a form of tax increment financing
–Estimates the growth of certain state and local tax revenues from economic development in a specified area as a result of local public improvements
–Allows use of incremental local tax revenues to pay for local public improvements
–Provides a limited amount of state funding to pay for public improvements as long as there is a local match and anticipated growth in state revenues that equal or exceed the state contribution

80
Who can apply for a state contribution through the LRF program?
• Only cities, counties, and ports can be sponsoring local governments and apply for a state contribution
Note: If a port applies, a city or county must be a joint sponsor because the state contribution comes in the form of a state-shared local sales tax that must be imposed.
81
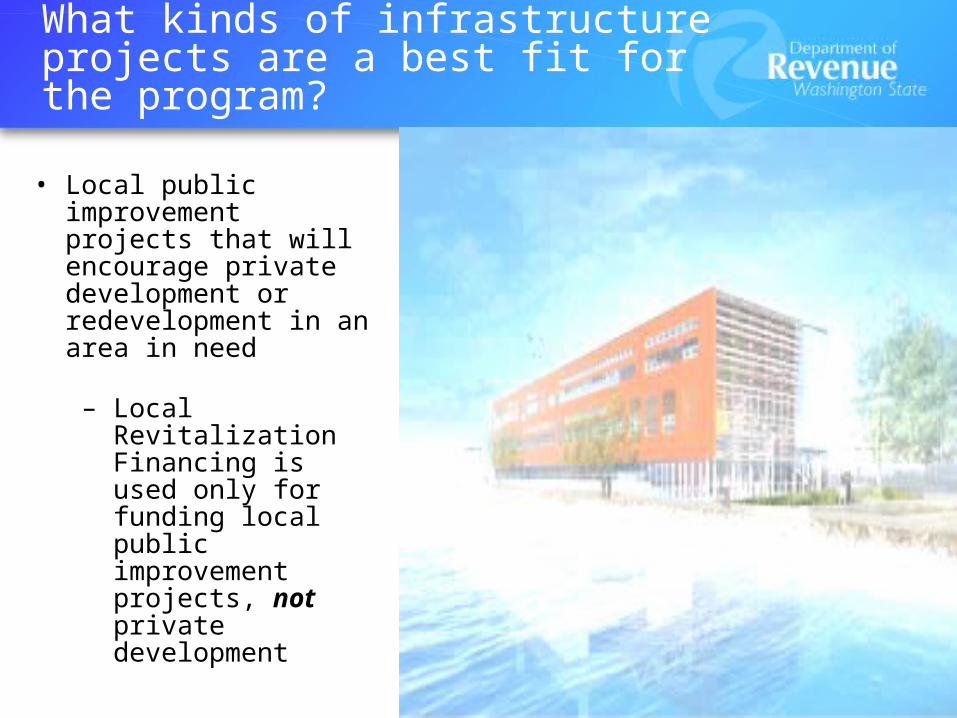
What kinds of infrastructure projects are a best fit for the program?
• Local public improvement projects that will encourage private development or redevelopment in an area in need
– Local Revitalization Financing is used only for funding local public improvement projects, not private development

82
Types of infrastructure projects – best fit continued
• Projects that can be ready to move forward fairly quickly
• Projects that once complete will generate enough increases in state and local sales/use tax revenue and/or increases in state and local property tax revenue to meet the funding mechanism requirements and other conditions

83
What kinds of public improvements can be financed?
For a complete list of public improvements and public improvement costs, see the definition in sections 102(15) & (16) of 2SSB 5045.
Some of the improvements include such things as:
– Roads, bridges, rail, sidewalks, streetlights
– Water & sewer systems, utility infrastructures
– Parking facilities, recreation areas
– Environmental remediation
84
Application Process for a State Contribution

85
Two types of applicants that will apply for state funding under LRF
1. Demonstration projects
• Specified in statute
• Must apply no later than Sept. 1, 2009
2. Projects applying on a first-come basis
• Applications may be accepted beginning Sept. 1, 2009

86
Differences in types of project applicants
Demonstration projects
–Max award less than $500,000 per year per project, in most cases
–May impose state-shared LRF tax beginning July 1, 2010 as long as general obligation bonds have been issued
–Can opt-out of demo project status and instead apply on a first-come basis
Projects applying on a first-come basis
–Maximum award amount is $500,000 per year per project
–May impose state-shared LRF tax beginning July 1, 2011 as long as general obligation bonds have been issued; and
–Estimate that in the previous calendar year the state has benefited through increased tax revenues as much as the award for state contribution

87
What level of state funding is available for the LRF program statewide?
$4.75 million statewide per year for state contributions
$2.25 million a year set aside for the total number of demonstration projects
$2.5 million a year set aside for the total number of projects approved on a first-come basis

88
Demonstration projects – max awards per year
Whitman County $200,000
University Place $500,000
Tacoma $500,000
Bremerton $330,000
Auburn $250,000
Vancouver $220,000
Spokane $250,000
$2.25 Million

89
Projects awarded on a first-come basis
$2.5 Million
Applications must be completed fully and submitted electronically to be approved
DOR system will accept only one application at a time
Projected state and local incremental revenues must justify the amount of award requested
The sponsoring local government’s taxable base for sales/use tax, combined with the available state-shared LRF sales tax rate, must be able to produce the award amount requested

90
When will LRF applications be ready for distribution?
• DOR is currently working on applications for both demonstration projects and projects that will apply on a first-come basis
• Target date for demonstration project application to be ready for circulation is June 30, 2009
• Mock applications, spreadsheets, and a second webinar will be available at a future date to be determined (first webinar is on June 9)
• Target date for electronic application form for projects applying on a first-come basis is mid August
91
Steps to take before applying to DOR (All Projects)
• Develop boundaries for the proposed RA
• Decide what public improvements will be proposed for financing
• Provide notices to, and partner with, other local governments and taxing districts
• Publish notices and hold a public hearing to establish a “revitalization area” (RA)

92
More steps to take before applying
• Enter into a contract with or obtain a letter of intent to develop in the RA from a private developer
– Ensure that proposed development is consistent with countywide planning, comp plan, and development regulations
• Estimate the expected state and local incremental tax revenues resulting from public improvements and private development
Note: If DOR assistance is needed to estimate incremental revenues, contact DOR early in the process

93
More steps - continued
• Determine the rate of LRF tax that is needed to generate the LRF award amount that will be requested (DOR can assist if needed)
• Make findings as required in 2SSB 5045, Section 103
• Adopt an ordinance/resolution creating the RA and enter into interlocal agreement with participating local government, if needed
• If the RA boundaries overlap a revenue development area (RDA) under chapter 39.102 RCW, the ordinance/resolution creating the RDA may need to be repealed

94
Revitalization Area (RA) boundaries
See list of restrictions/limitations for boundaries of RAs Chapter 207, Laws of 2009)
The public improvements must be located in the RA boundaries
Note: DOR will NOT set up unique local sales/use tax location coding for taxpayers to report sales/use taxes
95
Partnering
Sponsoring: Local governments will apply to DOR

96
Partnering with local entities
• Notices must be provided (at least 30 days before the date when the ordinance/resolution creating the RA is expected to be adopted) to the taxing authorities and taxing districts that have boundaries within the proposed RA to allow the local entities to opt-out
• Both taxing authorities and taxing districts that have boundaries within the proposed RA must take formal action by passing an ordinance/resolution if the local entity does not want to participate in sharing the incremental tax revenue
Note: Timeframes for the formal opting-out process may be tight; sponsors may want to provide notice as early as possible

97
Partnering continued
• Participating taxing authorities (for sharing incremental local sales/use tax revenue)
–Interlocal agreements must be obtained from participating taxing authorities specifying the amount of sales/use tax to be shared and the start date
• Participating taxing districts (for sharing local property tax allocation revenue)
–Taxing districts may automatically become a participating taxing district and participate in sharing the local property tax allocation revenue if no action is taken to “opt-out”

98
When will my jurisdiction know if it has been approved for state funding?
• DOR has 60 days to approve or disapprove applications
• Applications that are not approved as a result of limited state funding will be kept in a queue for future state funding, if available
• Those first in line in the queue will have the first opportunity to update an application for any new funding that becomes available
• DOR will stop accepting applications after the full $2.5 million has been awarded on a first-come basis

99
If approved for a LRF award, what are some next steps?
• Proceed with public improvements and development or redevelopment project
• Work with county assessor and treasurer to implement the RA, measure and distribute the local property tax allocation revenues
• Estimate incremental state and local sales/use taxes (with assistance from DOR if needed)
• Issue general obligation bonds to finance public improvements in the RA
• File annual reports to DOR each year
• Use increases in certain local tax revenues from the RA and funds from other local public sources to pay for public improvements in the RA or principal and interest on the bonds
• Adopt an ordinance imposing the state-shared LRF tax on July 1st of the appropriate year
• Use revenue from LRF tax to pay principal and interest on the bonds
100
State-shared Local LRF Tax (State Contribution)

101
Mechanism for receiving thestate contribution
• Authority to impose a new local sales/use tax (“local LRF tax”) that is credited against the state sales and use tax (No increase in tax rate paid by consumers)
• Local ordinance/resolution must be adopted to establish the rate and effective date of the LRF tax. However, an appropriate maximum rate must be pre-selected when creating the RA and applying to DOR
• Annual reports will be submitted to DOR March 1st each year and a “threshold” for LRF tax distributions will be determined each year
• Distributions from the local LRF tax will continue throughout the state fiscal year until the “threshold” is met and then distributions will cease until July of the next state fiscal year

102
The Local “LRF” Tax
• Rate of tax can be no greater than 6.5% minus:
– Rates of all other local taxes credited against the state sales/use tax within the RDA (such as 0.09% Rural County tax, 0.033% PFD Regional Centers tax, Stadium taxes, Annexation Services tax, LIFT tax, 2% Lodging tax, etc.)
– A percentage amount of distributions (0.16%) required for performance audits under RCW 82.08.020(5) multiplied by the state sales tax rate of 6.5% (the result is 0.0104%)
– All rates of LIFT, HBZ, or LRF taxes that have been selected and reported to DOR for approved projects but not yet imposed
• The tax is imposed jurisdiction-wide (not just within RDA)
• Rate must be reasonable and allow the full state contribution for the year to be distributed within at least a 10 month period (based on taxable retail sales within the sponsoring jurisdiction)

103
When can the LRF Tax be imposed?
• Demonstration projects – July 1, 2010
–Bonds must be issued for the public improvements in the RA
• Projects awarded on a first-come basis – July 1, 2011
–Bonds must be issued
–The estimated state benefit in the preceding calendar year must be as much or greater than the award

104
How long will the LRF tax (state contribution) last?
The LRF tax will cease on the earlier of the dates when:
–The bonds are retired
–25 years from the time the tax is first imposed

105
A project’s state funding is linked to a local match requirement
The state contribution is the lesser of:
• The amount of project award granted by DOR (No more than $500,000 dollars or for Demo projects, the maximum amount specified in statute)
• The local match --The total amount of local sales/use tax incremental revenue, local property tax allocation revenues, and other revenues from local public sources, that are dedicated to paying for the RA public improvements (bonds or pay-as-you-go basis) in the previous calendar year (or carried over from prior years)

106
What can be included in my local match?
See definition of “Revenues from local public sources” in 2SSB 5045, section 102(19). Some funds that can be included as local match include:
–Local incremental tax revenues from LRF
–Local revenues derived from federal and private sources
Note: Revenues from local public sources dedicated in the preceding calendar year that are in excess of the project award may be carried forward and used in later years for the local match

107
What types of funds cannot be included in my local match?
• State grants
• State loans
• Any other state moneys, including state-shared local taxes

108
Measuring growth in tax revenues

109
Measuring growth in tax revenues
1. Local Property Tax Allocation Revenues
2. State Property Tax Increments
3. Local Sales & Use Tax Increments
4. State Sales & Use Tax Increments
Types of growth being measured

110
What property tax revenue is used to pay for public improvements in the RA?
• Only the local property tax allocation revenues are used to pay for public improvements
– Includes those from the sponsoring local government and any participating taxing district
• State property taxes are not used (only measured)
– Using state property taxes would be unconstitutional. They must be used for support of the common schools

111
Local property tax allocation revenue
• Local property tax allocation revenue is the amount of regular property taxes levied by the sponsoring local government and any participating taxing district primarily on 75% of any increase in assessed value of real property in the RA resulting from new construction or improvements to property initiated after the RA is approved by DOR districts on the “RA value”
•LRF is a method of allocating targeted tax revenues to fund local public improvements in the RA and does not make any change in the levy calculations or rate setting

112
Measuring sales & use tax increments
• The sponsoring local government estimates, for each calendar year, increases in sales/use tax revenue from the RA as a result of revitalization in the area
• DOR, upon request, must assist sponsoring local governments in estimating sales/use tax revenue in the proposed or adopted RA

113
What sales/use tax revenues are measured and used?
Measured and Allocated
• Local 0.5% Basic and 0.5% Optional sales/use taxes (RCW 82.14.030) dedicated by the sponsoring local government and any participating local government
Measured only
• State 6.5% sales/use tax (Chapters 82.08 and 82.12 RCW) minus any local taxes that are credited against the state sales (examples: 0.09% Rural County Tax, 2% Transient Lodging Tax, 0.033% PFD Regional Centers Tax, LIFT Tax, HBZ Tax, Annexation Services Tax, Stadium taxes, etc.)

114
Accountability and review of program
There is always the possibility of more legislation to change or expand the LRF program
Annual Reports will be key to determining whether the program is effective
Estimates for incremental tax revenues should be as accurate and realistic as possible

115
Information to include in the annual reports
Various information on incremental tax revenues
Local matching funds broken down by type or source
Anticipated date when bonds will be retired
Names of businesses located in the RA as a result of public improvements
Estimate of the cumulative number of permanent jobs created in the RA as a result of public improvements
Estimate of average wages and benefits received by all employees of businesses locating in the RA as a result of the public improvements
List of public improvements financed by bonds

116
DOR Contacts
General Program Questions:
• James Petit, DOR Tax Account Administration, [email protected], (360) 902-7037
Property Tax Questions:
• Leslie Mullin, DOR Property Tax Division, [email protected], (360) 570-5865
• Diann Locke, DOR Property Tax Division, [email protected], (360) 570-5885
Questions about estimating incremental tax revenues:
• Diana Tibbetts, DOR Research Division, [email protected], (360) 570-6085

117
Update on Local Government Partnership Subcommittees
• Information Sharing Rob Rice, Assistant Director, Taxpayer Services Division
• Local Government Website David Sorrell, Information Services Division Cindy Autuchovich, Taxpayer Services Division
118
Closing Comments