Embed Size (px)
Citation preview

1
LearningChapter 18 and Parts of Chapter 20
• AI systems are complex and may have many parameters.
• It is impractical and often impossible to encode all the knowledge a system needs.
• Different types of data may require very different parameters.
• Instead of trying to hard code all the knowledge, it makes sense to learn it.

2
Learning from Observations
• Supervised Learning – learn a function from a set of training examples which are preclassified feature vectors.
feature vector class(square, red) I(square, blue) I(circle, red) II(circle blue) II(triangle, red) I(triange, green) I(ellipse, blue) II(ellipse, red) II
Given a previously unseenfeature vector, what is therule that tells us if it is inclass I or class II?
(circle, green) ?(triangle, blue) ?

3
Learning from Observations
• Unsupervised Learning – No classes are given. The idea is to find patterns in the data. This generally involves clustering.
• Reinforcement Learning – learn from feedback after a decision is made.

4
Topics to Cover
• Inductive Learning
– decision trees– ensembles– Bayesian decision making– neural nets

5
Decision Trees
• Theory is well-understood.
• Often used in pattern recognition problems.
• Has the nice property that you can easily understand the decision rule it has learned.

6
Shall I play tennis today?

7

8

9

10
How do we choose the best attribute?
What should that attribute do for us?

11
Which attribute to select?
witten&eibe
12
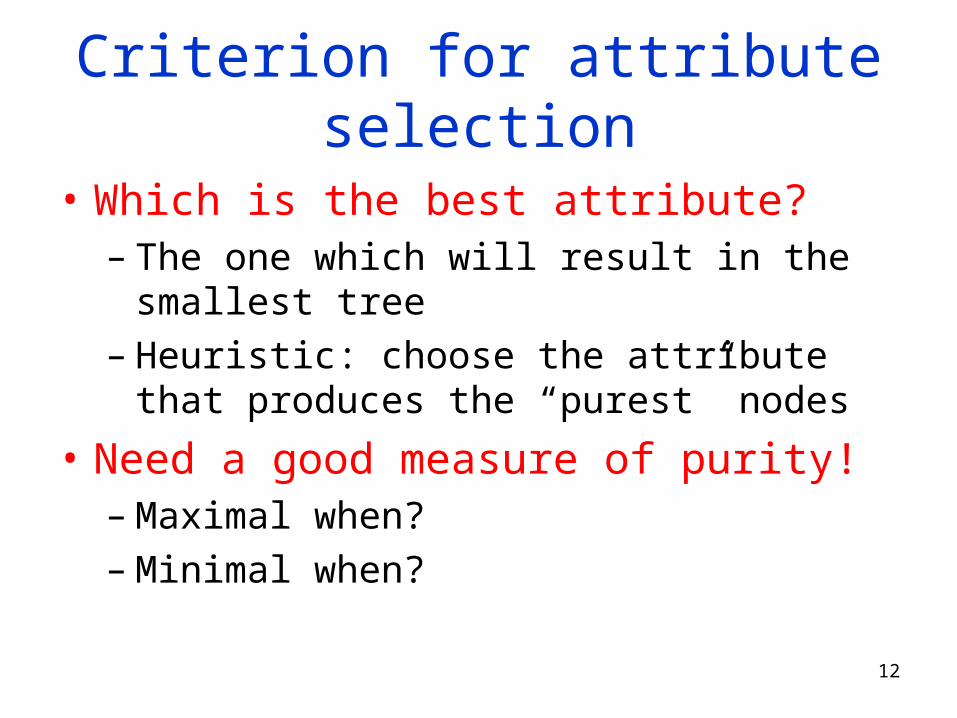
Criterion for attribute selection
• Which is the best attribute?– The one which will result in the smallest tree– Heuristic: choose the attribute that produces
the “purest” nodes
• Need a good measure of purity!– Maximal when?– Minimal when?

13
Information Gain
Which test is more informative?Split over whether
Balance exceeds 50K
Over 50KLess or equal 50K EmployedUnemployed
Split over whether applicant is employed

14
Information Gain
Impurity/Entropy (informal)– Measures the level of impurity in a group
of examples

15
Impurity
Very impure group Less impure Minimum impurity

16
Entropy: a common way to measure impurity
• Entropy =
pi is the probability of class i
Compute it as the proportion of class i in the set.
• Entropy comes from information theory. The higher the entropy the more the information content.
i
ii pp 2log
What does that mean for learning from examples?

17
2-Class Cases:
• What is the entropy of a group in which all examples belong to the same class?– entropy = - 1 log21 = 0
• What is the entropy of a group with 50% in either class?– entropy = -0.5 log20.5 – 0.5 log20.5 =1
Minimum impurity
Maximumimpurity
not a good training set for learning
good training set for learning

18
Information Gain
• We want to determine which attribute in a given set of training feature vectors is most useful for discriminating between the classes to be learned.
• Information gain tells us how important a given attribute of the feature vectors is.
• We will use it to decide the ordering of attributes in the nodes of a decision tree.

19
Calculating Information Gain
Entire population (30 instances)17 instances
13 instances
(Weighted) Average Entropy of Children = 615.0391.030
13787.0
30
17
Information Gain= 0.996 - 0.615 = 0.38
Information Gain = entropy(parent) – [average entropy(children)]
parententropy
childentropy
childentropy

20
Entropy-Based Automatic Decision Tree Construction
Node 1What feature
should be used?
What values?
Training Set S x1=(f11,f12,…f1m) x2=(f21,f22, f2m) . . xn=(fn1,f22, f2m)
Quinlan suggested information gain in his ID3 systemand later the gain ratio, both based on entropy.

21
Using Information Gain to Construct a Decision Tree
Attribute A
v1 vkv2
Full Training Set S
Set S
repeatrecursivelytill when?
Information gain has the disadvantage that it prefersattributes with large number of values that split thedata into small, pure subsets. Quinlan’s gain ratiodid some normalization to improve this.
S={sS | value(A)=v1}
Choose the attribute Awith highest informationgain for the full trainingset at the root of the tree.
Construct child nodesfor each value of A.Each has an associatedsubset of vectors inwhich A has a particularvalue.

22
Information ContentThe information content I(C;F) of the class variable Cwith possible values {c1, c2, … cm} with respect tothe feature variable F with possible values {f1, f2, … , fd}is defined by:
• P(C = ci) is the probability of class C having value ci.• P(F=fj) is the probability of feature F having value fj.• P(C=ci,F=fj) is the joint probability of class C = ci
and variable F = fj.
These are estimated from frequencies in the training data.

23
Simple Example
X Y Z C1 1 1 I1 1 0 I0 0 1 II1 0 0 II
How would you distinguish class I from class II?

24
Example (cont)
Which attribute is best? Which is worst? Does it make sense?
X Y Z C1 1 1 I1 1 0 I0 0 1 II1 0 0 II

25
Using Information Content
• Start with the root of the decision tree and the whole training set.
• Compute I(C,F) for each feature F.
• Choose the feature F with highest information content for the root node.
• Create branches for each value f of F.
• On each branch, create a new node with reduced training set and repeat recursively.

26

27

28

29

30

31

32
The tree is pruned back to the red line whereit gives more accurate results on the test data.
On training data it looks great.
But that’s not the case for the test data.

33

34

35

36

37
Decision Trees: Summary
• Representation=decision trees• Bias=preference for small decision trees• Search algorithm=• Heuristic function=information gain or information content or others• Overfitting and pruning• Advantage is simplicity and easy
conversion to rules.


![Large scale computational motif finding · ENCODE project: GENCODE consensus human gene set GENCODE [ENCODE] Transcription Tom Gingeras/ENCODE Structural Biology EU Biosapiens Nomenclature](https://img.dokumen.tips/doc/110x75/5faa836c4070c305dd409a12/large-scale-computational-motif-finding-encode-project-gencode-consensus-human.jpg)


![Impractical Introduction of Boost Spirit Qi [PPT]](https://img.dokumen.tips/doc/110x75/55953fd01a28ab366d8b45e9/impractical-introduction-of-boost-spirit-qi-ppt.jpg)