Embed Size (px)
Citation preview

1
Labor Market Information Systems and Data Analysis
Kathleen BeegleDevelopment Economics Research GroupAnd Living Standards Measurement Study (LSMS) groupWorld BankApril 7, 2009
2
Data for labor analysis: what can you do and how can you do it?
Focus on quantitative analysis Qualitative analysis is another method of
analysis which is not part of this discussion When under-taking new quantitative data
collection (and even when doing analysis of secondary analysis), you would probably always do some qualitative analysis.
Focus on data needs for analytical work

3
Labor data
Many sources of data for labor market analysis. How/if these data can be used will depend on several
factors: Who is eligible to be included?
census v. survey v. administrative records Who reports information?
Household head reporting for all individual members Firm manager reporting on individual staff
What information is reported? Unpaid family labor Women’s domestic work
How often is the data collected? Can it be merged/combined with other data?
LFS combined with rainfall data
4
Types of data
Population and Housing census In theory, all residents of the country with
limited information (age, sex, education, migration, “main activity”)
Every 10 years Often source for sampling frame for
household surveys Difficult to get unit-record data but means
are often readily available

5
Types of data
Household survey data Topical surveys
Household Budget Surveys (HBS), Income and Expenditure Surveys (IES)
Labor Force Surveys (LFS) ILO SIMPOC surveys (Statistical Information and
Monitoring Programme on Child Labour part of IPECL)
Demographic and Health Surveys Integrated Household Surveys (LSMS, FLS) include
income & non-income dimensions of living standards
www.worldbank.org\lsms www.rand.org\FLS
6
Types of data
Administrative data (records) From companies or from governments (local,
regional, national) Firm/enterprise surveys
rru.worldbank.org/EnterpriseSurveys/ Rural investment climate surveys
Non-labor data is also relevant…examples: Price data (to deflate nominal values) Infrastructure information (access to
markets)

7
Data producers
National statistical office policies of access to unit-record data vary
Multi-laterals: ILO, World Bank, IDB Not systematically public
Researchers Not systematically public
How to find data: not so easy! IHHSN
www.internationalsurveynetwork.org/home WB’s DDP (e.g. Africa Household Survey Data
bank)

8
A “simple” labor question may embed many demands on data
Single topic surveys may lack breadth of topics (eg: measure of poverty status)
LSMS surveys may lack depth (eg: willingness to co-pay for health insurance, pension contributions for civil servants)
Administrative data: little background information on respondents (eg: education level)

9
Unemployment & Poverty
05
1015202530354045
Segovia West Managua South Central North Atlantic
Poverty
Unemployment
Nicaragua, 1993

10
UNE and Poverty: what data would you need?
“ILO” definition of unemployment Did you work (for at least 1 hour) in the last 7 days
Does this include working as unpaid family labor on the hh farm?
Does this include the wife who worked 2 hours in the hh’s non-farm business?
If no, do you have a regular job (on leave/sick) to which you will return?
If no, have you searched for work in the past 4 weeks?
3+ questions, asked of all household members.
In low-income countries, you find few who qualify as unemployed

11
UNE and Poverty: what data would you need?
Poverty status of household (detailed consumption module)
Sufficient sample sizes in each region to generate reliable unemployment statistics

12
Employment and Poverty Indicators
Sample Means
Poor below food
poverty line
Between food poverty line and
poverty lineNonpoor Total
Household members who have worked during the past week (%)
39.4 43.6 46.6 44.8
Number of jobs per household member during the past week
0.5 0.6 0.7 0.6
Average monthly wage from primary occupation
65,948 99,706 103,438 98,401
Children under 15 who were employed during the past week (%)
5.8 5.8 4.5 5.0
Cambodia 1997
13
Employment and Poverty: What data would you need?
Poverty status of household Work status of individual household members,
including children under 15 (often missing) Information on working and number of jobs
wrt to some time period – last week, month year Wage data
imputed wages for self-employed? In-kind value of wage payments (housing, food) Difficult to annualize
CPI to convert price data from nominal to real values (spatial and temporal price data)
14
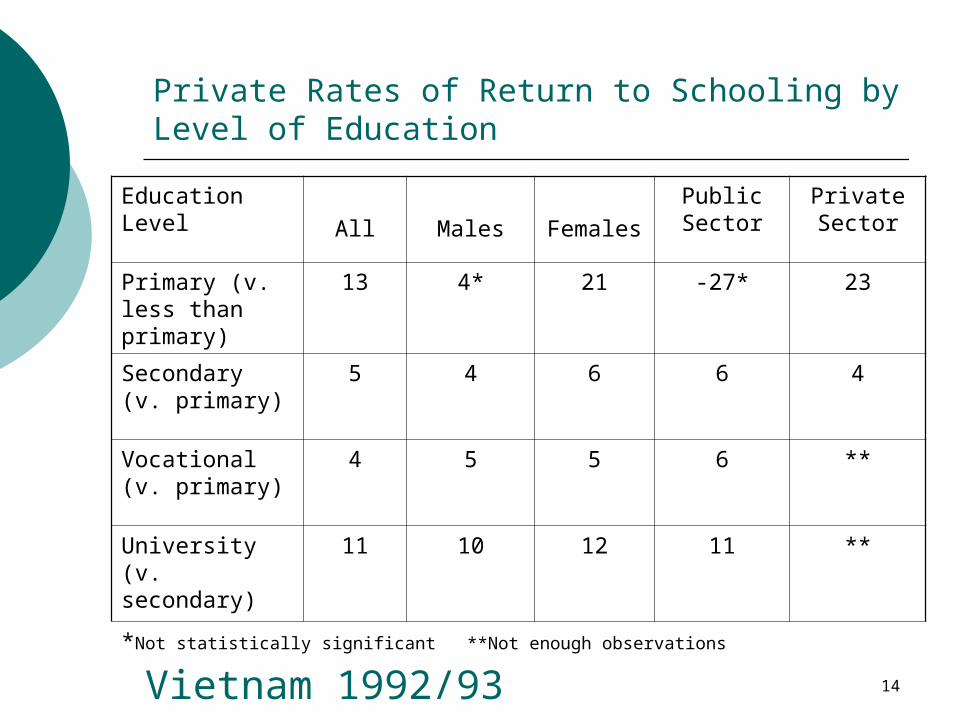
Private Rates of Return to Schooling by Level of Education
Education Level All Males Females
Public Sector
Private Sector
Primary (v. less than primary)
13 4* 21 -27* 23
Secondary (v. primary)
5 4 6 6 4
Vocational (v. primary)
4 5 5 6 **
University (v. secondary)
11 10 12 11 **
*Not statistically significant **Not enough observations
Vietnam 1992/93

15
RTE: What data would you need?
Sector of work (maybe including second or thirds jobs?)
Wages (real values) Education level
16
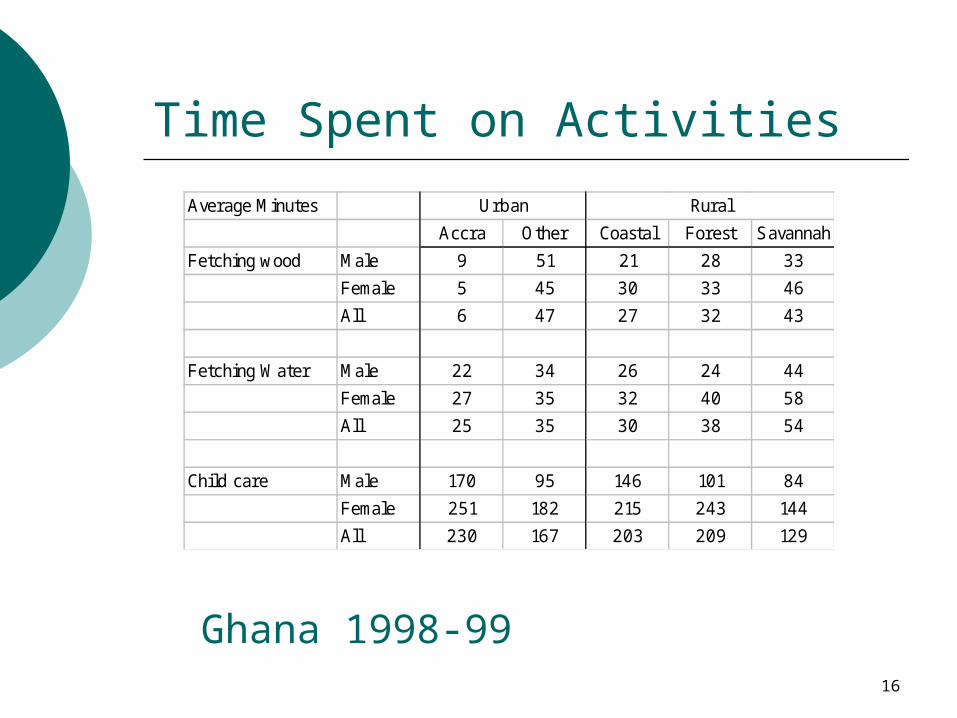
Time Spent on Activities
Average Minutes
Accra Other Coastal Forest Savannah
Fetching wood Male 9 51 21 28 33
Female 5 45 30 33 46
All 6 47 27 32 43
Fetching Water Male 22 34 26 24 44
Female 27 35 32 40 58
All 25 35 30 38 54
Child care Male 170 95 146 101 84
Female 251 182 215 243 144
All 230 167 203 209 129
Urban Rural
Ghana 1998-99

17
Time Use: What data would you need?
Reported time use across distinct sub-categories of activities asked of every individual member of the household Fetching water and collecting firewood:
does this include waiting time? does it include walking to the source
What if farming is combined with child-care?

18
What data would you need?
MDG 3: Share of women in wage employment in the nonagricultural sector
Impact of credit access on entry into self-employment
Ex-post impact of minimum wage legislation
Ex-ante impact of proposed changes changes to pension system

19
Data analysis of labor issues: Challenges
What if? Posing hypothetical situations to respondents (willingness to pay/contingent valuation) Reliability of complicated questions on
tradeoffs today with future returns Consistency in definitions across time
and space Relevance of international definitions
Unemployment in SSA v. ILO definition Impact: Identifying appropriate control
groups

20
Data analysis of labor issues: challenges
Seasonality Means are deceiving How to measure labor bottlenecks?
Rare events: Difficult to measure/assess rare events in large-scale LSMS-type surveys Impact of HIV/AIDS on absenteeism LM outcomes for disabled Children involved in dangerous work

21
Malawi Time Use 2004
Male 15+ Female 15+
Mean Median %<10
hrs Mean Median %<10
hrs
Mar-04 27.6 24 28.8 27.2 22.5 28.3 Apr-04 29.6 28 20.2 25.8 23.5 26.6
May-04 26.4 24 27.7 25.4 23.5 23.7 Jun-04 27.7 28 24.9 25.5 22 29.1 Jul-04 27.0 24 23.1 23.2 20 30.9
Aug-04 26.3 24 25.3 24.3 21 26.1 Sep-04 28.2 24 23.6 25.1 22 26.8 Oct-04 29.0 28 21.7 28.5 27 19.3 Nov-04 31.8 31 16.2 31.0 30 18.3 Dec-04 35.0 35 8.5 32.3 32 14.1 Jan-05 33.5 32 10.8 31.7 30.5 12.0 Feb-05 28.9 28 18.2 27.8 26 20.0 Mar-05 29.9 29 20.1 26.8 23.5 24.9
Source: Malawi IHS2. Note: Total time in last week: fetching water, collecting firewood, working on household farm, working in household non-farm business, and wage or salary work. Includes unpaid family labor in household income generating activities.

22
Conclusions
Lots of data, but (usually) no one source has it all
Search for your data: good literature review may reveal some ideal data
Be creative. combine data across sources (LSMS with administrative data)
Be realistic about what you can and can’t answer
Pay attention to the details of your data source
23
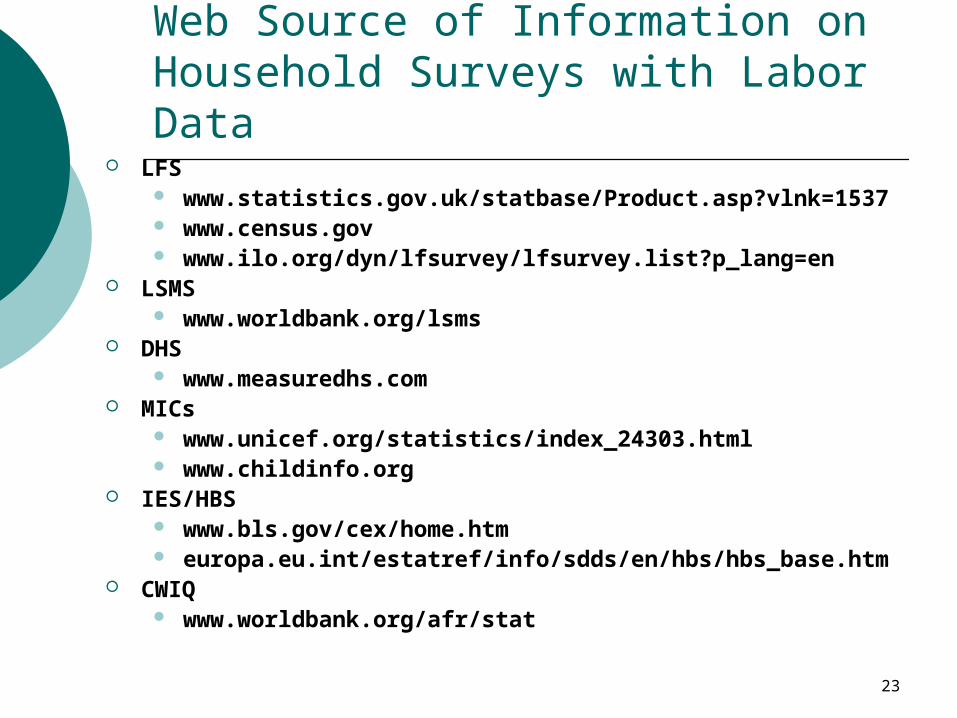
Web Source of Information on Household Surveys with Labor Data
LFS www.statistics.gov.uk/statbase/Product.asp?vlnk=1537 www.census.gov www.ilo.org/dyn/lfsurvey/lfsurvey.list?p_lang=en
LSMS www.worldbank.org/lsms
DHS www.measuredhs.com
MICs www.unicef.org/statistics/index_24303.html www.childinfo.org
IES/HBS www.bls.gov/cex/home.htm europa.eu.int/estatref/info/sdds/en/hbs/hbs_base.htm
CWIQ www.worldbank.org/afr/stat

24
http://www.ilo.org/dyn/lfsurvey/lfsurvey.list?p_lang=en