Embed Size (px)
Citation preview

1
Kevin Whorton Director of Retail Programs National Association of Chain Drug Stores, Inc. General Manager, NACDS Services Corporation
We Lose Money on Every Sale, But We Make It Up on Volume:
Growing Association Profits With Effective Pricing

2
Program Outline
I. Overview of Pricing Techniques/Tactics
II. Framework for Setting Optimal Price
III. Vignettes and Cautionary Tales
3
I: Overview of Pricing Techniques and Tactics

4
Pricing Objectives
Will drive strategies and techniques: Maximize profit/financial surplus Cost recovery Maximize market size Social equity

5
Pricing Strategies
Cost-oriented: based on markup/target return on investment
Market penetration: low introductory priceBuild acceptance, forestall competition
Market skimming: where market will bear No foreseeable competition
Competitive price: defensive, matching, or maintaining guaranteed low price
Prestige price: intentional high/establish value
6
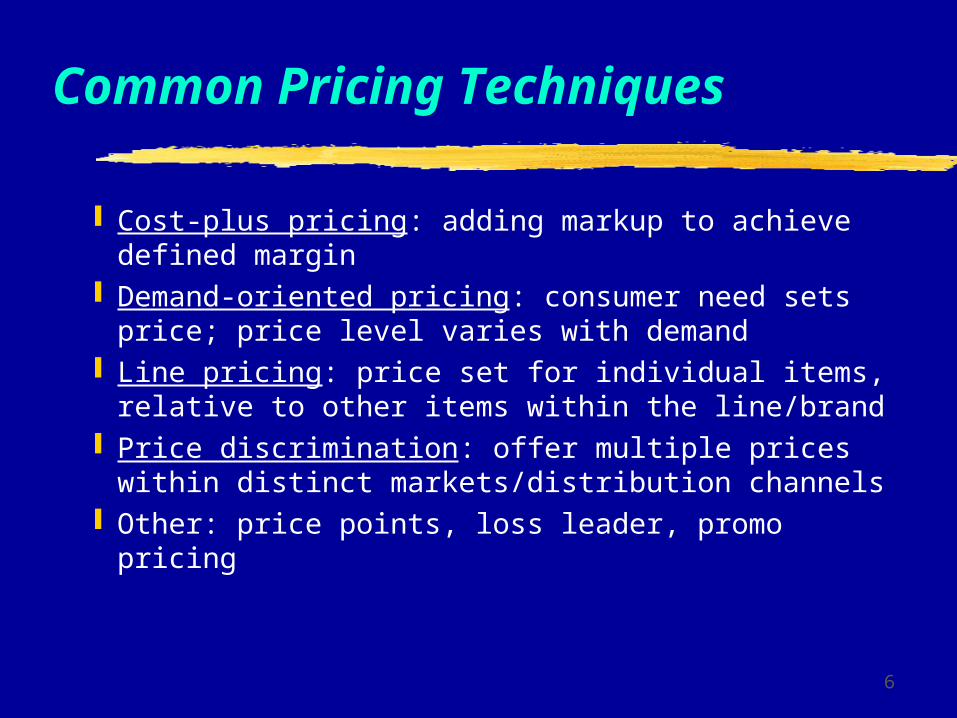
Common Pricing Techniques
Cost-plus pricing: adding markup to achieve defined margin
Demand-oriented pricing: consumer need sets price; price level varies with demand
Line pricing: price set for individual items, relative to other items within the line/brand
Price discrimination: offer multiple prices within distinct markets/distribution channels
Other: price points, loss leader, promo pricing

7
Price Setting
Existing servicesQualitative researchQuantitative methods--contingent valuation Tradeoff (conjoint) modelingOverall review of practices
New servicesPrice testingBundled/unbundled products

8
Pricing By Service Category
Services Under Development Marketing involvement during product
development process:Define ideal productDetermine its attributesForecast success of product with a variety
of price points/strategies (measure opportunity cost)

9
Which Problems Apply to You
Too much/too little price variety in product line Over-consistent pricing across categories with
different costs: associates, students, international Internal resistance to hikes: “not business decision” Not bundled well with discounts for other services Price level inconsistent with perceived value Constant dues level over time, despite changes in
services/components of membership

10
Potential Solutions
Varying solutions and potential returns Direct changes in base dues Bundling with products/premium membership New categories (e.g. inst./multiple memberships) Multiple-year and discounted memberships Changing price for categories with higher/lower
fulfillment costs (international, students) Each change needs systematic review/evaluation similar to new product development model

11
Communication
Make case for direct price changes…Marshal evidence of over/underpricingAddress underlying issues (e.g., cost allocations)Build internal/external understanding/acceptance
... or indirect price changes Increase benefits, member discounts, premium
giveaways, member-only services (if overpriced)Unbundle benefits, lower member discounts, create
premium level (if underpriced)Continue to pursue a long-term strategy to change
direct prices
12
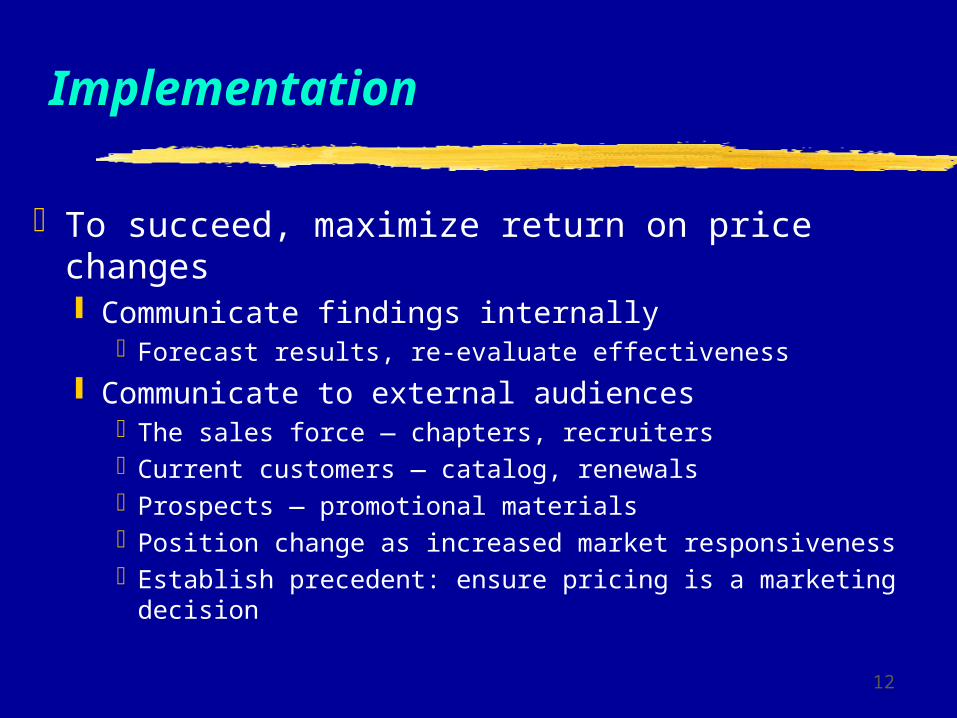
Implementation
To succeed, maximize return on price changes Communicate findings internally
Forecast results, re-evaluate effectiveness
Communicate to external audiencesThe sales force — chapters, recruitersCurrent customers — catalog, renewalsProspects — promotional materialsPosition change as increased market responsivenessEstablish precedent: ensure pricing is a marketing
decision

13
Applications: Membership
Typical scheme: Annual charge, no installments
Primary membership: often political/by-laws
Line pricing for other categoriesNo volume discountsStrategy for changes: budget-balancing
Technique is cost-basedFull, not incremental cost

14
Application: Member Dues
Identify pricing strategy/technique used Determine if strategy is sub-optimal
Retention (by category) vs. benchmarksExit surveys: frequency of value/cost as a reason Satisfaction ratings based on “value for price paid”Qualitative research, current membersCompetitive scan/market penetrationUse file analysis: total members by company, sitePositioning: “primary” or “secondary” affiliation

15
Application: Exhibit Fees
Far greater latitude: multiple attendeesSplit registrant fees from space rentalHistory rules: working within budgetsCompetitor intelligencePotential for value-added: pre-show lists,
travel costs, all factored into budgetsAnnual packages: ads + exhibitor feesWillingness to trade certainty for higher
price tag

16
Application: Sponsorships
Typical scheme: Full, not incremental costBased on perceived WTP or need for specific programOften linked to giving/donor relationsAltruistic motives vs. market access Pricing the sponsor “ask”
• Identify market’s value to potential sponsor• Extensive use of add-ons• Specific deadlines for offers/auction to drive prices build-in
exclusivity for high profile• Avoid frequent use of tiers

17
Application: Certifications
Cost-plus pricing: FC vs. VC: packaging and recordkeeping Externalities: ‘lift’ for all educationProduct line: spinoffs, distance learningPerceived value--new clients/higher incomeAdjustments if problem signs (attrition rates)Importance of lifetime value
Pricing for first and subsequent yearsPricing and penetration: elite/prestige (low) or
democratic/requisite credential (high)

18
II: A Framework for Setting the Optimal Price

19
"No margin, no mission."
Henri Manasse, Ph.D, Sc.D.ASHP Executive Vice President and Chief Executive Officer

20
Assumptions
You price to generate a profit.There is a direct relationship
between price and demand.Cost is only one element used to
establish the final price.Price is used as a basis for
determining a product’s value.
21
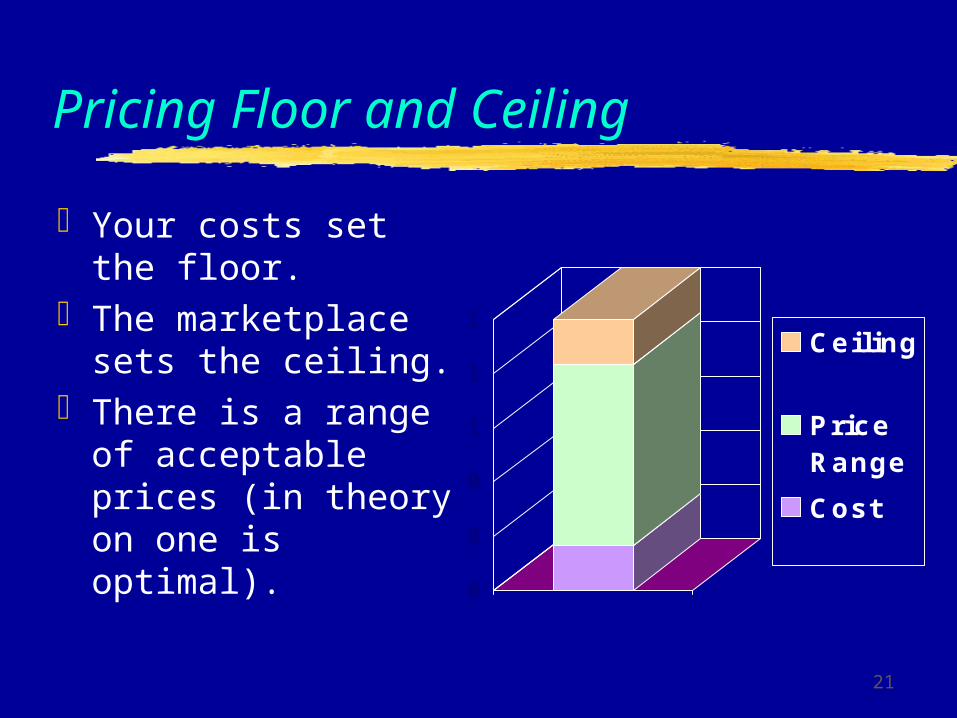
Pricing Floor and Ceiling
Your costs set the floor.
The marketplace sets the ceiling.
There is a range of acceptable prices (in theory on one is optimal).
0
0
0
1
1
1Ceiling
PriceRange
Cost

22
Components of Pricing Process
Pricing constraints and objectivesDemand, revenue, and elasticityCost, volume, and profit relationshipsPricing strategiesFactors in setting the specific priceSpecial adjustments

23
Pricing Objectives
Specify pricing goals that reflect your organization’s strategic goals
Profit Manage for long-run profits Maximize current profits (current
quarter, current year) Target return on investment

24
Pricing Objectives (cont.)
Sales Given adequate profit, increase in sales
revenue will lead to increases in market share and profit.
Market share (ratio of your sales to industry sales) Declining market Long-term strategy for entry into new
markets
25
Pricing Objectives (cont.)
Unit sales Good for products that increase in price
each year Can be deceptive with price cutting
(revenue can be down while unit sales are up

26
Constraints
Determine the demand Associations are niche oriented w/ a
defined marketplace. Look at both competitive association
products and competitive commercial products.
Is your product/service truly unique? Is there an expected price?

27
Constraints (cont.)
Anticipate the competitive reaction Who are your competitors? How crowded is the marketplace? What are your competitor's charging? How will you price position your
product?

28
Constraints (cont.)
Establish universe size market share Is the market large enough to generate
adequate sales? Is the universe stable? Is the universe growing or shrinking? At
what rate?

29
Constraints (cont.)
Determine the cost of producing and marketing the product or service Production costs Marketing costs Fulfillment costs Assigned overhead or other fixed costs

30
Other Pricing Constraints
Newness of product: stage in the product life cycle
Single product vs. product line Cost of changing prices and the time
period they apply The competitive marketplace (monopoly
vs. competitive) Competitor’s prices

31
Pricing Objectives (cont.)
SurvivalSocial responsibility
True for many associations Look at total product line for profitability
(gains offset losses)

32
Demand, Revenue, Elasticity
Demand Curve FactorsPrice Elasticity and Demand

33
Demand Curve Factors
Consumer tastes Price and availability of other
products (preference set)Consumer income

34
Typical Demand Curve
0
500
1,000
1,500
2,000
2,500
3,000
$0 $50 $100 $125 $150 $200 $250
Price
Qu
an
tity
35
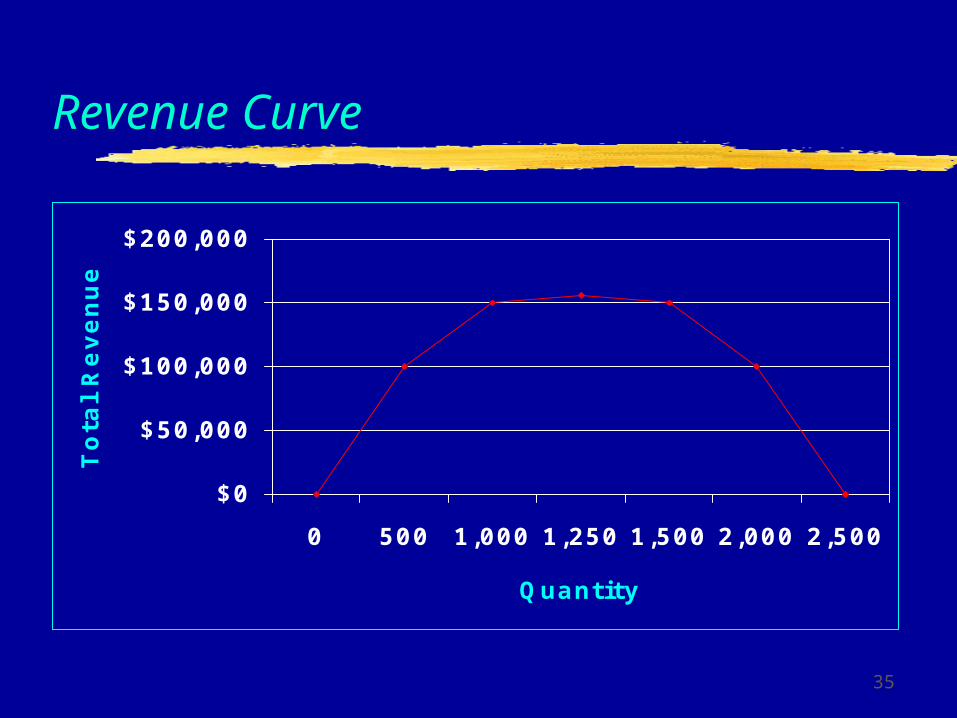
Revenue Curve
$0
$50,000
$100,000
$150,000
$200,000
0 500 1,000 1,250 1,500 2,000 2,500
Quantity
To
tal
Re
ve
nu
e
36
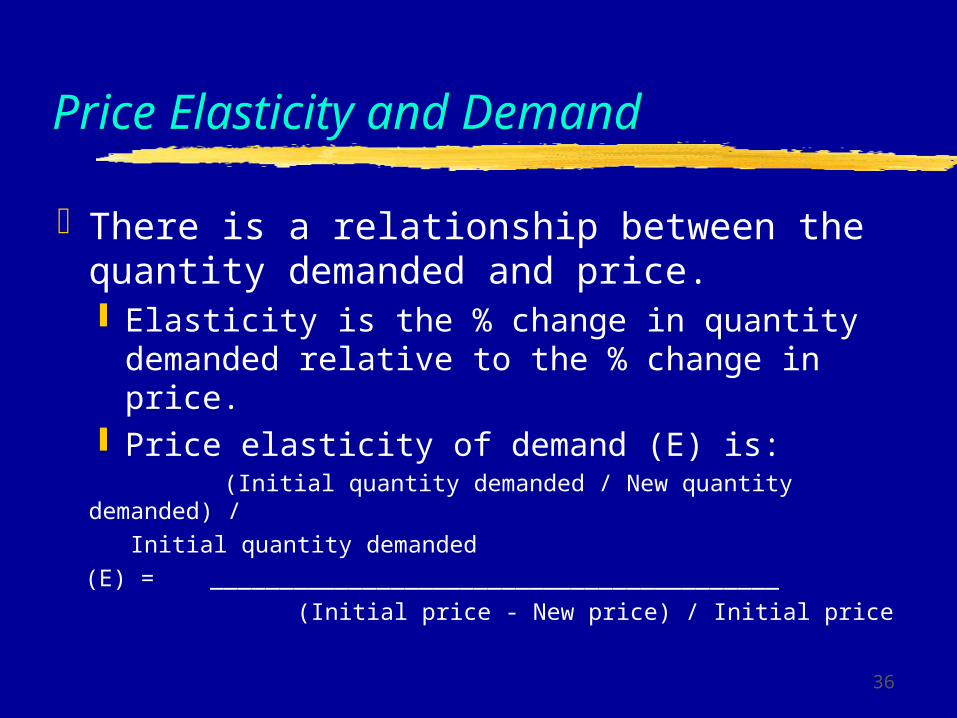
Price Elasticity and Demand
There is a relationship between the quantity demanded and price. Elasticity is the % change in quantity
demanded relative to the % change in price.
Price elasticity of demand (E) is: (Initial quantity demanded / New quantity demanded) /
Initial quantity demanded
(E) = _________________________________________
(Initial price - New price) / Initial price

37
What does this mean?
Demand is elastic when a small price increase produces a larger percentage decrease in quantity demanded. Price elasticity is > 1.
Demand is inelastic when a small price increase produces a smaller percentage decrease in quantity demanded. Price elasticity is < 1.
(The above also works in reverse.) Unit demand elasticity- when the percentage of
change in price produces an identical change in
quantity demanded.

38
Factors Affecting Elasticity
The greater the number of substitutes, the greater the elasticity.
Products and services considered to be necessities are price inelastic.
Items that require large cash outlays compared to disposable income are price elastic.
One way to measure elasticity is through year-to-year purchasing.

39
Cost, Volume, and Profit Relationships
Pricing TermsMarginal AnalysisBreak-even AnalysisEstimating Demand

40
Terms
Profit = Total revenue -Total cost Total cost (TC) = total production, marketing, and
sales expense. Fixed costs (FC) do not change with the quantity sold
(rent, salaries) Variable costs (VC) vary directly with the quantity sold
Variable cost expressed on a per unit basis it called unit variable cost.
Marginal cost (MC) is change in unit cost for producing and marketing one additional unit.

41
Marginal Analysis for Profit Maximization
To maximize profit sell and promote your products/services
as long as the revenue received from the sale of an additional product is greater than the cost to produce and market that product.
In theory, you want to operate up to the point where MR = MC

42
Break-even Analysis
Analyze the relationship between total revenue and total cost to determine profitability at various levels of output.
The break-even point (BEP) is the point where total revenue = total cost.

43
Calculating the Break-even Point
Fixed Cost_______ BEPq = Unit price - Unit variable cost
Answers the question: How many units do I need to sell to break even?

44
Practical Example of Break-even
$55,000___ BEPq = $35 - ($10 + $ 8) = 3235.3
Question: How may units can we realistically sell?
45
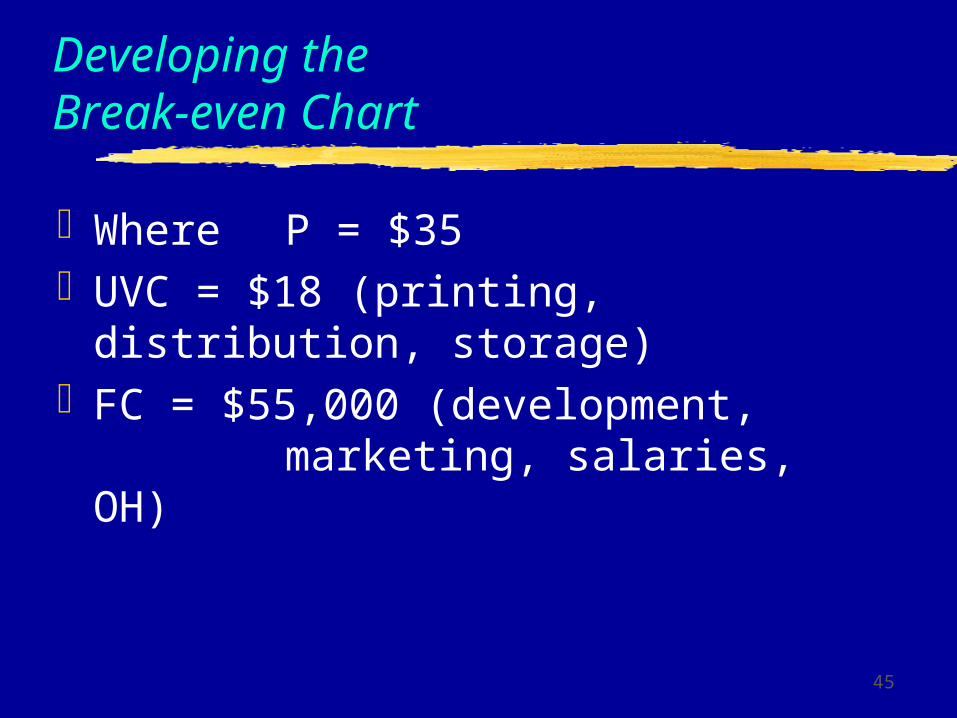
Developing the Break-even Chart
Where P = $35UVC = $18 (printing, distribution,
storage)FC = $55,000 (development,
marketing, salaries, OH)

46
Break-even Chart
Q TR TVC TC Profit ROI (P X Q) (UVC X Q) (FC X TVC)
1,000 $35,000 $18,000 $73,000 ($38,000) 2,000 $70,000 $36,000 $91,000 ($21,000) 3,000 $105,000 $54,000 $109,000 ($4,000) 4,000 $140,000 $72,000 $127,000 $13,000 10.2% 5,000 $175,000 $90,000 $145,000 $30,000 20.7% 6,000 $210,000 $108,000 $163,000 $47,000 28.8%

47
Break-even Graph
$0
$50
$100
$150
$200
$250
1000 2000 3000 4000 5000 6000
TR
TC
FC

48
Estimating Demand
Universe/market shareExample: Membership category
(N=250) 31,000 certified technicians 15,000 take exam in 1999 (12,000 pass) Approximately 1/3 are in the health-system
market niche Min. universe = .33 x 43,000 = 14,190 Mkt share estimate = 10% or 1,419

49
Estimating Demand (cont.)
Average Sales Method1,000 units x .3 = 3332,000 units x .4 = 8003,000 units x .2 = 6004,000 units x .1 = 400Total estimate = 2,133

50
Estimating Demand (cont.)
Previous sales/similar products Review sales of earlier editions What external factors are affecting
demand? Examine sales of similar products External research: sales of competitive
products Internal research: ask customers if they’d
buy

51
Summary
Establish a pricing policySet your parameters and goalsMake assumptionsUse the toolsDraw on your experience

52
III: Vignettes and Cautionary Tales

53
Sponsorship: Effect On Pricing the Subsidized Item
Grant in hand to subsidize program development “Net cost” of development is zero Developer wants to price low
What do you do?

54
Sponsorship’s Effect (2)
If net cost=0, should you give it away? Social objective of pricing strategies Publicize your role as good guys
OR…Price where the market will bear If you can make money, price based on
gross cost Product is a sponsorship magnet Yet pricing should reflect perceived value

55
“The Fait Accompli”
What do you do when the price is established and the “go/no go” is GO Illustrated: Spinoff of an established product Power resides with the product developer Your own analysis yields profit = 0 Probable outcome: profit < 0
What do you do?

56
“The Fait Accompli” (2)
De-emphasize the product May be self fulfilling prophecy
Free/low-cost marketing optionsWait until the next round
Work on fixing problem for the next edition
Price-test the release: forecast results Prepare for markdowns in promotion plan

57
New Product Release
Product rollout begins in six months Your charge: develop pre-pub and rollout
communications and pricing strategies Marketing has autonomy over discounts,
some control over rollout price
How do you determine pricing?

58
New Product Release (2)
Pre-pub allows some flexibility in price testing (validate your research)
Know your doubling day from product history: drive your forecast
Don’t pick at random, test price points Pre-pub to price-sensitive segments Consumer expectations/rollout price turnoff Commit to using the pre-pub learning to
adjust actual rollout price
59
Rapid Price Escalation
Underpriced good, with some uncertainty Decision-maker sees product far
underpriced Sound basis on market data Objective: raise to market price, turn cash
calf into a cash cow
What do you do?

60
Rapid Price Escalation (2)
One fell swoop Understand elasticity Avoid disrupting established buying patterns:
will people stay in the habit of buying? Budget-based decisions: don’t outrun
real willingness to pay Communicate: one adjustment year
Incremental multi-year: gradual, less pain

61
Product Line Extension
Successful product needs milking Decision: expand product line May be segmenting content for a niche May be compiling discrete products or
issues into a single volume
What do you consider in pricing?

62
Product Line Extension (2)
Considerations? How much do components or single
attributes contribute to value/how many are in product
Perceived value affected by media or content What is the niche-specific demand Are you being a cannibal? “Fit” with long-term pricing strategy Other approaches: bundling, repackaging

63
Desperation Marketing
Got a dog to unload May be low-pickup conference,
underperforming book or product “Fire sale,” on-site discounts are options Must sunset the product/no questions
asked No current pricing process in place
What do you do?

64
Desperation Marketing (2)
Time to ignore cost data How to exhaust inventory gracefully Avoid “aging” your catalog’s perception Avoid hurting image: product and other
lines Avoid future expectations of a white sale Giveaways: perform the social function People perceive value from pricing Understand why it tanked!!!

65
Membership = Bundle
Association membership is under review Each represents a bundle of goods Board wants to re-evaluate what members
get for their dues, and/or dues level Service mix and membership categories
last changed in the Truman Administration
What input do you provide?
66
Membership = Bundle (2)
Evaluate value of components in bundle Use a “time-neutral” perspective Ignore history and competition for now
Integrate with an overall financial model Loss leader, competition, or primary
revenue source Attribute all indirect member-caused
revenue:journal ads, exhibit revenue, sales