Embed Size (px)
Citation preview

Estimation of the pollution concentration in
the vicinity of a cellulose plant in an Alpine
valley using the non-hydrostatic mesoscale
model GRAMM
R.A. Almbauer, K. Pucher, PJ. Sturm
Institute for Internal Combustion Engines and Thermodynamics,
University of Technology, Graz, Austria
Abstract
In this paper the application of the non-hydrostatic mesoscale model GRAMMto a mountinous region in the Alps is described. The simulation is used for theestimation of the pollution dispersion of a cellulose plant during selectedweather conditions. The GRAMM model solves the conservation equations formass, momentum, potential temperature and humidity in a terrain-followinggrid. The time integration scheme is explizit depending on two time levels ac-cording to Adams-Bashforth. The discretisation of the model makes use of theGaussian and the first Green integral theorem without any co-ordinate trans-formation. The lateral boundary conditions are generalised radiation boundaryconditions. On the upper border the boundary conditions damp the vertical ve-locities and the integral mass flow is kept near zero. The soil temperature iscalculated considering the influence of radiation.The investigated region comprises an area of 13.5 x 13.5 km and the altidutesof the highest peaks are more than 1000 m above ground level. Meteorologicalconditions were measured at one point during several years. This data havebeen analysed with special attention to the meteorological conditions during thegrowth season of the coniferous trees. The concentration of pollutants duringthe morning hours of spring and summer are important for the rate of growth.The investigated pollutant was 80%, which will be emitted at a height of 90 mabove ground level. The simulations were carried out for three meteorologicalsituations and qualitatively checked. The calculated pollution concentrationswere compared to the theoretical values of a Gaussian plume model. TheGRAMM concentrations are lower than the maximum values of the results ofthe Gaussian plume model.
Transactions on Ecology and the Environment vol 6, © 1995 WIT Press, www.witpress.com, ISSN 1743-3541
76 Urban Pollution
1 Introduction
The pollution burden in forests caused by air pollutants leads to reduced growthand thus to economic losses. In hilly areas with steep slopes, the forest has animportant protective function in addition to its economic aspect. It preventslandslides, avalanches and the erosion of the soil. For this reason, the forest inAustria has been protected by a special forest regulation since 1975. The legallynecessary steps for setting up or changing an emitting plant involves the as-sessment of pollution burden caused by 862 and other pollutants relevant to theforest. This present examination was conducted for the existing cellulose plantin the Austrian city of Pols. This plant is to be considerably enlarged in the nearfuture. Due to the geographical location of this cellulose plant, which is situ-ated in a deeply cut Alpine valley, a Gauss model cannot be used. For this rea-son, the non-hydrostatic mesoscale model GRAMM was used in this case toassess the pollution dispersal. The relevant dispersal situations were chosen bya climatologist who has also checked the simulated flow fields.
2 Model description
The GRAMM model [1] solves the conservation equations for mass, momen-tum, potential temperature, humidity and all types of scalar quantities in a ter-rain-following grid. For the determinations, the conservation equations areformulated directly for the deformed volumes using a finite volume method.They are not determined with the help of the transformation of coordinates. Thederivations of values are determined in the grid with the help of integral equa-tions.The first and second derivations are mathematically exactly described and canbe used for making the conservation equations discrete. The calculated massfluxes on the surface of each volume are absolutely convergent, except forround-off errors of the computer.For an undistorted cartesian grid, the conservation equation for a scalar \j/ is
— = /^+O, (1)
In these equations, the term R^ denote the turbulent diffusion and Q^ denote asource/sink which is dependend on the transported quantity. The implicit non-hydrostatic part of pressure in the momentum equations is determined itera-tively using the TDM A (Tri-Diagonal-Matrix Algorithm). The perturbation ofdensity is only considered in the buoyancy term using the virtual potential tem-peratures with the Boussinesq approximation.The turbulent diffusion ist determined using the turbulent viscosity principle.This ist done by parameterizing the factor k with the help of a conservationequation for the turbulent kinetic energy and a mixing length equation. The soiltemperature is determined on the basis of a balance of all heat fluxes at the sur-face. The balance equation takes into account the sensible and latent turbulent
Transactions on Ecology and the Environment vol 6, © 1995 WIT Press, www.witpress.com, ISSN 1743-3541

Urban Pollution 77
heat fluxes from the atmosphere, the short- and longwave radiation and the heatflux in the soil. The Monin-Obukhov theory is used to determine the sensibleand latent heat fluxes. A one-dimensional radiation model is used for the de-termination of solar and terrestrial radiation. This model considers the effectsof shade, reflexion and counter radiation. The divergence of radiation flux inthe atmosphere is taken into account by considering emissions in dependenceupon the vertical distribution of steam and CC^ concentrations.Lateral boundary conditions for momentum, potential temperature and humid-ity are generalized radiation-boundary conditions. At the upper boundary, aboundary condition is used which enables gravity waves to leave the domain.Both boundary conditions are described in [2]. This keeps the integral massflux low at the upper boundary and lowers high vertical speeds.The temporal discretisation is determined explicitly using the Adams-Bashforthscheme with self-adapting time-steps. Advection terms are implemented usingthe upwind scheme.
3 Geographical Position
The city of Pols - and thus the cellulose plant - is situated in a side valley of thedeeply cut Mur valley in the Austrian part of the Alps. The Mur valley entersthe calculation domain at the western border and runs from west to east until itchanges its direction southwards. From the northwest, the Pols valley crossesthe whole calculation domain. Over a short distance, both valleys are parallel
until they come to-gether. The city of Polsis situated at a heightof 790 meters abovesea level. The sur-rounding mountainswithin the 13.5 x 13.5km simulation domain(fig. 1) reach heightsof more than 1600 m.The different heightsare marked by contourlines at distances of100 m. The inclinationof the slopes partlyexceeds 60%. Accord-ing to the Austrianforest regulation, thisforest is being re-garded as a so-called
Fig 1: Orography of the investigated area protective forest, which
means that it must not
Transactions on Ecology and the Environment vol 6, © 1995 WIT Press, www.witpress.com, ISSN 1743-3541

78 Urban Pollution
be exposed to any additional burdens. Except for the valley ground, the soil inthe whole calculation domain is being exploited by coniferous wood.
Out-valleywind
4 Meteorological Situations
The following assessment of forest-relevant flow situations was gained from anumber of measuring campaigns. Part of them were published by the AustrianFederal Institute for Health [3], while other measurements were described ininternal reports of the Institute of Geography, department for Climate Geogra-phy, of the University of Graz [3]. During situations with slow wind speeds, the
J
F
M
A
M
J
J
A
S
0
N
D
Out-valleywind
flow in an Alpine val-ley is marked by amountain and valleywind system which isrecurring on a dailybasis. The rise in tem-perature in the Alpsduring the day causes amountain wind which,depending on theseason, lasts over ashorter period of timein winter and a longerperiod of time in sum-mer. During the night,the mountains cool offmore rapidly and theflow reverses. In tig. 2,the distribution of thewinds flowing in and
out of the valley during one year (ordinate) is shown over those flowing duringone day (abscissa). Therefore, the area in the middle of the figure represents thetime period of the winds flowing into the valley, while both areas on the leftand on the right side represent the time periods of the winds flowing out of thevalley. The areas in between represent the transition periods. The maximumwind velocities in the valley cross section increase during the night from 1 to 2m/s before midnight to 2-3 m/s during the second half of the night and duringthe morning. The layering of the flow is stable during wind velocities slowerthan 2 m/s, and neutral during higher wind velocities. The wind flowing intothe valley is influenced by the heating caused by the sun. Depending on thecloudiness, the flow shows a neutral to unstable layering at velocities between2-3 m/s. The flow situations described are only true for the valley cross secti-on up to a height of approx. 500 m above the valley ground. The flow situationabove this height separates itself from the mountain-valley wind system.
0 3 6 9 12 15 18 21
Fig 2: Distribution of winddirections, Mur valley
24
Transactions on Ecology and the Environment vol 6, © 1995 WIT Press, www.witpress.com, ISSN 1743-3541

Urban Pollution 79
The pollutant 862 has negative influences on the growth of coniferous trees.SC>2 prevents the trees from closing their stomata and thus causes them to dryup. The critical time for this pollution effect during the daytime is in spring andin summer. The pollutant plume emitted from a chimney can either be transpor-ted into higher forest regions by anabatic slope winds or, during neutral orstable flow, meet on a wooded slope at the same height. The anabatic slopewinds, however, are not very strong, so that the pollutant plume will not beaffected by them in most cases. An exception to this situation is the neutrallylayered outbound flow of the Mur valley during the morning, which flows overthe Pols ridge and which is directed towards the slopes in the north by the up-coming slope drifts. In this case the pollutant plume transported with the windshits the wooded slopes at a high concentration. This dispersal situation wassimulated as case A. When the sun radiation is very strong, the height of themixing layer reaches the pollutant plume and reduces its concentration veryquickly. Since this situation is only of interest for the valley ground, it was notsimulated. When the sky is clouded, the flow remains neutral and transports thepollutant plume towards the Wetzel mountain which is situated in the west.This situation was simulated as case B. In addition to the two situations descri-bed above, the neutrally layered outbound flow was simulated as case C.
5 Results of the Simulation
The simulation of the three meteorological situations was carried out in a gridwith square cells of 300 x 300 m. The number of cells was 45 x 45 in a hori-zontal direction. In a vertical direction, the total height of 6000 m was separa-ted into 30 cells with different heights, starting from 20 m near the ground andreaching approx. 400 m at the upper edge. The simulations were carried out forquasi-stationary situations, because the flow in the Mur valley is caused by asystem of a much larger scale which therefore could only be considered dia-gnostically as a boundary condition. The three flow situations described abovewere carried out with constant-time boundary conditions. In a vertical direction,the inflow was only given up to a height of 600 m above ground. Above this,no wind velocity was assumed. A neutral temperature distribution was assumedfor the valley area (up to 600 m above ground), and a stable temperature distri-bution for the area above it, with a gradient of 3.5 K/km. In the following, theresults of the flow and dispersal calculation will be presented and described forthe lowest terrain-following calculation level. The pollutants are emittedthrough a chimney at a height of 90 m above ground. Due to the enormousamount of flue gas (540.000 Nm^/h at 70° C) and the low wind velocities, theeffective chimney height is more than 200 m. For this reason, the emissions of23.8 kg/h SC>2 were calculated at this height as belonging to one cell.
Transactions on Ecology and the Environment vol 6, © 1995 WIT Press, www.witpress.com, ISSN 1743-3541

80 Urban Pollution
Fig. 3: Flow field and SC^-concentration, Case A
Case A
The simulation for case A was calculated for a cloudless day in mid April as of8:00 LST. After a simu-lation period of threehours, the calculationshows an incomingflow from the westthrough the Mur valleyand from northwestthrough the Pols valleyat velocities of approx.2.5 m/s. The flow fromthe Mur valley is beingseparated into two partsby the Falken moun-tain. Those two partspass the mountain inthe south and in thenorth. The northern partflows over the Polsridge near the plant.Due to the increasingtemperature of the earth
surface, it changes directly into a slope updrift. Therefore, the pollutant plumeis transported to these slopes. The maximum concentrations near ground are
approx. 10.5 pg/m̂ . Theflows in the whole areaare meanwhile markedby slope updrifts. Sincethe slope updrifts re-move all the warm air,no major mixing layercan build up.
CaseB
The simulation for caseB was also carried outfor a day in mid Aprilduring cloudy weather.The simulation startedat 10:00 LST with aflow coming from theeast and lasted until13:00 LST. The situa-tion shows the inflowFig. 4: Flow field and SC^-concentration, Case B
Transactions on Ecology and the Environment vol 6, © 1995 WIT Press, www.witpress.com, ISSN 1743-3541

Urban Pollution 81
into the area from the east with low velocities. Due to the reduction of the flowcross section, the velocity of the flow increases at both sides of the Falkenmountain to up to 3 m/s. The pollutant plume is transported along with thisflow towards the Wetzel mountain, where it hits the wooded areas with a ma-ximum concentration of 4.7 ug/m*.
CaseC
The simulation for case C was calculated for the morning hours of a day inApril. Similar to case A, the flow enters the calculation domain from the westand northwest via the two valleys. Due to the fact that the valleys are smaller at
the north and the southof the Falken mountain,the flow velocities areincreased and reachspeeds of up to 2.5 m/s.The pollutant plume istransported by the flowtowards the southeast,where it hits an exposedmountain which reachesfar into the Pols valleyand which acts as a na-tural barrier. Thismountain reaches aheight of more than 200m above ground, which,therefore, correspondsto the height of thepollutant plume. Themaximum concentrati-ons are 3.7 ug/nv*.
The limiting value provided in the forest regulation is 70 ug/m^, which has notbeen reached in any of the three cases. The presented complex flow cases couldnot be compared with values gained from meteorological measurements. Themeasurements were performed over a number of years on the existing chimneyof the plant, and they were used for analysing the relevant flow situations. Thetime distribution of the winds flowing into and out of the valley was derivedfrom these measurements. The season distribution of the wind directionsshowed a share of 85% in flows parallel to the valley with a major share inwinds flowing out of the valley. The rest is made up of flows from thesouthwest to the south. These typical flows were considered in the three cases.
Comparison with the results from the Gauss Model
In order to check the results of the pollutant concentrations, the three casesdescribed above were compared to the Austrian version of the Gauss model [4].
Fig. 5: Flow field and SC^-concentration, Case C
Transactions on Ecology and the Environment vol 6, © 1995 WIT Press, www.witpress.com, ISSN 1743-3541
82 Urban Pollution
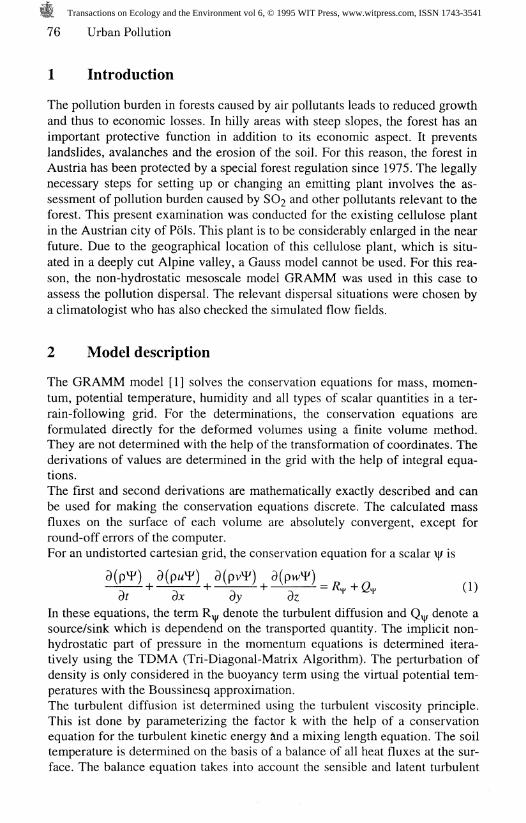
The results were calculated on the basis of the unrealistic assumption that thepollutant plume would penetrate the mountain. The resultant concentrationsmust in any case be higher than the results from the simulation. The compari-son shown in table 1 was carried out for the concentration on the ground and,for Gauss, also at the height of the plume.
Ground (distance)
Case A (1500m)
Case B (3500 m)
Case C (3500 m)
Gauss: ground
10.9 ug/m3
6.5 ug/m*
0.0 ug/m3
Gauss: height: 170m
ll.Ong/m*
8.1 ug/m*
73.1 ug/m'
GRAMM: ground
10.3 ug/nf
4.7 ug/m*
3.7 jag/m*
Table 1: Comparison of the maximum ground concentrations GRAMM - Gauss
Here it shows that the results of GRAMM are considerably lower than those ofGauss. The factor, however, is less than a power of ten. For checking the indi-vidual situations, tracer examinations with SF^ will be carried out in the future.
6 Conclusions
In order to assess the pollution burden in the vicinity of a cellulose plant, thenon-hydrostatic mesoscale model GRAMM was used. The calculation domainis situated in a deeply cut Alpine valley in Austria. Because of the orography, itis not possible to use a simple Gauss dispersal model. The three-dimensionalsimulation was carried out for three chosen quasi-stationary situations andleads to plausible meteorological results. Together with the meteorologicalquantities, the dispersal of the pollutant 862 was calculated. Finally, the gro-und concentrations were compared with the theoretical values of the AustrianGauss model. Due to the unrealistic assumptions, the comparison shows higherpollutant concentrations for the Gauss model.
7 References
1. Almbauer, R. A.: "Endbericht zum Forschungsauftrag: InternationalerVergleich mesoskaliger Schadstoff-ausbreitungsmodelle im Rahmen desEUROTRAC-Subprojektes EUMAC am Beispiel Athen" Report, Inst. f.VKM u. Thd, TU-Graz, Graz, Austria (in german), 1994
2. Flassak Th.: Ein nicht-hydrostatisches mesoskaliges Modell zur Beschrei-bung der Dynamik der pi Grenzschicht, VDI-Verlag, Duesseldorf, 1990
3. Lazar, R.,"Bericht Liber die immissionsklimatologischen Untersuchungen imRaum Pols, " Bericht, Institut f. Geographic, Univ. Graz, Austria, 1995
4. ONorm 9440,"6Wc>rra 9440: Dispersion of pollutants in the atmosphere -Calculation of ambient air concentrations and determination of stackheights," FachnormenausschuB 139 Luftreinhaltung, Osterreichisches Nor-mungsinstitut, Wien, Austria, 1992
Transactions on Ecology and the Environment vol 6, © 1995 WIT Press, www.witpress.com, ISSN 1743-3541


![Data boundary fitting using a generalised least-squares …web.ipac.caltech.edu/.../BoundaryFittingMethods09.pdfarXiv:0903.2068v1 [astro-ph.IM] 11 Mar 2009 Mon. Not. R. Astron. Soc](https://img.dokumen.tips/doc/110x75/60e85daf71e31e0cc9350058/data-boundary-itting-using-a-generalised-least-squares-webipac-arxiv09032068v1.jpg)


![Co ordinate geometry [toppersBlog.com]](https://img.dokumen.tips/doc/110x75/589c2eac1a28ab65248b68f9/co-ordinate-geometry-toppersblogcom.jpg)