Embed Size (px)
Citation preview

1
INTRODUCTION TO INTRODUCTION TO MANAGERIAL ACCOUNTING MANAGERIAL ACCOUNTING
Lecture 3 & 4Lecture 3 & 4

2
Learning AimsLearning Aims• To be able to analyze the distribution
format in the income statement.• To be able to understand the basics of
Cost Volume Profit Analysis.• To be able to prepare CVP elements:
Break-even Analysis, Target profit analysis and margin of safety.

3
Income StatementIncome Statement• Presents the results of operations for a period of time.
– Income – the sales revenue shows the income from goods/services sold in the year.
– Expenses – in order to make revenues we must incur expenses: an outflow of money to pay for an item or service e.g. wages, rents, electricity e.t.c
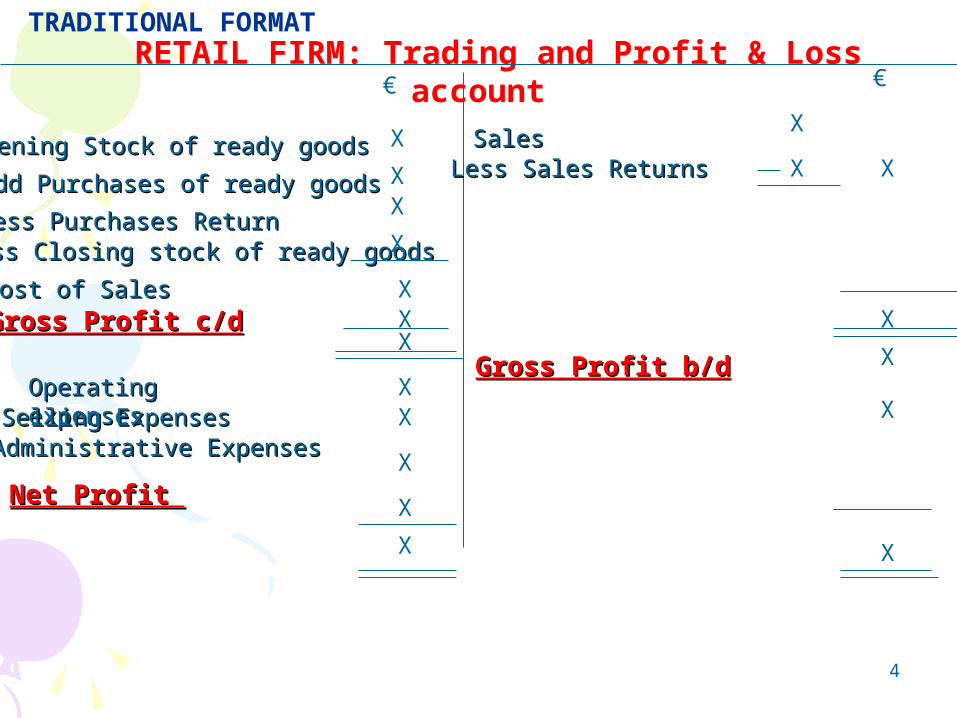
The income statement is split into two parts a) the Trading account which gives the gross profit and
b) the Profit & Loss account which gives us the Net Profit.
4
RETAIL FIRM: Trading and Profit & Loss account
Opening Stock of ready goodsOpening Stock of ready goods
Add Purchases Add Purchases of ready goodsof ready goods
Less Purchases ReturnLess Purchases ReturnLess Closing stock Less Closing stock of ready goodsof ready goods
€
X
XX
X
Gross Profit c/dGross Profit c/d
Operating expensesOperating expensesSelling ExpensesSelling ExpensesAdministrative ExpensesAdministrative Expenses
X
X
X
X
X
SalesSalesLess Sales ReturnsLess Sales Returns
X
€
X
X
X
Cost of SalesCost of Sales X
X
Gross Profit b/dGross Profit b/d
Net Profit Net Profit
X
X
X
X
TRADITIONAL FORMAT

5
MANUFACTURING COMPANY: Trading and Profit & Loss account
Opening Stock of finished goodsOpening Stock of finished goods
Add Purchases of ready goodsAdd Purchases of ready goods
Add: Cost of ProductionAdd: Cost of Production(Cost of goods manufactured)(Cost of goods manufactured)
Less Closing stock of finished goods Less Closing stock of finished goods
€
X
X
X
X
Gross Profit c/dGross Profit c/dX
X
X
X
X
SalesSalesLess Sales ReturnsLess Sales Returns
X
€
X
X
X
Cost of SalesCost of Sales X
X
Gross Profit b/dGross Profit b/d
Net Profit Net Profit
X
X
X
X
Operating expensesOperating expensesSelling ExpensesSelling ExpensesAdministrative ExpensesAdministrative Expenses
TRADITIONAL FORMAT
6
The Contribution Format of the Income The Contribution Format of the Income StatementStatement
• Is the format which distinguish the costs according to their behavior: variable or fixed.
• The reason we do this is to help internally the managers through the grouping of cost data into the format which will make easy the planning, controlling and decision making. This format is not available to people outside the business.
• A contribution margin income statement is an income statement in which all variable expenses are deducted from sales to arrive at a contribution margin, from which all fixed expenses are then deducted to arrive at the net profit or loss for the period.
• As sales increase, the contribution margin will increase in combination with sales, while fixed costs remain (approximately) the same.
7
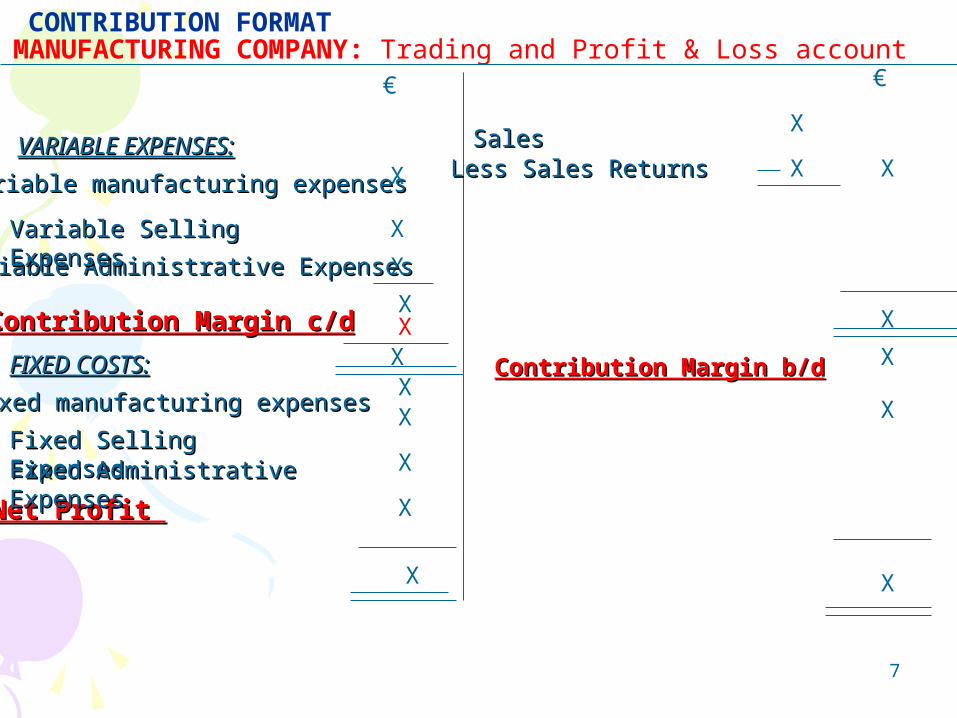
MANUFACTURING COMPANY: Trading and Profit & Loss account
VARIABLE EXPENSES:VARIABLE EXPENSES:
Variable manufacturing expensesVariable manufacturing expenses
€
X
X
X
Contribution Margin c/dContribution Margin c/dX
X
X
X
X
SalesSalesLess Sales ReturnsLess Sales Returns
X
€
X
X
X
Variable Administrative ExpensesVariable Administrative Expenses
X
Contribution Margin b/dContribution Margin b/d
Net Profit Net Profit
X
X
X
X
CONTRIBUTION FORMAT
Variable Selling ExpensesVariable Selling Expenses
X
FIXED COSTS:FIXED COSTS:
Fixed manufacturing expensesFixed manufacturing expenses
Fixed Selling ExpensesFixed Selling ExpensesFixed Fixed AdministrativeAdministrative ExpensesExpenses
8
• In a traditional Format the ‘cost of goods sold’ contains both variable and fixed expenses and when we apply a contribution format the ‘cost of goods sold’ is divided between variable production costs and fixed production costs.

9
COST-VOLUME-PROFIT ANALYSISCOST-VOLUME-PROFIT ANALYSISCVPCVP
• Cost – Volume – Profit (CVP) analysis is a powerful tool that helps managers understand the relationships among cost, volume and profit and then make decisions.
• CVP analysis focuses on how profits are affected by the following five factors:– Selling prices– Sales volume– Per Unit Variable Costs– Total Fixed Costs– Mix of Products sold

10
Some examples of decisions where Cost-Volume-Profit analysis can provide help are:• What price(s) should we charge for our products or
services ?• How many units of a product should we produce ?• Should we spend more on advertising ?• Should we add or delete a product line ?• Should we accept or decline a special order ?• What sales mix (different products) should we strive
for ?• What is the effect of a change to a different raw
material supplier ?• Should we increase or decrease our work force ?• How should we make our products ?
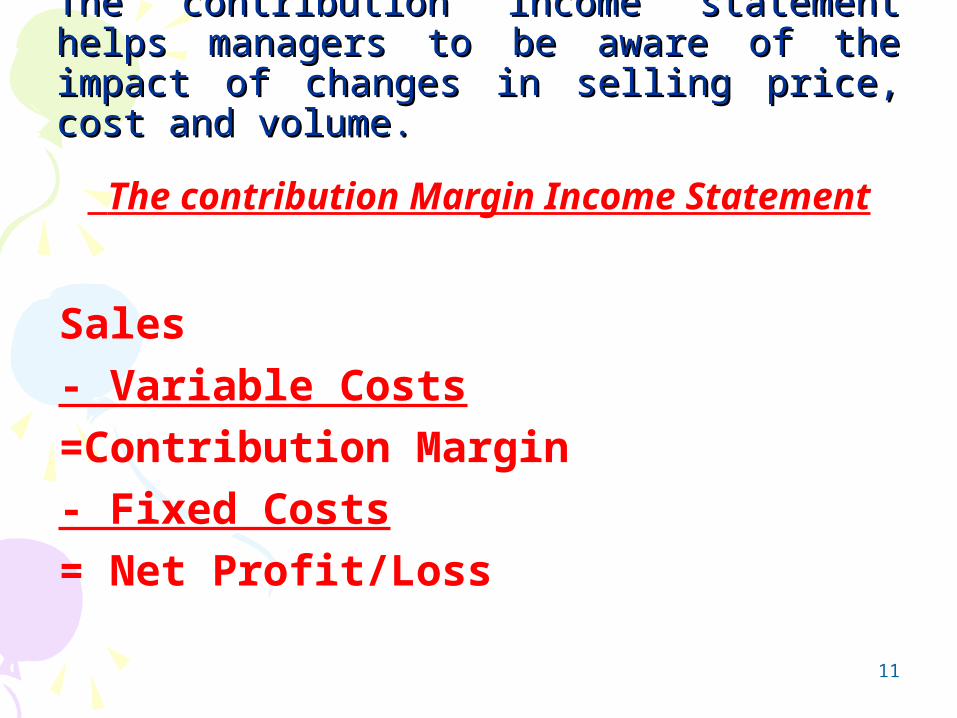
The contribution Margin Income Statement
Sales- Variable Costs=Contribution Margin- Fixed Costs= Net Profit/Loss
11
The contribution income statement helps The contribution income statement helps managers to be aware of the impact of managers to be aware of the impact of changes in selling price, cost and volume.changes in selling price, cost and volume.

The contribution Margin Income Statement: Income statement that groups cost by behavior – variable costs or fixed costs – and highlights the contribution margin.
Contribution Margin: it is called the contribution margin because the excess of sales revenue over variable costs contributes to covering fixed costs and then to providing net profit (operating income).
12

13
• Examples: The A company is selling one unit of its product for €250. It has variable expenses €150 per unit and total fixed expenses €35000.
1) If it sells only 1 product: Contribution Income Statement Total € Per Unit € Sales (1 unit) 250 250
Less: Variable exps (150) (150) Contribution Margin 100 100 Less: Fixed exps (35000) NET LOSS (34900)
For each additional product that the company can sell €100 contribution margin will become available to cover the fixed costs

14
2) How many units the business must sell in order to reach at break even point?
Break even point is the number of units sold at which the company has neither profit nor loss but it just covers all of its costs.
This point in our example is realized when we sell 350 units:
Contribution Income Statement Total € Per Unit € Sales (350*250) 87500 250 Less: Variable exps (52500) (150) (350*150) Contribution Margin 35000 100 Less: Fixed exps (35000) NET PROFIT / LOSS (0)

15
Once the break-even point has been reached the net income will increase for each additional unit sold. For e.g. if 352 units are sold (2 units above the break even point then the net profit will be €200 and so forth. An easy way to calculate the net profit is to multiply the contribution margin with the extra units, in this case is €100*2= €200

TWO RELATIONSHIPS IN THE CONTRIBUTION TWO RELATIONSHIPS IN THE CONTRIBUTION MARGIN INCOME STATEMENTMARGIN INCOME STATEMENT
CM RATIO
and
VARIABLE COSTS TO SALES RELATION
16
17
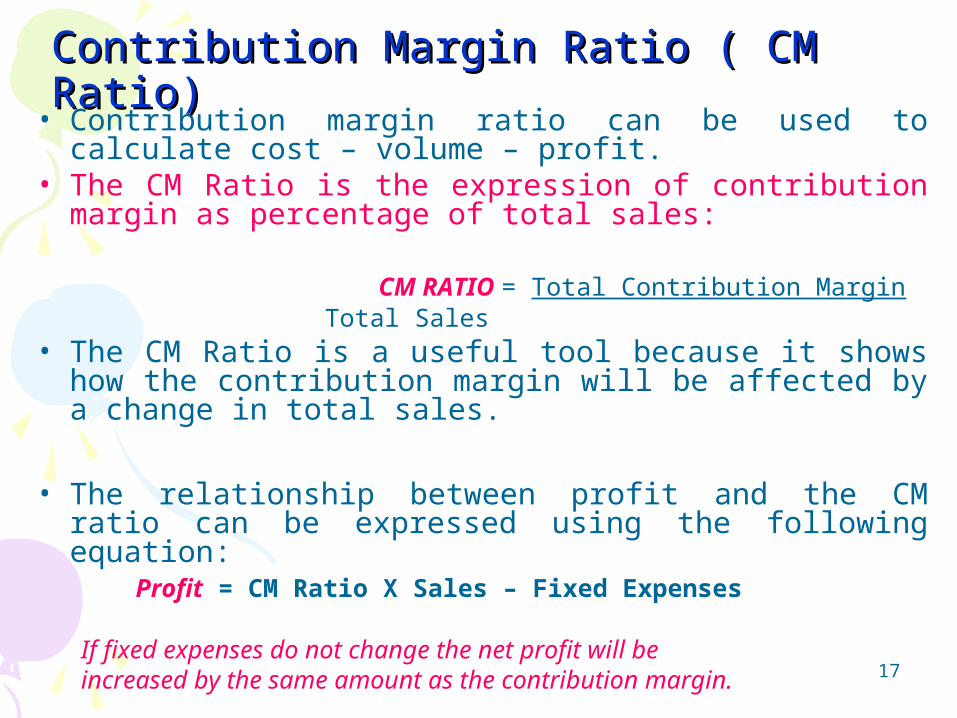
Contribution Margin Ratio ( CM Ratio)Contribution Margin Ratio ( CM Ratio)
• Contribution margin ratio can be used to calculate cost – volume – profit.
• The CM Ratio is the expression of contribution margin as percentage of total sales:
CM RATIO = Total Contribution Margin Total Sales
• The CM Ratio is a useful tool because it shows how the contribution margin will be affected by a change in total sales.
• The relationship between profit and the CM ratio can be expressed using the following equation: Profit = CM Ratio X Sales – Fixed Expenses
If fixed expenses do not change the net profit will be increased by the same amount as the contribution margin.

VARIABLE COSTS TO SALES RELATION = VARIABLE COSTS
SALES
18

19
• The Cost Volume Profit Analysis can help find out the most profitable combination of fixed costs, variable costs, selling price and sales volume.
• The examples following shows how.
Some Applications of CVP AnalysisSome Applications of CVP Analysis
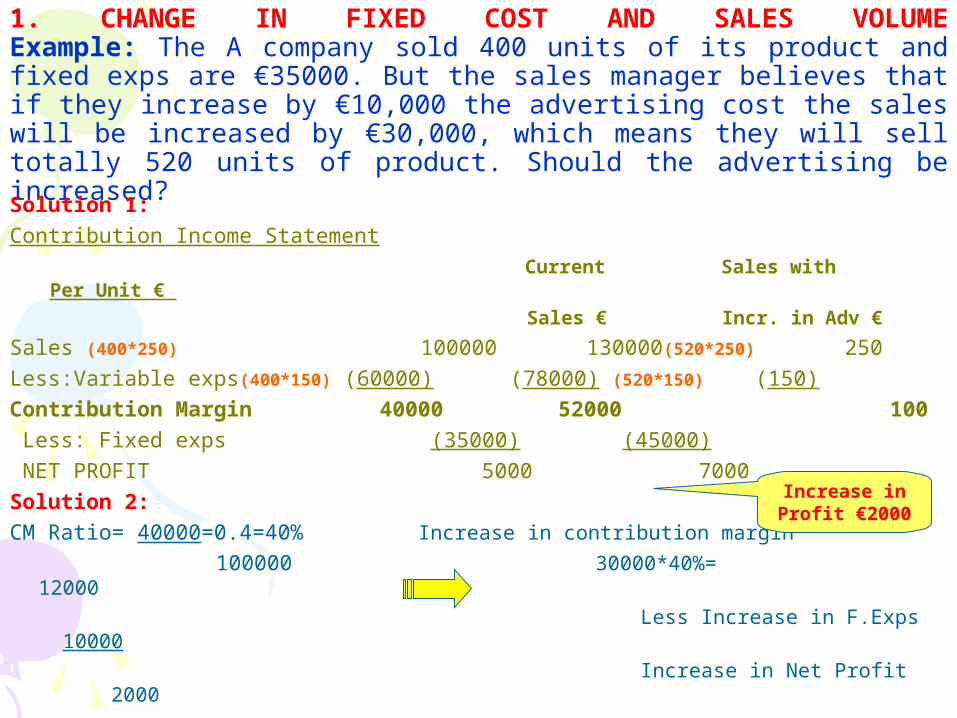
1. CHANGE IN FIXED COST AND SALES VOLUMEExample: The A company sold 400 units of its product and fixed exps are €35000. But the sales manager believes that if they increase by €10,000 the advertising cost the sales will be increased by €30,000, which means they will sell totally 520 units of product. Should the advertising be increased?
Solution 1:Contribution Income Statement Current Sales with Per Unit €
Sales € Incr. in Adv €
Sales (400*250) 100000 130000(520*250) 250Less:Variable exps(400*150) (60000) (78000) (520*150) (150)Contribution Margin 40000 52000 100 Less: Fixed exps (35000) (45000) NET PROFIT 5000 7000Solution 2:CM Ratio= 40000=0.4=40% Increase in contribution margin
100000 30000*40%= 12000
Less Increase in F.Exps 10000 Increase in Net Profit 2000
Increase in Profit €2000
21
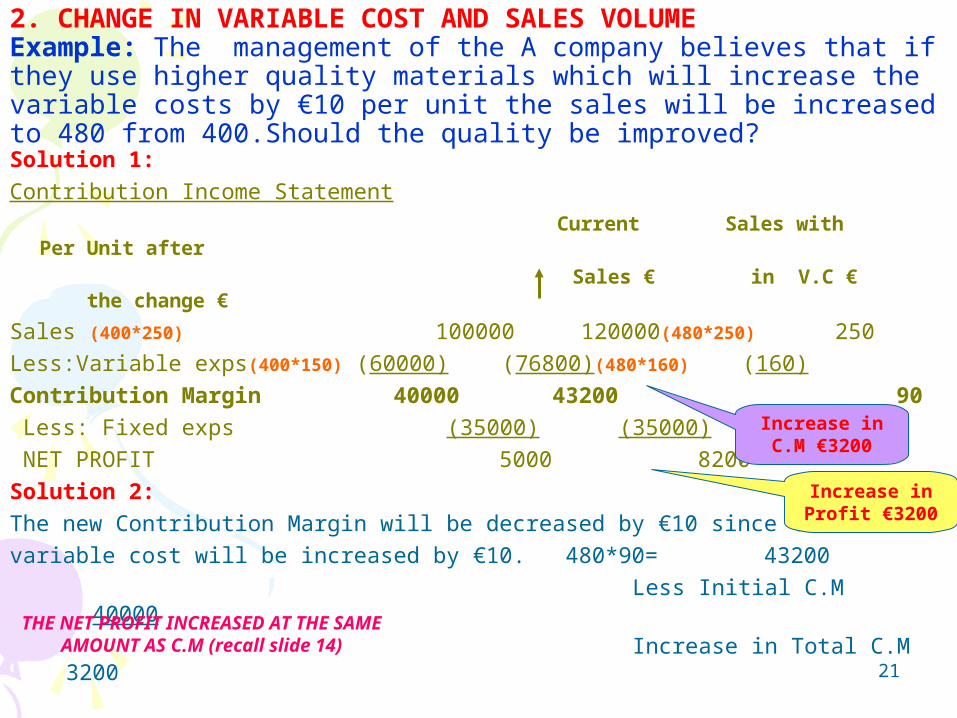
2. CHANGE IN VARIABLE COST AND SALES VOLUMEExample: The management of the A company believes that if they use higher quality materials which will increase the variable costs by €10 per unit the sales will be increased to 480 from 400.Should the quality be improved? Solution 1:Contribution Income Statement Current Sales with Per Unit after
Sales € in V.C € the change
€
Sales (400*250) 100000 120000(480*250) 250Less:Variable exps(400*150) (60000) (76800)(480*160) (160)Contribution Margin 40000 43200 90 Less: Fixed exps (35000) (35000) NET PROFIT 5000 8200Solution 2:The new Contribution Margin will be decreased by €10 since the variable cost will be increased by €10. 480*90= 43200 Less Initial C.M 40000 Increase in Total C.M 3200
Increase in Profit €3200
Increase in C.M €3200
THE NET PROFIT INCREASED AT THE SAME AMOUNT AS C.M (recall slide
14)

22
3. CHANGE IN FIXED COST,SALES PRICE AND SALES VOLUMEExample: The sales manager of the A company believes that if they cut down the sales price by €20 and increase advertising by €15000 the sales will be increased to 600 from 400.Should they realize those thoughts? NOSolution 1:Contribution Income Statement Current Sales with Per Unit after
Sales € in Price € the change
€ Sales (400*250) 100000 138000(600*230) 230Less:Variable exps(400*150) (60000) (90000)(600*150) (150)Contribution Margin 40000 48000 80 Less: Fixed exps (35000) (50000) NET PROFIT/LOSS 5000 (2000)Solution 2:The new Contribution Margin will be decreased by €20 since the Sale price will be reduce by €20. 600*80= 48000 Less previous C.M (40000) Increase in C.M 8000 Less increase in Fixed Costs (15000) Decrease in profit (7000)
Reduce in Profit by (€7000)
23
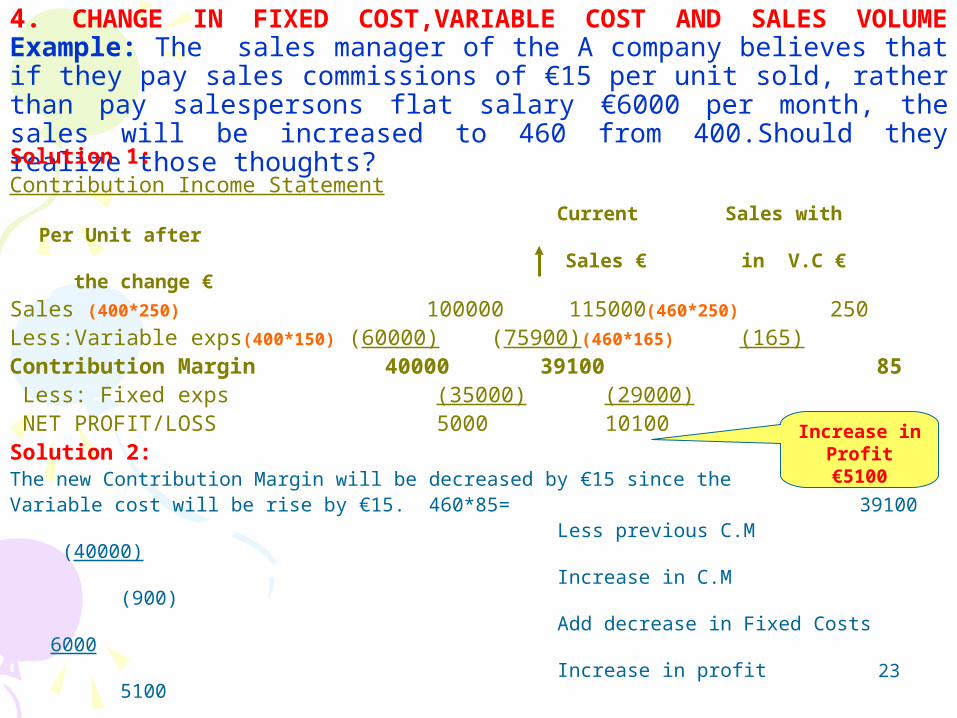
4. CHANGE IN FIXED COST,VARIABLE COST AND SALES VOLUMEExample: The sales manager of the A company believes that if they pay sales commissions of €15 per unit sold, rather than pay salespersons flat salary €6000 per month, the sales will be increased to 460 from 400.Should they realize those thoughts? Solution 1:Contribution Income Statement Current Sales with Per Unit after
Sales € in V.C € the change
€ Sales (400*250) 100000 115000(460*250) 250Less:Variable exps(400*150) (60000) (75900)(460*165) (165)Contribution Margin 40000 39100 85 Less: Fixed exps (35000) (29000) NET PROFIT/LOSS 5000 10100Solution 2:The new Contribution Margin will be decreased by €15 since the Variable cost will be rise by €15. 460*85= 39100 Less previous C.M (40000) Increase in C.M (900) Add decrease in Fixed Costs 6000 Increase in profit 5100
Increase in Profit €5100

24
Important Elements of CVP Analysis
• Break-Even elementIs the level of sales at which the company profit is zero. Is important to know this level so as to Estimate how far the sales could drop before the company begins to loose money.
Two methods to compute Break-even-point:A) The equation method andB) The contribution margin method

25
A) The equation method: Profit= Sales – variable costs – fixed costs
therefore Sales= Profits + variable costs +fixed costs
Example: The A company is selling one unit of its product for €250. it has variable expenses €150 per unit and total fixed expenses €35000. What is the level of sales at which it has break even?
Q*250=Q*150+35000+0 =>Q*250-Q*150=35000 =>100Q=35000 =>Q=350 total units So the break even in total euro sales is 350*250= €87500

26
B) The contribution margin method:Is based on the idea show at the beginning where:each unit sold gives a certain amount of contribution margin that goes toward covering fixed costs. Break-even-point = Fixed Expenses Contribution margin per unitExample 1 slide 11: BEP=35000=350 units 100If we wish to find the BEP in total euro sales, which is useful for companies that have multiple product lines and they want to compute a single break even point for the company as a whole, we use the followingCalculation: Break-even-point = Fixed Expenses CM Ratio

27
• Target profit analysisThe CVP formulas are used to estimate the volume of sales needed to achieve a target profit. We use the equation method of break-even to calculate this.Example: If our target is to reach the € 40000 and all other data are the same as example 1 how many units we must sell in order to gain € 40000 profits?Profit= Sales – variable costs – fixed costs =>40000=Q*250-Q*150-35000 =>40000=100*Q-35000=>Q=75000 =750 units must be sold 100

28
•The Margin of Safety Is the excess of budgeted (or actual) sales euro over the
break – even volume of sales euro. It is the amount by which sales can drop before
losses are incurred. The higher the margin of safety, the lower the risk of
not breaking even and incurring a loss.
The formula for the margin of safety is:Margin of Safety in euro =
Total Budgeted (or actual) sales – Break even sales
29
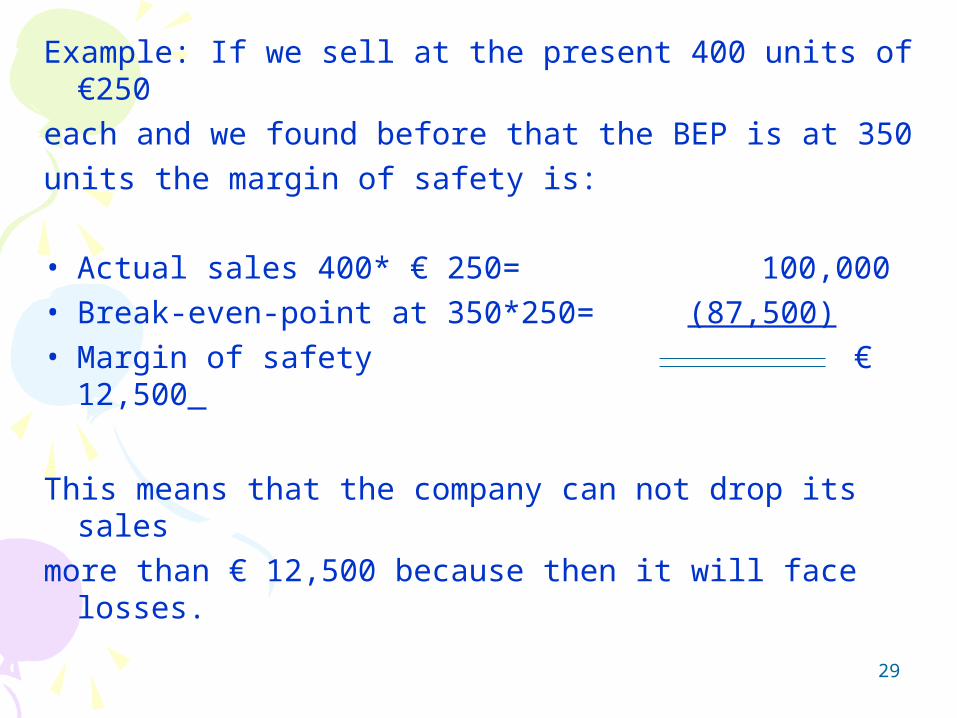
Example: If we sell at the present 400 units of €250 each and we found before that the BEP is at 350 units the margin of safety is:
• Actual sales 400* € 250= 100,000• Break-even-point at 350*250= (87,500)• Margin of safety € 12,500
This means that the company can not drop its sales more than € 12,500 because then it will face losses.