Embed Size (px)
Citation preview
Austin, J.A., Jr., Christie-Blick, N., Malone, M.J., et al., 1998Proceedings of the Ocean Drilling Program, Initial Reports, Vol. 174A
1. INTRODUCTION: OLIGOCENE TO PLEISTOCENE EUSTATIC CHANGE AT THE NEW JERSEY CONTINENTAL MARGIN—A TEST OF SEQUENCE STRATIGRAPHY 1
Nicholas Christie-Blick,2 James A. Austin, Jr.,3 and Shipboard Scientific Party4
bse
tho
-nsti-)ngiesicalongeseroad ofed toe isfortes ofgces-plein-es-neti-ot-) theene,ich87,s etl.,
is eu-tion-es insys-tion,ro-theandveing toonic hy-ic re- re-
y of, theac- lo- to
991;3); forcy-
1Austin, J.A., Jr., Christie-Blick, N., Malone, M.J., et al., 1998. Proc. ODP, Init.Repts., 174A: College Station, TX (Ocean Drilling Program).
2Department of Earth and Environmental Sciences and Lamont-DohertyEarth Observatory of Columbia University, Palisades, NY 10964, [email protected]
3University of Texas Institute for Geophysics, 4412 Spicewood Springs Road,Building 600, Austin, TX 78759, U.S.A.
4Shipboard Scientific Party is given in the list preceding the Table of Contents.
INTRODUCTION
The emergence of seismic/sequence stratigraphy since the late1970s has led to a revolution in stratigraphy and a renewal of interestin the stratigraphic response to eustasy (global sea-level change; Vailet al., 1977, 1984, 1991; Vail and Hardenbol, 1979; Loutit and Ken-nett, 1981; Berg and Woolverton, 1985; Haq et al., 1987, 1988; Vail,1987, 1992; Cross and Lessenger, 1988; Posamentier et al., 1988;Sloss, 1988; Eberli and Ginsburg, 1989; Fulthorpe and Carter, 1989;Christie-Blick et al., 1990; Van Wagoner et al., 1990; Haq, 1991;Mitchum and Van Wagoner, 1991; Loucks and Sarg, 1993; Posamen-tier and James, 1993; Weimer and Posamentier, 1993; Christie-Blickand Driscoll, 1995; Van Wagoner, 1995; Howell and Aitken, 1996;Fulthorpe and Austin, 1998; Miller et al., in press). Two argumentswere advanced in support of the eustatic interpretation. One involvedwidespread seismic evidence for the existence of regional unconfor-mities (sequence boundaries) characterized by apparently abrupt bas-inward shifts in onlap, which were interpreted to imply relativelyrapid falls of sea level with amplitudes of up to several hundredmeters. The second was based on the purported global synchroneityof these unconformities, which, if correct, would be difficult to ex-plain by other than a eustatic mechanism.
These arguments were not universally accepted for several rea-sons (Watts, 1982; Thorne and Watts, 1984; Miall, 1986, 1991, 1992,1994; Burton et al., 1987; Hubbard, 1988; Christie-Blick et al., 1990;Reynolds et al., 1991; Christie-Blick, 1991; Underhill, 1991;Christie-Blick and Driscoll, 1995).
1. Basinward shifts in onlap were shown not to require sea-levelchanges that were either rapid or of large amplitude; so therewas no reason to assume a eustatic causal mechanism or to ex-clude possible local tectonic mechanisms for sequence-bound-ary development.
2. No mechanism was known that could produce rapid eustaticchange during intervals such as the Mesozoic, for which thereis little or no evidence for continental glaciation.
3. Limitations in the resolution with which sequence boundariescould be dated and correlated between basins cast doubt on thelevel to which global synchroneity had been established.
4. At least prior to 1987, the “sea-level curve” first publishedVail et al. (1977) was based primarily on proprietary data (Haq et al., 1987). Thus, at the time of the Second Conferon Scientific Ocean Drilling (COSOD II, 1987), there wasgreat deal of interest in acquiring public domain data could be used to establish a sea-level record independent Vail et al. (1977) synthesis.
yeenceaatf the
Following COSOD II, the role of scientific ocean drilling in sealevel studies was advanced by means of a Joint Oceanographic Itutions, Inc. (JOI)/U.S. Scientific Advisory Committee (USSACWorkshop (Watkins and Mountain, 1990) and a JOIDES workigroup (Sea Level Working Group Report, 1992). Sea-level studwere also prioritized in the JOIDES Sedimentary and GeochemProcesses Panel (SGPP) White Paper (1994), the JOIDES LRange Plan (1996), and the Margins Initiative (Sawyer, 1996). Threports differ in detail and emphasis, but they endorse several bobjectives. These objectives include the following: (1) the datingstratigraphic “events” and associated surfaces that might be relatsea-level change; (2) investigating how sedimentary architecturrelated to sea-level variations (local or global); and (3) if a role eustasy can be demonstrated, estimating the magnitudes and raeustatic change through time. All recognized that multiple drillinlegs would be required to make comparisons among coeval sucsions at different locations, and that ODP would be able to samonly a small portion of Earth’s sea-level history. Therefore, three tervals were prioritized within the Mesozoic to Cenozoic span accsible to ocean drilling: (1) the late middle Eocene to Holoce(“Icehouse”) Earth, dominated by the waxing and waning of connental ice sheets; (2) the mid-Cretaceous (“Greenhouse” or “Hhouse”) Earth, when ice sheets were essentially absent; and (3intermediate interval from the latest Paleocene to the middle Eocwhen the degree of glaciation is unknown or uncertain, and for whthe term “Doubthouse” Earth was suggested (Miller et al., 191991b; Watkins and Mountain, 1990; Barron et al., 1991; Frakeal., 1992; Browning et al., 1996; Stoll and Schrag, 1996; Miller et ain press).
The scientific ocean drilling community tacitly assumed that thapproach would lead to insights about possible mechanisms ofstatic change, as well as to a broader understanding of the relaships between eustasy and various phenomena, including changcontinental ice volume (and hence global climate), nearshore ecotems, particle and nutrient transfer to the deep sea, ocean circulabiological evolution, and patterns of deposition, erosion, and hydcarbon distribution in sedimentary basins. It is now clear that main control on short-term eustasy is the continental ice budget that during nonglacial times, sedimentary cyclicity is likely to habeen influenced significantly by noneustatic mechanisms, includtectonics (Christie-Blick and Driscoll, 1995). There is no evidencesupport the long-held assumption in sea-level studies that tectprocesses act only at long time scales (cf. Vail et al., 1991). Newpotheses have also been advanced concerning the stratigraphsponse to eustatic change. Modeling studies suggest that thissponse may vary from one basin to another, because of variabilitsuch factors as the local rate of subsidence and sediment supplyrelative abundance of siliciclastic vs. carbonate sediment, comption history, and the physiography of the depositional surface. Thecally determined timing of sea-level events is therefore expectedvary, even when the events are global (Jordan and Flemings, 1Reynolds et al., 1991; Christie-Blick, 1991; Steckler et al., 199strict stratigraphic synchroneity cannot be assumed as a criterionjudging the role of eustasy in the origin of observed sedimentary
5
N. CHRISTIE-BLICK ET AL.
Figure 1. Schematic cross-section from the New Jersey Coastal Plain crossing the continental shelf, slope, and rise in the vicinity of Leg 174A (after Grow andSheridan, 1988). The wedge labeled “synrift clastics and volcanics” is now known to be composed primarily of volcanic rocks (Sheridan et al., 1993).
oeea 1 ed4e
serc1g aa
el-mar-88), Ma;uent andattser et4Aater un-ner-
n be-depthteck-n theity-e tohy,al-f 4
clicity. Instead, precise dating of stratigraphic successions at a num-ber of well-chosen locations may permit predicted leads and lags tobe measured. Ocean drilling has been consistently envisioned as aprimary tool for such an approach to studying the history of sea-levelchange.
The Sea Level Working Group (1992) endorsed a three-fold ap-proach to sea-level studies, involving (1) passive continental margins(primarily siliciclastic); (2) carbonate atolls, guyots, and platforms,the so-called “dipstick” approach; and (3) the deep-sea oxygen ispic record, a proxy for the growth and decay of continental ice shThis strategy has since been reaffirmed in the SGPP White P(1994) and in the JOIDES Long Range Plan (1996). ODP Legsand 166 addressed “Icehouse” sea-level issues at the seawardgins of carbonate platforms off northeastern Australia and the wern Great Bahama Bank, respectively. Legs 143 and 144 studie“Greenhouse” drowning history of western Pacific guyots. Leg 17is a continuation of the New Jersey Mid-Atlantic Sea-level Trans(MAT), the first concerted effort to evaluate the effects of “Icehouglacial-eustatic change at a passive continental margin characteby predominantly siliciclastic sedimentation. Leg 174A follows sucessful sampling of the continental slope and rise during Leg (Miller and Mountain, 1994; Miller et al., 1996c), and continuinstudies of the adjacent New Jersey Coastal Plain (Legs 150X174AX; Miller et al., 1994, 1996a, 1998, in press; Miller and Sugman, 1995; Pekar and Miller, 1996).
6
to-ts.per33mar-st- theAct”
ized-50
ndr-
GEOLOGY OF THE NEW JERSEY CONTINENTAL MARGIN AND SUITABILITY FOR SEA-LEVEL
STUDIES
The U.S. mid-Atlantic region, including parts of New Jersey, Daware, and Maryland (Figs.1, 2), is a classic passive continental gin. Rifting began in the Late Triassic (Grow and Sheridan, 19and seafloor spreading commenced by the Middle Jurassic (~165Sheridan, Gradstein, et al., 1983; Klitgord et al., 1988). Subseqsubsidence has been governed primarily by lithospheric coolingby flexural loading and compaction of accumulating sediment (Wand Steckler, 1979; Watts, 1988; Reynolds et al., 1991; Stecklal., 1993; Pazzaglia and Gardner, 1994). In the vicinity of Leg 17sites, the Jurassic section is composed of 8–12 km of shallow-wlimestones and shales. A barrier reef complex fringed the margintil the mid-Cretaceous (Poag, 1985). Accumulation rates were geally low during latest Cretaceous to Paleogene, when the margicame relatively starved of sediment, and the shelf subsided to a of several hundred meters below sea level (Poag, 1985; M.S. Sler, pers. comm., 1997). An abrupt increase in sediment supply iOligocene led to the deposition of a series of thick, unconformbounded sediment wedges that built seaward during Miocene timproduce a shelf with a terraced morphology. This physiograpwhich is quite different from that of the modern shelf, involves a shlow ramp and a deep ramp separated by an intervening slope o°–
INT
RO
DU
CT
ION
: A T
ES
T O
F S
EQ
UE
NC
E S
TR
AT
IGR
AP
HY7
B2
2000
m1000 m
200 m
1
3
6
8
14
24
25
26
27
7
8 9A
E500
G
B3
39°N
73°W
E599T598
T642-3
T642-1Ten642
200 m
D612 D613
AM
23
D604
D605A14
A15
Seismic Lines
Ew9009 MCS
Ew9009 SCS
USGS 25
Exxon 77-8
BGR 201
(100)3
902903
904
905
906
13A 13C1073
13D
10711072
7b
Oc270
lls
ites 1072
s 9037
0 km
H = HOM 676-1 G = Gulf 857-1 Ten642 = Tenneco 642-2
T - 598, 642-1, 642-3 = Texaco 598-1, 642-1, & 642-3 AM = Amcor6021
B2 = Cost B2 B3 = Cost B3 A14 = ASP14 A15 = ASP15
D604, 605, 612, & 613 = DSDP 604, 605, 612, & 613
E 500 & 599 = Exxon 500-1 & 599-1 M = Mobil 544-1 S = Shell 632-1
77o
M
A
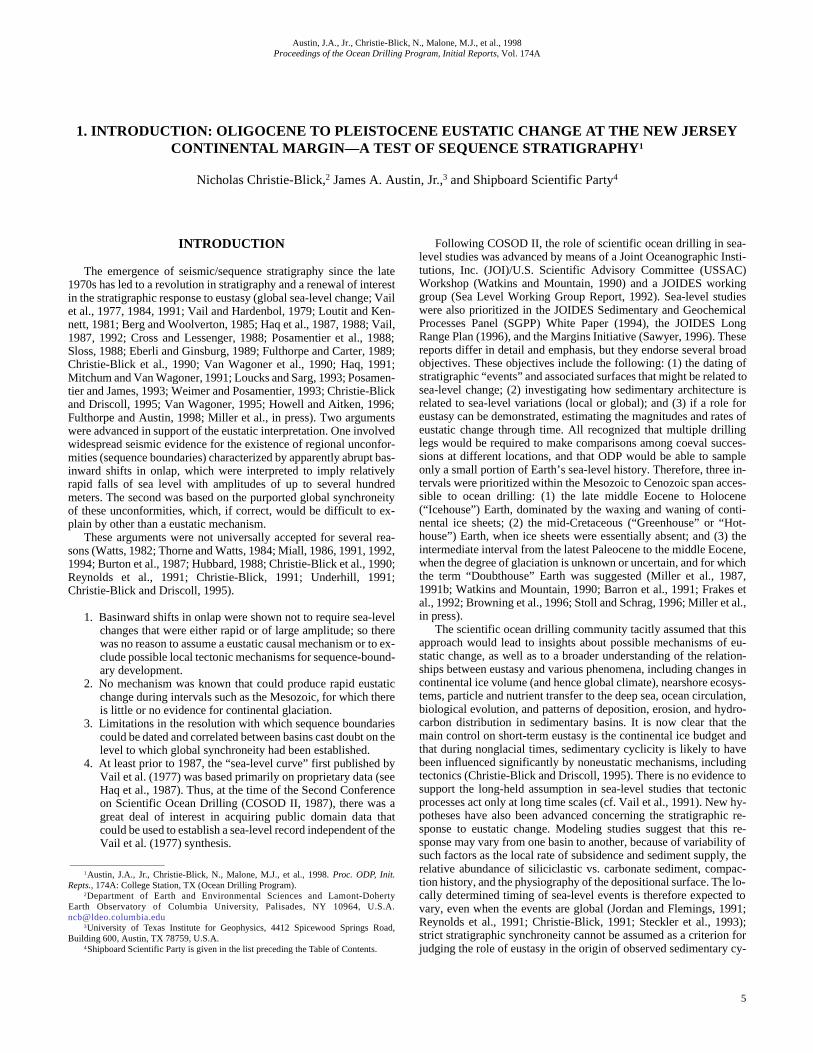
Figure ations of the Leg 174AX Bass River Site on the New Jersey CoastalPlain; re), Ocean City (onshore). Ewing 9009 MCS lines are shown, along with thelocati 4A sites (except 13A, which was located at the intersection of Ew9009 andExxon
903
2
7
1112
13
45
6
M
S
H
15
5
30
34
28
3
10
11
5.5
Existing we
Leg 174A SLeg 150 SiteFuture Sites
0 10 238o
39o
40o
41oN72oW73o75o 74o76o
ID-ATLANTIC TRANSECTEw9009 MCS
ODP Leg 150, 150X
Future Drillsites
CR
ET A
C E O U SO U T C R O P
CE N
O Z O I CO U T C R O P
P
I ED
MO
NT
Island Beach
Atlantic City
Cape May
Existing DrillsitesDSDPOffshore ExplorationOnshore Misc.
200 m
1000 m
2000 m
3000 m
12
3
4A 5A
6A7A
1072
902903 904
o
✫✫
✫
✛
✛
✛
✛
✛
✛
✛
✛
✛
✛✛
✛
✛
✛
✛
✫
6 A
10713A
905
other MCS
✛✛✛✛✛
✫✫
BGR 201
USGS 25
Ex 77
-8
✛
✫✫
✫
903
906
Offshore - other platform
Bass River
5.5A
7B
13A 13C
13D
1073
Onshore
ODP Leg 174A, 174AX1072
Ocean City
B
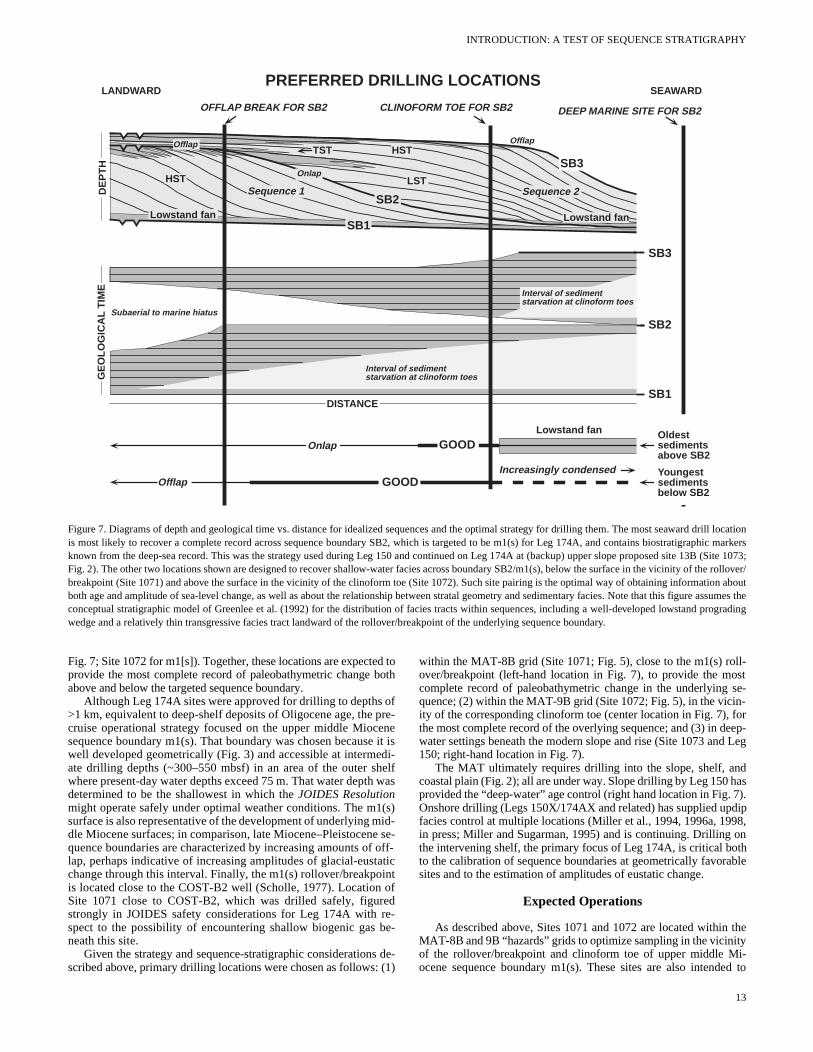
2. A. Locations of Leg 174A Sites 1071 and 1072 on the outer shelf and Site 1073 on the uppermost slope. Also shown are the loc Leg 150 Sites 902–906; Leg 150X Island Beach, Atlantic City, and Cape May Sites; and proposed MAT sites 1–13 (offshoon of selected industry seismic profiles. B. Oceanus 270 high-resolution MCS coverage (bold lines), used to select all Leg 17 MCS profiles).
N. CHRISTIE-BLICK ET AL.
s
relighs pip
981;
thels-
al.,avetion94,is-
no-nt,
res-
6° (Figs. 3, 4). The cause of the Oligocene increase in sediment sup-ply is uncertain, but may reflect hinterland tectonic uplift and/or anincrease in terrestrial weathering rates and associated soil erosion(Poag and Sevon, 1989; Poag and Ward, 1993; Sugarman et al., 1993;Pazzaglia and Brandon, 1996).
This part of the U.S. Atlantic margin is well suited for the studyof sea-level changes during the Oligocene to Holocene “Icehouinterval for several reasons.
1. Upper Oligocene to Miocene and Pleistocene records are tively complete (the Pliocene record is uncertain), and hrates of sediment accumulation (tens to hundreds of metermillion years) make it possible to resolve stratal relationsh
8
e”
a-
ers
in great detail on seismic data (Poag, 1977; Schlee, 1Greenlee et al., 1988, 1992).
2. The best possible biostratigraphic control is ensured bymid-latitude setting (Poag, 1985; Olsson and Wise, 1987; Oson et al., 1987; Poore and Bybell, 1988; Greenlee et1992). Upper Eocene–Miocene sediments of this region hadequate carbonate to utilize strontium-isotope correlatechniques (Sugarman et al., 1993; Miller et al., 1991a, 191996b; Oslick et al., 1994; Miller and Sugarman, 1995). Pletocene stratigraphic control afforded by integration of nanfossil and physical properties data is also excelleparticularly for deep-water sediments (better than 20-k.y. olution; Mountain, Miller, Blum, et al., 1994).
-1100
-900-800-700
-600
-500
73˚ 30'W 73˚ 20'W 73˚ 10'W 73˚ 00'W 72˚ 50'W 72˚ 40'W 72˚ 30'W
38˚ 50'N
39˚ 00'N
39˚ 10'N
39˚ 20'N
39˚ 30'N
39˚ 40'N
902903
904
906
612
MAT-13AMAT-13A
m1(s)
Middle Miocene
(~11.5 Ma)
20 km
20 km
500
ms
(~50
0 m
)
1100
1000
900
800
700
600
500
Canyon
Erosion/
reflection
truncations
Possible downslopecontinuation of canyondrainage
Clinoform Breakpoint
-1000
MAT-7B
1071
1072
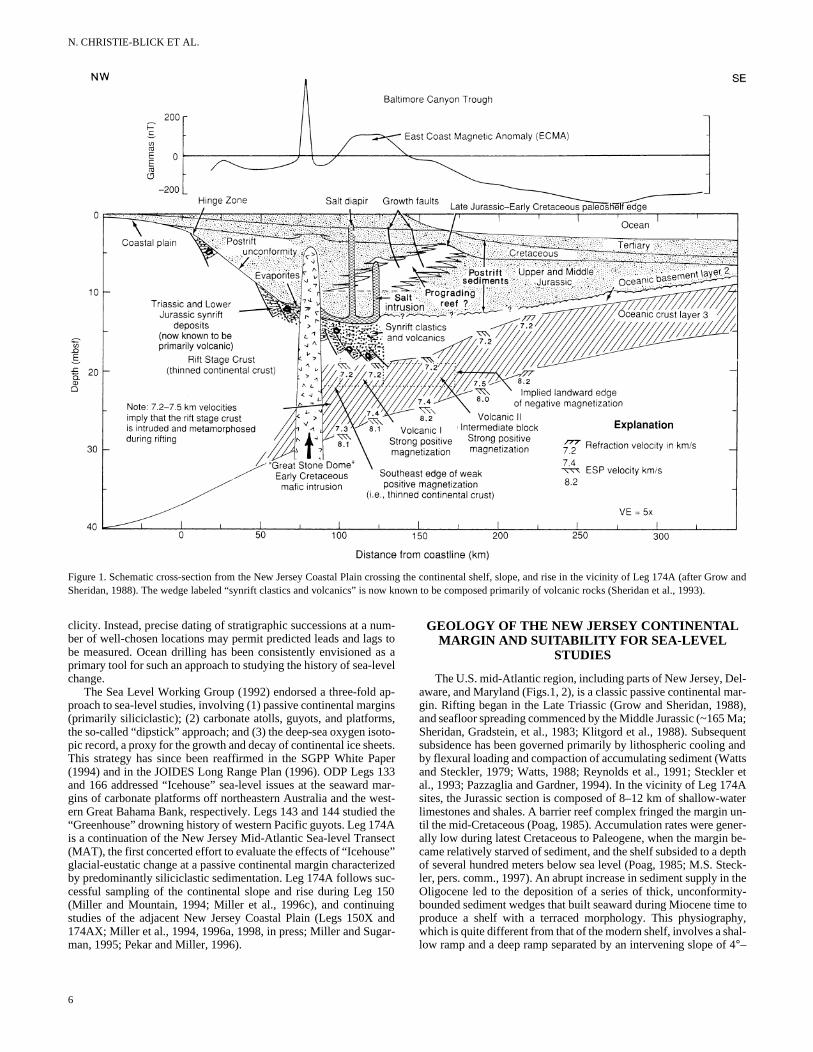
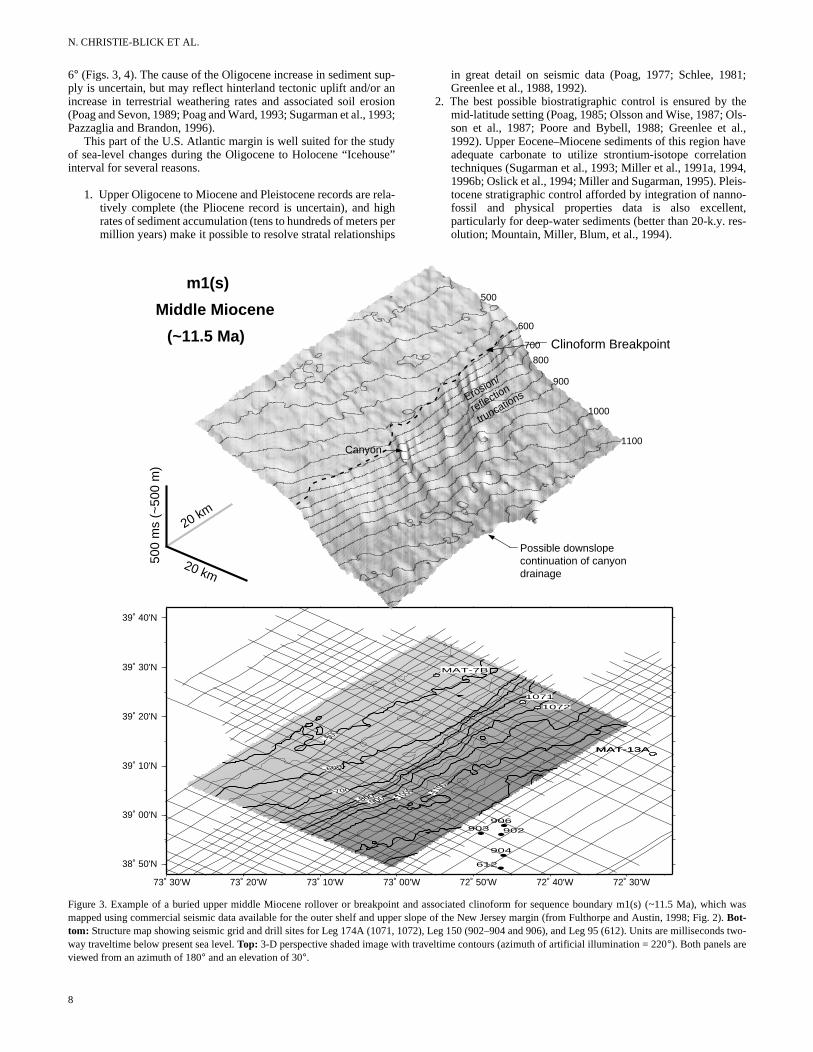
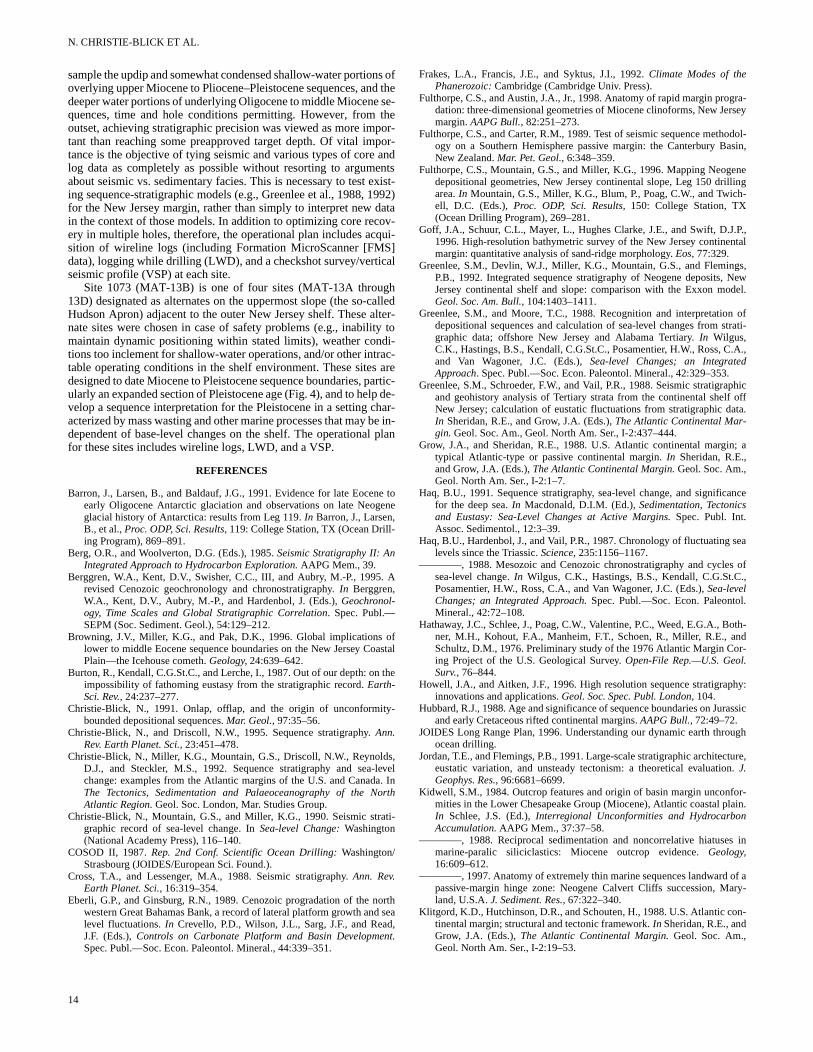
Figure 3. Example of a buried upper middle Miocene rollover or breakpoint and associated clinoform for sequence boundary m1(s) (~11.5 Ma), which wasmapped using commercial seismic data available for the outer shelf and upper slope of the New Jersey margin (from Fulthorpe and Austin, 1998; Fig. 2). Bot-tom: Structure map showing seismic grid and drill sites for Leg 174A (1071, 1072), Leg 150 (902–904 and 906), and Leg 95 (612). Units are milliseconds two-way traveltime below present sea level. Top: 3-D perspective shaded image with traveltime contours (azimuth of artificial illumination = 220°). Both panels areviewed from an azimuth of 180° and an elevation of 30°.
INTRODUCTION: A TEST OF SEQUENCE STRATIGRAPHY
y.
Se
con
ds
0
1
2
3Ew9009 Line 1002 0 20 km
10721071 1073 (projected)
K/T
o1(s)
m1(s)
m3(s)
m6(s)
~1 km NE of EW9009 Line 1002
Vertical Exaggeration(topography) ~21x
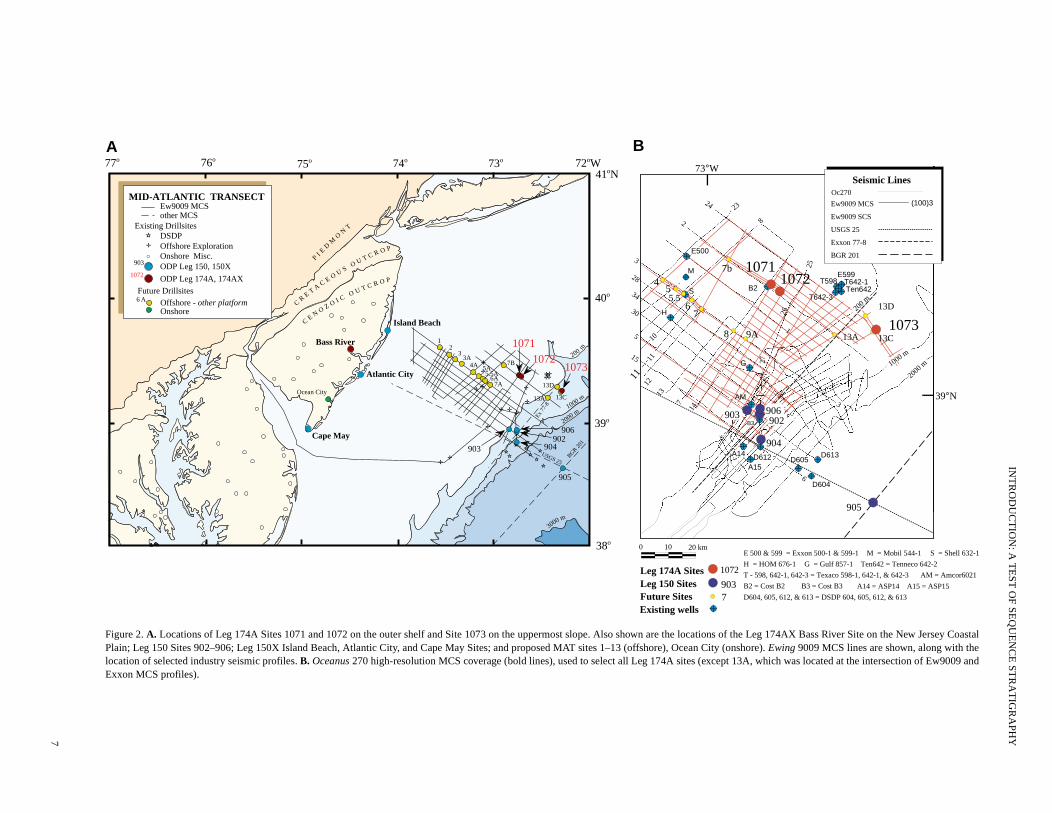
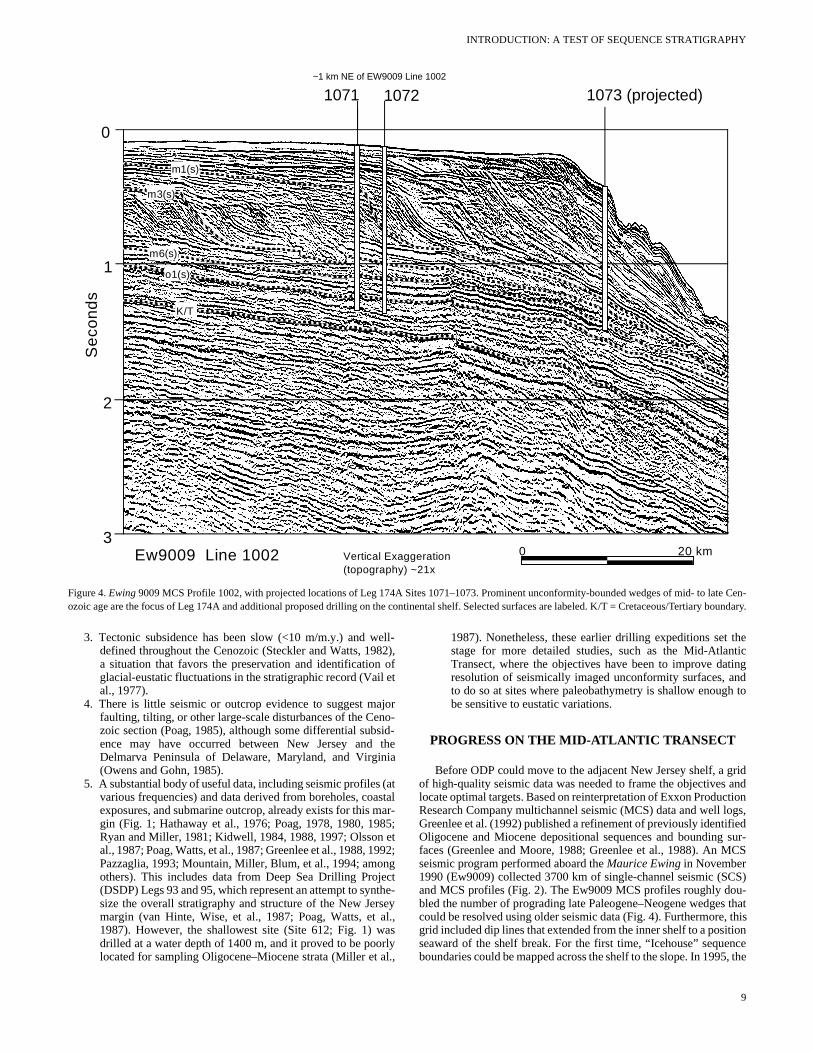
Figure 4. Ewing 9009 MCS Profile 1002, with projected locations of Leg 174A Sites 1071–1073. Prominent unconformity-bounded wedges of mid- tolate Cen-ozoic age are the focus of Leg 174A and additional proposed drilling on the continental shelf. Selected surfaces are labeled. K/T = Cretaceous/Tertiary boundar
a
thetictingnd to
gridandtiongs,iedsur-CS
S)u- that thisionnce, the
3. Tectonic subsidence has been slow (<10 m/m.y.) and well-defined throughout the Cenozoic (Steckler and Watts, 1982),a situation that favors the preservation and identification ofglacial-eustatic fluctuations in the stratigraphic record (Vail etal., 1977).
4. There is little seismic or outcrop evidence to suggest majorfaulting, tilting, or other large-scale disturbances of the Ceno-zoic section (Poag, 1985), although some differential subsid-ence may have occurred between New Jersey and theDelmarva Peninsula of Delaware, Maryland, and Virginia(Owens and Gohn, 1985).
5. A substantial body of useful data, including seismic profiles (atvarious frequencies) and data derived from boreholes, coastalexposures, and submarine outcrop, already exists for this mar-gin (Fig. 1; Hathaway et al., 1976; Poag, 1978, 1980, 1985;Ryan and Miller, 1981; Kidwell, 1984, 1988, 1997; Olsson etal., 1987; Poag, Watts, et al., 1987; Greenlee et al., 1988, 1992;Pazzaglia, 1993; Mountain, Miller, Blum, et al., 1994; amongothers). This includes data from Deep Sea Drilling Project(DSDP) Legs 93 and 95, which represent an attempt to synthe-size the overall stratigraphy and structure of the New Jerseymargin (van Hinte, Wise, et al., 1987; Poag, Watts, et al.,1987). However, the shallowest site (Site 612; Fig. 1) wasdrilled at a water depth of 1400 m, and it proved to be poorlylocated for sampling Oligocene–Miocene strata (Miller et
l.,1987). Nonetheless, these earlier drilling expeditions set stage for more detailed studies, such as the Mid-AtlanTransect, where the objectives have been to improve daresolution of seismically imaged unconformity surfaces, ato do so at sites where paleobathymetry is shallow enoughbe sensitive to eustatic variations.
PROGRESS ON THE MID-ATLANTIC TRANSECT
Before ODP could move to the adjacent New Jersey shelf, a of high-quality seismic data was needed to frame the objectives locate optimal targets. Based on reinterpretation of Exxon ProducResearch Company multichannel seismic (MCS) data and well loGreenlee et al. (1992) published a refinement of previously identifOligocene and Miocene depositional sequences and bounding faces (Greenlee and Moore, 1988; Greenlee et al., 1988). An Mseismic program performed aboard the Maurice Ewing in November1990 (Ew9009) collected 3700 km of single-channel seismic (SCand MCS profiles (Fig. 2). The Ew9009 MCS profiles roughly dobled the number of prograding late Paleogene–Neogene wedgescould be resolved using older seismic data (Fig. 4). Furthermore,grid included dip lines that extended from the inner shelf to a positseaward of the shelf break. For the first time, “Icehouse” sequeboundaries could be mapped across the shelf to the slope. In 1995
9
N. CHRISTIE-BLICK ET AL.
4-
le
ote bp
o opsi h
l
h Reti
r
9f
b4
cv
itrath
i
otmf
ing:elfun-
UTIGtheshelflti-
ng a
nsvedmeetnel.)tyionalbothg
eis-gu-stic
nsAT-re
Also
es)hore.
Ewing profiles were augmented by higher resolution MCS profiles,including detailed hazards grids, collected aboard the Oceanus(Oc270; Figs. 2, 5). Locations of all but one site (MAT-13A; Fig. 2)proposed for drilling during Leg 174A were chosen on the basis ofanalysis and continuing interpretation of the newer Oceanus data.
Leg 150 (June–July, 1993; Mountain, Miller, Blum, et al., 199capitalized on the Ewing shelf-to-slope imaging and drilled four locations (Sites 902–904 and 906) at water depths of between 4451134 m (Fig. 2). These sites document the age and facies of sedimassociated with a total of 22 lower Eocene to mid-Pleistocene refing surfaces tentatively interpreted as, or jump-correlated landwwith, sequence boundaries (Fig. 6). Integrated biostratigraphic, mnetostratigraphic, and strontium isotopic stratigraphy yield tempresolution approaching several hundred thousand years (Miller e1996c, in press). In most cases, interpreted sequence boundariassociated with little or no temporal hiatus; many are expressedslight coarsening of sediment transported to the slope, it was sumed, during low stands of sea level.
To complement the Leg 150 results, MAT proponents launcheland-based drilling program with support from ODP, the NationScience Foundation (NSF), and the U.S. and State of New Jerseylogical surveys (Miller et al., 1994). Primary objectives of these shore boreholes (Leg 150X and related; Fig. 2) have been to dateCretaceous to Cenozoic sequences, including the Paleocene–E“Doubthouse” section, and to evaluate facies architecture in an usetting. Thus far, four holes have been cored and logged, all at close to the modern shoreline (Fig. 2), and more are planned (Met al., 1994, 1996a, 1998, in press). Late middle Eocene to middleocene sequence boundaries in both onshore and Leg 150 boreappear to correlate, at available resolution, with prominent δ18O in-creases, consistent with the hypothesis that these surfaces deveduring global lowstands of sea level (Mountain, Miller, Blum, et a1994; Miller et al., 1996a, 1996c, 1998, in press). The ages of tsequence boundaries compare well with timing of the Haq et(1987) “global” boundaries (Miller et al., 1996a, 1996c, in press). cently completed drilling at Bass River, New Jersey (ODP L174AX; Fig. 2), has also recovered a complete Cretaceous/Terboundary section (Olsson et al., 1997; Miller et al., 1998).
Facies successions on shore are generally well developed foPaleocene through middle Miocene, with a transgressive shell beglauconite sand at the base of each sequence and quartz sandtop (upper part of the highstand facies tract; Sugarman et al., 1Miller et al., 1994). Onshore drilling has provided important data regional profiles, but all of the boreholes are landward of the Ogocene–Miocene clinoforms imaged in seismic reflection data neath the shelf (Figs. 2–4). The shelf sites, tackled during Leg 17are the ones most critical for estimating amplitudes of sea-lechange during the “Icehouse” interval.
AVAILABLE DATA
The New Jersey margin is one of two study areas recently seleby the U.S. Office of Naval Research (ONR) for a multiyear initiatithat it has termed “Strata Formation on Margins” (STRATAFORMTogether with studies of a contrasting margin off northern Californthe goal is to investigate the range of factors affecting the deposand preservation of shelf and slope stratigraphy (Nittrouer and Kitz, 1995). Off New Jersey, the missions of STRATAFORM and MAT coincide.
As a result, ONR and JOI/USSAC supported a consortium ofvestigators from the University of Texas Institute for Geophys(UTIG), Lamont-Doherty Earth Observatory (LDEO), and RutgeUniversity to collect, analyze, and interpret high-resolution MCdata on the New Jersey shelf and upper slope in support of propdrilling during the summer of 1995 (Fig. 2). These data, collecduring cruise Oc270, included a series of detailed “hazards” seisgrids mandated by ODP (Fig. 5), augmenting a substantial set o
10
)
andentsct-
ardag-ral al.,s arey are-
d aalgeo-n-LatecenedipitesllerMi-oles
opedl.,eseal.e-g
ary
thed orat the93;
orli-e-A,
vel
tede).ia,ionv-e
in-csrsSsed
edic
re-
gional geophysical and geological data that includes the follow(1) the 60-fold Ew9009 MCS profiles collected from the inner shto the rise (Fig. 4); (2) 2-D and 3-D SCS seismic grids (using a Htec deep-towed system) and associated vibracores collected by in 1989 and 1993; (3) commercial MCS profiles collected during 1970s in a dense grid (~2.5-km line spacing) across the outer and upper slope (Fulthorpe and Austin, 1998; Fig. 2); and (4) mubeam bathymetry/backscatter coverage of the entire area usicommercial Simrad EM-1000 system (Goff et al., 1996).
The Oc270 MCS survey consists of two interwoven track plawith complementary missions. One element of the survey involacquisition of hazards-type grids at eight proposed shelf sites to MAT goals set by the JOIDES Pollution Prevention and Safety PaMultiple locations within individual site grids 8B and 9B (Fig. 5were approved for drilling by both JOIDES and ODP-TAMU safepanels in September 1996. The second Oc270 element is a reggrid (Fig. 2) across the outer shelf and upper slope, to achieve STRATAFORM objectives and MAT goals by attempting to tie Le150 sites to the shelf stratigraphy. In conjunction with the earlier smic data (Fig. 2), Oc270 profiles allow us to determine the confiration of buried stratal surfaces and their accompanying acou
72° 55´W 72° 50´ 72° 45´ 72° 40´39 30´°
149
247
8B
9B
145
72° 45´ 72° 40´
39° 21´
39° 24´
0 1km
1072
51
1002
802
804
806
808
810
812
814
902
904
906
908
910
912
914
49
45
147047
803
887
885
805
149
801
881
807
247
145
8
610
07
52
N
A
B
Site 1071 (Holes A-E)Site 1071 (Holes F-G)
COST-B2
8B-2
9B-2
9B-3
39° 20´
N
W
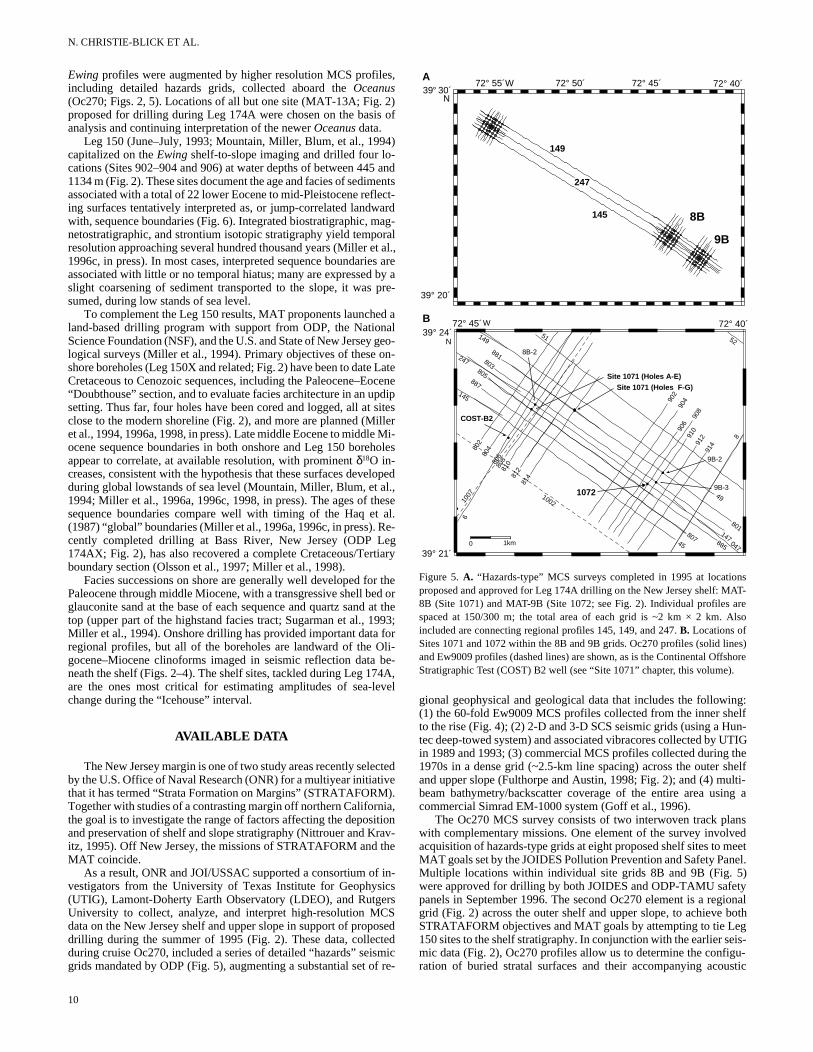
Figure 5. A. “Hazards-type” MCS surveys completed in 1995 at locatioproposed and approved for Leg 174A drilling on the New Jersey shelf: M8B (Site 1071) and MAT-9B (Site 1072; see Fig. 2). Individual profiles aspaced at 150/300 m; the total area of each grid is ~2 km × 2 km. included are connecting regional profiles 145, 149, and 247. B. Locations ofSites 1071 and 1072 within the 8B and 9B grids. Oc270 profiles (solid linand Ew9009 profiles (dashed lines) are shown, as is the Continental OffsStratigraphic Test (COST) B2 well (see “Site 1071” chapter, this volume)
INTRODUCTION: A TEST OF SEQUENCE STRATIGRAPHY
"Eustatic" CurveHaq et al. (1987)
TB2.1
TB1.5
TB1.4
TB2.2
TB2.3
TB2.4
TB2.5
TB2.6
TB3.1
TB1.3
TB1.2
TB1.1
TA4.5
TA4.4
-100 1000 200 mla
teea
rlym
iddl
e
Olig
ocen
e
early
Age
(M
a)
16
18
20
22
24
26
28
14
12
10
30
32
34
36
late
Mio
cene
Shelf-slopeReflections(sequence
boundaries)
(Tuscan)m1
(Yellow-2)m2
(Blue)m3
(Ochre)m5.2
(Sand)m5.4
(Blue)m5.6
(Pink-3)m6
(Green-2)o1
Oi2b
Mi1
Mi1a
Mi1b
Mi2
Mi3b
Mi4
Mi5
Oi1
Oi2a
Mi3a
Mi6
O18
1.01.52.0
(Green)m5
(Pink-2)m4
?
Kw0
Kw1c
Kw2a
Kw2b
Kw3
Kw-Coh.
O6
O5
O4
O3
O2
?O1
Kw2c
Onshoresequences
Kw1a,b
?
benthic foraminifers
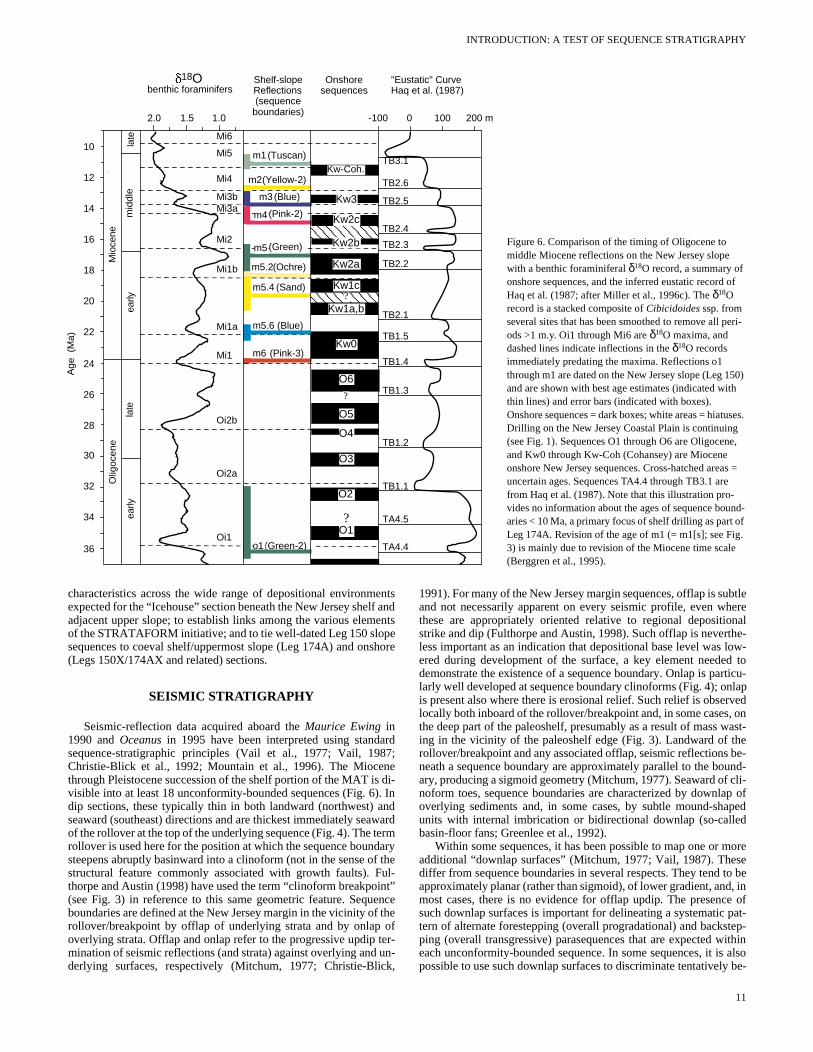
Figure 6. Comparison of the timing of Oligocene to middle Miocene reflections on the New Jersey slope with a benthic foraminiferal δ18O record, a summary of onshore sequences, and the inferred eustatic record of Haq et al. (1987; after Miller et al., 1996c). The δ18O record is a stacked composite of Cibicidoides ssp. from several sites that has been smoothed to remove all peri-ods >1 m.y. Oi1 through Mi6 are δ18O maxima, and dashed lines indicate inflections in the δ18O records immediately predating the maxima. Reflections o1 through m1 are dated on the New Jersey slope (Leg 150) and are shown with best age estimates (indicated with thin lines) and error bars (indicated with boxes). Onshore sequences = dark boxes; white areas = hiatuses. Drilling on the New Jersey Coastal Plain is continuing (see Fig. 1). Sequences O1 through O6 are Oligocene, and Kw0 through Kw-Coh (Cohansey) are Miocene onshore New Jersey sequences. Cross-hatched areas = uncertain ages. Sequences TA4.4 through TB3.1 are from Haq et al. (1987). Note that this illustration pro-vides no information about the ages of sequence bound-aries < 10 Ma, a primary focus of shelf drilling as part of Leg 174A. Revision of the age of m1 (= m1[s]; see Fig. 3) is mainly due to revision of the Miocene time scale (Berggren et al., 1995).
lfe
psh
a8n
).aw
tedf uinef o t uk
ubtleherenal
the-low-d torticu-laprved, onwast-he be-und-
cli-ap ofapedd
moreseto be, ine of
pat-tep-ithin also be-
characteristics across the wide range of depositional environmentsexpected for the “Icehouse” section beneath the New Jersey sheadjacent upper slope; to establish links among the various elemof the STRATAFORM initiative; and to tie well-dated Leg 150 slosequences to coeval shelf/uppermost slope (Leg 174A) and on(Legs 150X/174AX and related) sections.
SEISMIC STRATIGRAPHY
Seismic-reflection data acquired aboard the Maurice Ewing in1990 and Oceanus in 1995 have been interpreted using standsequence-stratigraphic principles (Vail et al., 1977; Vail, 19Christie-Blick et al., 1992; Mountain et al., 1996). The Miocethrough Pleistocene succession of the shelf portion of the MAT isvisible into at least 18 unconformity-bounded sequences (Fig. 6dip sections, these typically thin in both landward (northwest) seaward (southeast) directions and are thickest immediately seaof the rollover at the top of the underlying sequence (Fig. 4). The rollover is used here for the position at which the sequence bounsteepens abruptly basinward into a clinoform (not in the sense ostructural feature commonly associated with growth faults). Fthorpe and Austin (1998) have used the term “clinoform breakpo(see Fig. 3) in reference to this same geometric feature. Sequboundaries are defined at the New Jersey margin in the vicinity orollover/breakpoint by offlap of underlying strata and by onlapoverlying strata. Offlap and onlap refer to the progressive updipmination of seismic reflections (and strata) against overlying andderlying surfaces, respectively (Mitchum, 1977; Christie-Blic
andnts
eore
rd7;edi- Inndardrmarythel-t”nce
thef
er-n-,
1991). For many of the New Jersey margin sequences, offlap is sand not necessarily apparent on every seismic profile, even wthese are appropriately oriented relative to regional depositiostrike and dip (Fulthorpe and Austin, 1998). Such offlap is neverless important as an indication that depositional base level was ered during development of the surface, a key element neededemonstrate the existence of a sequence boundary. Onlap is palarly well developed at sequence boundary clinoforms (Fig. 4); onis present also where there is erosional relief. Such relief is obselocally both inboard of the rollover/breakpoint and, in some casesthe deep part of the paleoshelf, presumably as a result of mass ing in the vicinity of the paleoshelf edge (Fig. 3). Landward of trollover/breakpoint and any associated offlap, seismic reflectionsneath a sequence boundary are approximately parallel to the boary, producing a sigmoid geometry (Mitchum, 1977). Seaward ofnoform toes, sequence boundaries are characterized by downloverlying sediments and, in some cases, by subtle mound-shunits with internal imbrication or bidirectional downlap (so-callebasin-floor fans; Greenlee et al., 1992).
Within some sequences, it has been possible to map one or additional “downlap surfaces” (Mitchum, 1977; Vail, 1987). Thediffer from sequence boundaries in several respects. They tend approximately planar (rather than sigmoid), of lower gradient, andmost cases, there is no evidence for offlap updip. The presencsuch downlap surfaces is important for delineating a systematictern of alternate forestepping (overall progradational) and backsping (overall transgressive) parasequences that are expected weach unconformity-bounded sequence. In some sequences, it ispossible to use such downlap surfaces to discriminate tentatively
11
N. CHRISTIE-BLICK ET AL.
siz T
a
orrrmidr.a
c
r
s e
f pe
evelde-
d se-
atthis
tsm- m.f theec-
on-m.
desct ofsectti-di-elfand se-
ngss arent ofed for
pre-se-neaths innti-in-ak toties lim-
earshelfc-
fortab-sso-ionnds theserove
byatts,le
t fortrym-he arerrorse
over/cein
tween lowstand-transgressive and highstand facies tracts. However,flooding surfaces cannot generally be used to separate lowstand andtransgressive units, because they are not necessarily associated withdistinctive reflection geometry.
The quality of MCS data collected for the MAT is substantiallybetter than for those acquired previously by industry (e.g., Greenleeet al., 1992), particularly for the shallow section (<~1 s two-way trav-eltime). However, separation of shelf profiles is sufficiently great (~3to >10 km for the Ewing data and 0.15 to ~4 km for the Oceanus data)that mis-ties arose frequently, particularly where sequence bound-aries are characterized by erosional relief and/or where water-bottomand peg-leg multiples of both dipping and near-horizontal reflectionsintroduce uncertainties in tracing locations of clinoform segments.Mis-ties were resolved by systematic regional mapping using boththe Ewing and Oceanus seismic grids. Although some profile sec-tions proved to be more useful than others in this regard, no sectioncan be regarded as definitive; strike sections are just as important asdip sections for regional sequence-stratigraphic interpretation. Infact, few of the high-resolution MCS sections available are strictlyparallel or transverse to depositional strike at any stratigraphic level.Confidence in interpretation drops off both landward of rollovers/breakpoints and seaward of clinoform toes, where sequence bound-aries become closely spaced and either merge at seismic resolution(~5 m vertically for the Oc270 profiles) or pass into zones of poorerreflection continuity and/or multiple interference.
Each interpreted sequence boundary targeted for drilling beneaththe shelf was tentatively correlated with seismic reflections identifiedbeneath the continental slope during Leg 150 (m1, m2, m3, etc.;Mountain, Miller, Blum, et al., 1994). However, because of unavoid-able uncertainties in physical stratigraphic correlation, surfaces thatare defined on the shelf are indicated with the suffix “s” (e.g., m1[indicating a stratigraphic level close to the presumed coeval horon the slope (e.g., m1), but not necessarily precisely coincident.best pre-Leg 174A drilling estimates of ages for these surfacesgiven in Figure 6, from Greenlee et al. (1992), Miller and Mount(1994), and Miller et al. (1996c).
Clinoforms in all sequences indicate overall progradation frnorthwest to southeast, a pattern already established from interption of lower frequency industry MCS profiles (Greenlee and Moo1988; Fulthorpe and Austin, 1998). However, individual rollovebreakpoints are characterized by locally prominent excursions in view (e.g., m4[s] and m5.6[s]). Maximum thicknesses within indivual sequences also vary markedly from one dip section to anothequence thickness and paleobathymetric relief from rollover/brepoint to clinoform toe increase from lower Miocene wedgesmiddle Miocene and younger wedges because of increasing acmodation for sediment in a seaward direction (Fig. 4). Rollovebreakpoints form two distinct clusters, with especially strong progdation between m5(s) in the lower Miocene and m4(s) in the midMiocene. The degree of offlap at sequence boundaries also incresignificantly from the lower and middle Miocene wedges to thosePliocene–Pleistocene age. The increase in degree of offlap is preably related to increasing exposure of the shallow shelf duringquence-boundary development as a result of increasing amplitudassociated glacial-eustatic change.
OBJECTIVES OF LEG 174A, STRATEGY FOR SITE SELECTION, AND EXPECTED OPERATIONS
Scientific Objectives
The primary goals of Leg 174A are the following:
1. To date as precisely as possible sequence boundaries ogocene–Pleistocene age, and to compare this stratigrarecord with the timing of glacial-eustatic changes inferrfrom deep-sea δ18O variations;
12
]),onhearein
meta-e,s/ap- Se-k-
toom-rs/a-dleasesofum-se-s of
Oli-hicd
2. To place constraints on the amplitudes and rates of sea-lchange that may have been responsible for unconformity velopment;
3. To assess the relationships between depositional facies anquence architecture; and
4. To provide a baseline for future scientific ocean drilling thwill address the effects and timing of sea-level changes on and other passive continental margins.
An additional goal for Leg 174A is technical. The leg representhe first attempt by scientific ocean drilling in almost 30 years to saple a thickly sedimented continental margin in water depths <150Two sites (Sites 1071 and 1072) are located on the outer part ocontinental shelf in water depths of 88–90 and 98–100 m, resptively. An additional site (Site 1073) is located on the uppermost ctinental slope, part of the Hudson Apron, in a water depth of 639
Transect Strategy
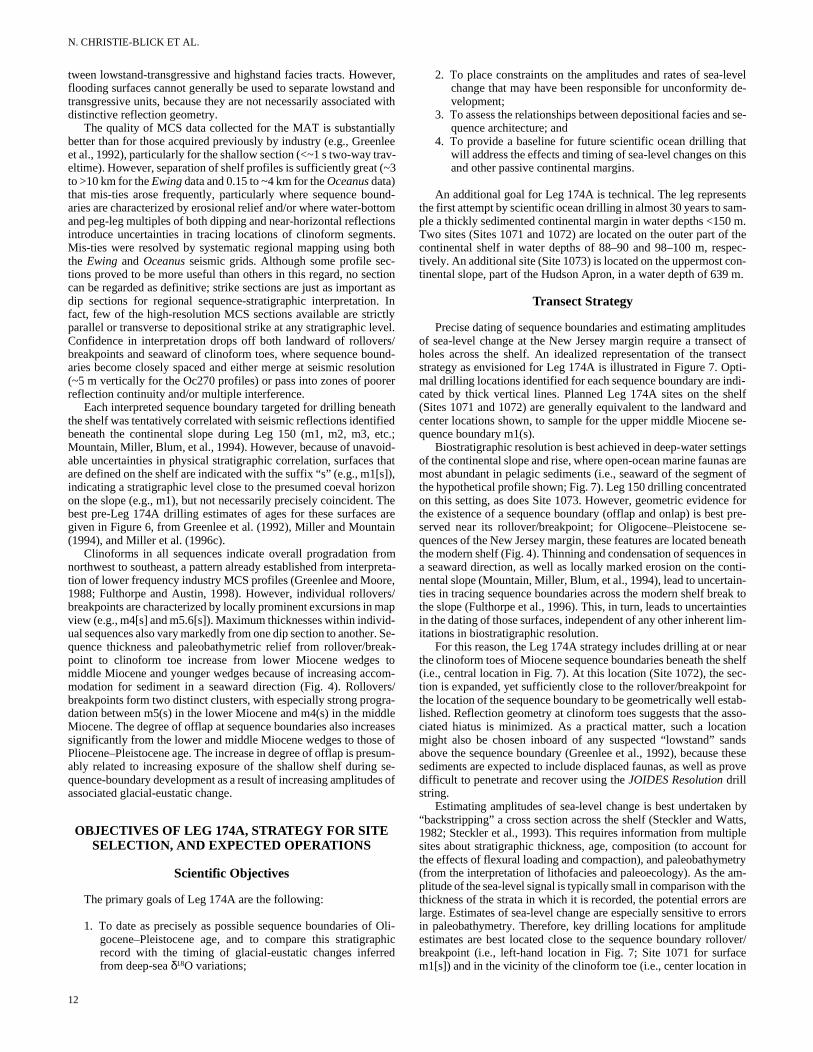
Precise dating of sequence boundaries and estimating amplituof sea-level change at the New Jersey margin require a transeholes across the shelf. An idealized representation of the transtrategy as envisioned for Leg 174A is illustrated in Figure 7. Opmal drilling locations identified for each sequence boundary are incated by thick vertical lines. Planned Leg 174A sites on the sh(Sites 1071 and 1072) are generally equivalent to the landward center locations shown, to sample for the upper middle Miocenequence boundary m1(s).
Biostratigraphic resolution is best achieved in deep-water settiof the continental slope and rise, where open-ocean marine faunamost abundant in pelagic sediments (i.e., seaward of the segmethe hypothetical profile shown; Fig. 7). Leg 150 drilling concentraton this setting, as does Site 1073. However, geometric evidencethe existence of a sequence boundary (offlap and onlap) is bestserved near its rollover/breakpoint; for Oligocene–Pleistocene quences of the New Jersey margin, these features are located bethe modern shelf (Fig. 4). Thinning and condensation of sequencea seaward direction, as well as locally marked erosion on the conental slope (Mountain, Miller, Blum, et al., 1994), lead to uncertaties in tracing sequence boundaries across the modern shelf brethe slope (Fulthorpe et al., 1996). This, in turn, leads to uncertainin the dating of those surfaces, independent of any other inherentitations in biostratigraphic resolution.
For this reason, the Leg 174A strategy includes drilling at or nthe clinoform toes of Miocene sequence boundaries beneath the (i.e., central location in Fig. 7). At this location (Site 1072), the setion is expanded, yet sufficiently close to the rollover/breakpoint the location of the sequence boundary to be geometrically well eslished. Reflection geometry at clinoform toes suggests that the aciated hiatus is minimized. As a practical matter, such a locatmight also be chosen inboard of any suspected “lowstand” saabove the sequence boundary (Greenlee et al., 1992), becausesediments are expected to include displaced faunas, as well as pdifficult to penetrate and recover using the JOIDES Resolution drillstring.
Estimating amplitudes of sea-level change is best undertaken“backstripping” a cross section across the shelf (Steckler and W1982; Steckler et al., 1993). This requires information from multipsites about stratigraphic thickness, age, composition (to accounthe effects of flexural loading and compaction), and paleobathyme(from the interpretation of lithofacies and paleoecology). As the aplitude of the sea-level signal is typically small in comparison with tthickness of the strata in which it is recorded, the potential errorslarge. Estimates of sea-level change are especially sensitive to ein paleobathymetry. Therefore, key drilling locations for amplitudestimates are best located close to the sequence boundary rollbreakpoint (i.e., left-hand location in Fig. 7; Site 1071 for surfam1[s]) and in the vicinity of the clinoform toe (i.e., center location
INTRODUCTION: A TEST OF SEQUENCE STRATIGRAPHY
PREFERRED DRILLING LOCATIONS
DISTANCE
Offlap
OFFLAP BREAK FOR SB2 DEEP MARINE SITE FOR SB2CLINOFORM TOE FOR SB2
HST
Lowstand fan
Offlap
Sequence 1
Onlap
TST
SB1
SB2
LST
HST
Sequence 2
Lowstand fan
SB3
SB3
DE
PT
H
Subaerial to marine hiatus
Interval of sedimentstarvation at clinoform toes
Interval of sedimentstarvation at clinoform toes
SB2
SB1
Oldest sediments above SB2
Youngest sediments below SB2
Increasingly condensed
Lowstand fan
GOOD
GOOD
Onlap
Offlap
GE
OL
OG
ICA
LT
IME
LANDWARD SEAWARD
Figure 7. Diagrams of depth and geological time vs. distance for idealized sequences and the optimal strategy for drilling them. The most seaward drill locationis most likely to recover a complete record across sequence boundary SB2, which is targeted to be m1(s) for Leg 174A, and contains biostratigraphic markersknown from the deep-sea record. This was the strategy used during Leg 150 and continued on Leg 174A at (backup) upper slope proposed site 13B (Site 1073;Fig. 2). The other two locations shown are designed to recover shallow-water facies across boundary SB2/m1(s), below the surface in the vicinity of the rollover/breakpoint (Site 1071) and above the surface in the vicinity of the clinoform toe (Site 1072). Such site pairing is the optimal way of obtaining information aboutboth age and amplitude of sea-level change, as well as about the relationship between stratal geometry and sedimentary facies. Note that this figure assumes theconceptual stratigraphic model of Greenlee et al. (1992) for the distribution of facies tracts within sequences, including a well-developed lowstand progradingwedge and a relatively thin transgressive facies tract landward of the rollover/breakpoint of the underlying sequence boundary.
h
1
f ai ereb
s (
ll-st
se-n-foreep-d Leg
dhas 7).dip98,onth
able
thetyi-ed to
Fig. 7; Site 1072 for m1[s]). Together, these locations are expected toprovide the most complete record of paleobathymetric change bothabove and below the targeted sequence boundary.
Although Leg 174A sites were approved for drilling to depths of>1 km, equivalent to deep-shelf deposits of Oligocene age, the pre-cruise operational strategy focused on the upper middle Miocenesequence boundary m1(s). That boundary was chosen because it iswell developed geometrically (Fig. 3) and accessible at intermedi-ate drilling depths (~300–550 mbsf) in an area of the outer swhere present-day water depths exceed 75 m. That water depthdetermined to be the shallowest in which the JOIDES Resolutionmight operate safely under optimal weather conditions. The msurface is also representative of the development of underlying mdle Miocene surfaces; in comparison, late Miocene–Pleistocenequence boundaries are characterized by increasing amounts olap, perhaps indicative of increasing amplitudes of glacial-eustchange through this interval. Finally, the m1(s) rollover/breakpois located close to the COST-B2 well (Scholle, 1977). LocationSite 1071 close to COST-B2, which was drilled safely, figurstrongly in JOIDES safety considerations for Leg 174A with spect to the possibility of encountering shallow biogenic gas neath this site.
Given the strategy and sequence-stratigraphic considerationscribed above, primary drilling locations were chosen as follows:
elf was
(s)id- se-off-ticntofd-e-
de-1)
within the MAT-8B grid (Site 1071; Fig. 5), close to the m1(s) roover/breakpoint (left-hand location in Fig. 7), to provide the mocomplete record of paleobathymetric change in the underlyingquence; (2) within the MAT-9B grid (Site 1072; Fig. 5), in the viciity of the corresponding clinoform toe (center location in Fig. 7), the most complete record of the overlying sequence; and (3) in dwater settings beneath the modern slope and rise (Site 1073 an150; right-hand location in Fig. 7).
The MAT ultimately requires drilling into the slope, shelf, ancoastal plain (Fig. 2); all are under way. Slope drilling by Leg 150 provided the “deep-water” age control (right hand location in Fig.Onshore drilling (Legs 150X/174AX and related) has supplied upfacies control at multiple locations (Miller et al., 1994, 1996a, 19in press; Miller and Sugarman, 1995) and is continuing. Drilling the intervening shelf, the primary focus of Leg 174A, is critical boto the calibration of sequence boundaries at geometrically favorsites and to the estimation of amplitudes of eustatic change.
Expected Operations
As described above, Sites 1071 and 1072 are located withinMAT-8B and 9B “hazards” grids to optimize sampling in the viciniof the rollover/breakpoint and clinoform toe of upper middle Mocene sequence boundary m1(s). These sites are also intend
13
N. CHRISTIE-BLICK ET AL.
d
t
a
l
t
o
gra-rsey
odol-asin,
enellingh-
.P.,ntal
gs, Newdel.
n oftrati-
.A.,
phic offata.
; a
ance
sea
s of.,
l.
oth-ndr-
.
phy:
rassic
ugh
ture,n.
for-ain.
s in
of aary-
on-
sample the updip and somewhat condensed shallow-water portions ofoverlying upper Miocene to Pliocene–Pleistocene sequences, andeeper water portions of underlying Oligocene to middle Miocene quences, time and hole conditions permitting. However, from outset, achieving stratigraphic precision was viewed as more imptant than reaching some preapproved target depth. Of vital imptance is the objective of tying seismic and various types of core log data as completely as possible without resorting to argumeabout seismic vs. sedimentary facies. This is necessary to test eing sequence-stratigraphic models (e.g., Greenlee et al., 1988, 1for the New Jersey margin, rather than simply to interpret new din the context of those models. In addition to optimizing core recoery in multiple holes, therefore, the operational plan includes acqsition of wireline logs (including Formation MicroScanner [FMSdata), logging while drilling (LWD), and a checkshot survey/verticseismic profile (VSP) at each site.
Site 1073 (MAT-13B) is one of four sites (MAT-13A through13D) designated as alternates on the uppermost slope (the so-cHudson Apron) adjacent to the outer New Jersey shelf. These anate sites were chosen in case of safety problems (e.g., inabilitmaintain dynamic positioning within stated limits), weather condtions too inclement for shallow-water operations, and/or other intrtable operating conditions in the shelf environment. These sitesdesigned to date Miocene to Pleistocene sequence boundaries, pularly an expanded section of Pleistocene age (Fig. 4), and to helpvelop a sequence interpretation for the Pleistocene in a setting cacterized by mass wasting and other marine processes that may bdependent of base-level changes on the shelf. The operational for these sites includes wireline logs, LWD, and a VSP.
REFERENCES
Barron, J., Larsen, B., and Baldauf, J.G., 1991. Evidence for late Eocene toearly Oligocene Antarctic glaciation and observations on late Neogeneglacial history of Antarctica: results from Leg 119. In Barron, J., Larsen,B., et al., Proc. ODP, Sci. Results, 119: College Station, TX (Ocean Drill-ing Program), 869–891.
Berg, O.R., and Woolverton, D.G. (Eds.), 1985. Seismic Stratigraphy II: AnIntegrated Approach to Hydrocarbon Exploration. AAPG Mem., 39.
Berggren, W.A., Kent, D.V., Swisher, C.C., III, and Aubry, M.-P., 1995. revised Cenozoic geochronology and chronostratigraphy. In Berggren,W.A., Kent, D.V., Aubry, M.-P., and Hardenbol, J. (Eds.), Geochronol-ogy, Time Scales and Global Stratigraphic Correlation. Spec. Publ.—SEPM (Soc. Sediment. Geol.), 54:129–212.
Browning, J.V., Miller, K.G., and Pak, D.K., 1996. Global implications olower to middle Eocene sequence boundaries on the New Jersey CoPlain—the Icehouse cometh. Geology, 24:639–642.
Burton, R., Kendall, C.G.St.C., and Lerche, I., 1987. Out of our depth: onimpossibility of fathoming eustasy from the stratigraphic record. Earth-Sci. Rev., 24:237–277.
Christie-Blick, N., 1991. Onlap, offlap, and the origin of unconformitybounded depositional sequences. Mar. Geol., 97:35–56.
Christie-Blick, N., and Driscoll, N.W., 1995. Sequence stratigraphy. Ann.Rev. Earth Planet. Sci., 23:451–478.
Christie-Blick, N., Miller, K.G., Mountain, G.S., Driscoll, N.W., ReynoldsD.J., and Steckler, M.S., 1992. Sequence stratigraphy and sea-change: examples from the Atlantic margins of the U.S. and CanadaThe Tectonics, Sedimentation and Palaeoceanography of the NorthAtlantic Region. Geol. Soc. London, Mar. Studies Group.
Christie-Blick, N., Mountain, G.S., and Miller, K.G., 1990. Seismic stragraphic record of sea-level change. In Sea-level Change: Washington(National Academy Press), 116–140.
COSOD II, 1987. Rep. 2nd Conf. Scientific Ocean Drilling: Washington/Strasbourg (JOIDES/European Sci. Found.).
Cross, T.A., and Lessenger, M.A., 1988. Seismic stratigraphy. Ann. Rev.Earth Planet. Sci., 16:319–354.
Eberli, G.P., and Ginsburg, R.N., 1989. Cenozoic progradation of the nwestern Great Bahamas Bank, a record of lateral platform growth andlevel fluctuations. In Crevello, P.D., Wilson, J.L., Sarg, J.F., and ReaJ.F. (Eds.), Controls on Carbonate Platform and Basin Development.Spec. Publ.—Soc. Econ. Paleontol. Mineral., 44:339–351.
14
these-heor-or-
andntsxist-992)atav-ui-]al
alledlter-y toi-c-
areartic- de-har-e in-plan
A
fastal
the
-
,evel. In
i-
rth sead,
Frakes, L.A., Francis, J.E., and Syktus, J.I., 1992. Climate Modes of thePhanerozoic: Cambridge (Cambridge Univ. Press).
Fulthorpe, C.S., and Austin, J.A., Jr., 1998. Anatomy of rapid margin prodation: three-dimensional geometries of Miocene clinoforms, New Jemargin. AAPG Bull., 82:251–273.
Fulthorpe, C.S., and Carter, R.M., 1989. Test of seismic sequence methogy on a Southern Hemisphere passive margin: the Canterbury BNew Zealand. Mar. Pet. Geol., 6:348–359.
Fulthorpe, C.S., Mountain, G.S., and Miller, K.G., 1996. Mapping Neogdepositional geometries, New Jersey continental slope, Leg 150 driarea. In Mountain, G.S., Miller, K.G., Blum, P., Poag, C.W., and Twicell, D.C. (Eds.), Proc. ODP, Sci. Results, 150: College Station, TX(Ocean Drilling Program), 269–281.
Goff, J.A., Schuur, C.L., Mayer, L., Hughes Clarke, J.E., and Swift, D.J1996. High-resolution bathymetric survey of the New Jersey continemargin: quantitative analysis of sand-ridge morphology. Eos, 77:329.
Greenlee, S.M., Devlin, W.J., Miller, K.G., Mountain, G.S., and FleminP.B., 1992. Integrated sequence stratigraphy of Neogene deposits,Jersey continental shelf and slope: comparison with the Exxon moGeol. Soc. Am. Bull., 104:1403–1411.
Greenlee, S.M., and Moore, T.C., 1988. Recognition and interpretatiodepositional sequences and calculation of sea-level changes from sgraphic data; offshore New Jersey and Alabama Tertiary. In Wilgus,C.K., Hastings, B.S., Kendall, C.G.St.C., Posamentier, H.W., Ross, Cand Van Wagoner, J.C. (Eds.), Sea-level Changes; an IntegratedApproach. Spec. Publ.—Soc. Econ. Paleontol. Mineral., 42:329–353.
Greenlee, S.M., Schroeder, F.W., and Vail, P.R., 1988. Seismic stratigraand geohistory analysis of Tertiary strata from the continental shelfNew Jersey; calculation of eustatic fluctuations from stratigraphic dIn Sheridan, R.E., and Grow, J.A. (Eds.), The Atlantic Continental Mar-gin. Geol. Soc. Am., Geol. North Am. Ser., I-2:437–444.
Grow, J.A., and Sheridan, R.E., 1988. U.S. Atlantic continental margintypical Atlantic-type or passive continental margin. In Sheridan, R.E.,and Grow, J.A. (Eds.), The Atlantic Continental Margin. Geol. Soc. Am.,Geol. North Am. Ser., I-2:1–7.
Haq, B.U., 1991. Sequence stratigraphy, sea-level change, and significfor the deep sea. In Macdonald, D.I.M. (Ed.), Sedimentation, Tectonicsand Eustasy: Sea-Level Changes at Active Margins. Spec. Publ. Int.Assoc. Sedimentol., 12:3–39.
Haq, B.U., Hardenbol, J., and Vail, P.R., 1987. Chronology of fluctuating levels since the Triassic. Science, 235:1156–1167.
————, 1988. Mesozoic and Cenozoic chronostratigraphy and cyclesea-level change. In Wilgus, C.K., Hastings, B.S., Kendall, C.G.St.CPosamentier, H.W., Ross, C.A., and Van Wagoner, J.C. (Eds.), Sea-levelChanges; an Integrated Approach. Spec. Publ.—Soc. Econ. PaleontoMineral., 42:72–108.
Hathaway, J.C., Schlee, J., Poag, C.W., Valentine, P.C., Weed, E.G.A., Bner, M.H., Kohout, F.A., Manheim, F.T., Schoen, R., Miller, R.E., aSchultz, D.M., 1976. Preliminary study of the 1976 Atlantic Margin Coing Project of the U.S. Geological Survey. Open-File Rep.—U.S. GeolSurv., 76–844.
Howell, J.A., and Aitken, J.F., 1996. High resolution sequence stratigrainnovations and applications. Geol. Soc. Spec. Publ. London, 104.
Hubbard, R.J., 1988. Age and significance of sequence boundaries on Juand early Cretaceous rifted continental margins. AAPG Bull., 72:49–72.
JOIDES Long Range Plan, 1996. Understanding our dynamic earth throocean drilling.
Jordan, T.E., and Flemings, P.B., 1991. Large-scale stratigraphic architeceustatic variation, and unsteady tectonism: a theoretical evaluatio J.Geophys. Res., 96:6681–6699.
Kidwell, S.M., 1984. Outcrop features and origin of basin margin unconmities in the Lower Chesapeake Group (Miocene), Atlantic coastal plIn Schlee, J.S. (Ed.), Interregional Unconformities and HydrocarbonAccumulation. AAPG Mem., 37:37–58.
————, 1988. Reciprocal sedimentation and noncorrelative hiatusemarine-paralic siliciclastics: Miocene outcrop evidence. Geology,16:609–612.
————, 1997. Anatomy of extremely thin marine sequences landward passive-margin hinge zone: Neogene Calvert Cliffs succession, Mland, U.S.A. J. Sediment. Res., 67:322–340.
Klitgord, K.D., Hutchinson, D.R., and Schouten, H., 1988. U.S. Atlantic ctinental margin; structural and tectonic framework. In Sheridan, R.E., andGrow, J.A. (Eds.), The Atlantic Continental Margin. Geol. Soc. Am.,Geol. North Am. Ser., I-2:19–53.
INTRODUCTION: A TEST OF SEQUENCE STRATIGRAPHY
m
o
C
n
,-
GLnr
Jlo
c
a
n-
6f
g
vy
.J.,DP
dep-.
li-atic
eous tec-
eno-ge
f the the
ation
se”
of
osi-
for
n inddle
dlesi-nd
y of
trati-,
s on
ag-
sedi- and
rm
Loucks, R.G., and Sarg, J.F. (Eds.), 1993. Carbonate Sequence Stratigraphy.AAPG Mem., 57.
Loutit, T.S., and Kennett, J.P., 1981. Australasian Cenozoic sedimentarycycles, global sea level changes and the deep sea sedimentary record.Oceanol. Acta, Spec. Publ., 45–63.
Miall, A.D., 1986. Eustatic sea level changes interpreted from seisstratigraphy: a critique of the methodology with particular referencethe North Sea Jurassic record. AAPG Bull., 70:131–137.
————, 1991. Stratigraphic sequences and their chronostratigraphic colation. J. Sediment. Petrol., 61:497–505.
————, 1992. Exxon global cycle chart: an event for every occasiGeology, 20:787–790.
————, 1994. Sequence stratigraphy and chronostratigraphy: problemdefinition and precision in correlation, and their implications for globeustasy. Geosci. Can., 21:1–26.
Miller, K.G., et al., 1994. Proc. ODP, Init. Repts., 150X: College Station, TX(Ocean Drilling Program).
————, 1996a. Proc. ODP, Init. Repts., 150X (Suppl.): College Station,TX (Ocean Drilling Program).
Miller, K.G., Feigenson, M.D., Wright, J.D., and Clement, B.M., 1991Miocene isotope reference section, Deep Sea Drilling Project Site 6an evaluation of isotope and biostratigraphic resolution. Paleoceanogra-phy, 6:33–52.
Miller, K.G., Liu, C., and Feigenson, M.D., 1996b. Oligocene to middMiocene Sr-isotopic stratigraphy of the New Jersey continental slopeInMountain, G.S., Miller, K.G., Blum, P., Poag, C.W., and Twichell, D.(Eds.), Proc. ODP, Sci. Results, 150: College Station, TX (Ocean DrillingProgram), 97–114.
Miller, K.G., Melillo, A.J., Mountain, G.S., Farre, J.A., and Poag, C.W1987. Middle to late Miocene canyon cutting on the New Jersey conental slope: biostratigraphic and seismic stratigraphic evidence. Geol-ogy, 15:509–512.
Miller, K.G., and Mountain, G.S., 1994. Global sea-level change and New Jersey margin. In Mountain, G.S., Miller, K.G., Blum, P., et al.Proc. ODP, Init. Repts., 150: College Station, TX (Ocean Drilling Program), 11–20.
Miller, K.G., Mountain, G.S., Blum, P., Gartner, S., Alm Per, G., Aubry, MP., Burckle, L.H., Guerin, G., Katz, M.E., Christensen, B.A., ComptoJ., Damuth, J.E., Deconinck, J.F., de Verteuil, L., Fulthorpe, C.S., Hselbo, S.P., Hoppie, B.W., Kotake, N., Lorenzo, J.M., McCracken, McHugh, C.M., Quayle, W.C., Saito, Y., Snyder, S.W., ten Kate, W.Urbat, M., Van Fossen, M.C., Vecsei, A., Sugarman, P.J., Mullikin, Pekar, S., Browning, J.V., Liu, C., Feigenson, M.D., Goss, M., GwyD., Queen, D.G., Powars, D.S., Heibel, T.D., and Bukry, D., 1996c. Ding and dating New Jersey Oligocene-Miocene sequences: ice voluglobal sea level, and Exxon records. Science, 271:1092–1095.
Miller, K.G., Mountain, G.S., Browning, J.V., Kominz, M., Sugarman, P.Christie-Blick, N., Katz, M.E., and Wright, J.D., in press. Cenozoic gbal sea level, sequences, and the New Jersey Transect: resultscoastal plain and continental slope drilling. Rev. Geophys.
Miller, K.G., and Sugarman, P.J., 1995. Correlating Miocene sequenceonshore New Jersey boreholes (ODP Leg 150X) with global δ18O andMaryland outcrops. Geology, 23:747–750.
Miller, K.G., Sugarman, P.J., Browning, J.V., et al., 1998. Proc. ODP, Init.Repts, 174AX: College Station, TX (Ocean Drilling Program).
Miller, K.G., Wright, J.D., and Fairbanks, R.G., 1991b. Unlocking the IHouse: Oligocene-Miocene oxygen isotopes, eustasy, and margin sion. J. Geophys. Res., 96:6829–6848.
Mitchum, R.M., Jr., 1977. Seismic stratigraphy and global changes oflevel, Part 11. Glossary of terms used in seismic stratigraphy. In Payton,C.E. (Ed.), Seismic Stratigraphy—Applications to Hydrocarbon Explortion. AAPG Mem., 26:205–212.
Mitchum, R.M., Jr., and Van Wagoner, J.C., 1991. High-frequency sequeand their stacking patterns: sequence-stratigraphic evidence of highquency eustatic cycles. Sediment. Geol., 70:131–160.
Mountain, G.S., Miller, K.G., Blum, P., et al., 1994. Proc. ODP, Init. Repts.,150: College Station, TX (Ocean Drilling Program).
Mountain, G.S., Miller, K.G., Christie-Blick, N., and Austin, J.A., Jr., 199Ages and architecture of Neogene sequences, New Jersey shelslope: ODP Legs 150 and 174A. Eos, 77:S162.
Nittrouer, C.A., and Kravitz, J.H., 1995. Integrated continental marresearch to benefit ocean and earth sciences. Eos, 76:121.
Olsson, R.K., Melillo, A.J., and Schreiber, B.L., 1987. Miocene sea leevents in the Maryland Coastal Plain and the offshore Baltimore Can
icto
rre-
n.
s ofal
a.08:
le. .
.,ti-
the
.-n,es-S.,.,.,n,ill-me,
.,-
from
s in
eero-
sea
-
cesfre-
.and
in
elon
Trough. In Ross, C.A., and Haman, D. (Eds.), Timing and DepositionalHistory of Eustatic Sequences: Constraints on Seismic Stratigraphy.Spec. Publ. Cushman Found. Foraminiferal Res., 24:85–97.
Olsson, R.K., Miller, K.G., Browning, J.V., Habib, D., and Sugarman, P1997. Ejecta layer at the K/T boundary, Bass River, New Jersey (OLeg 174AX). Geology, 25:759–762.
Olsson, R.K., and Wise, S.W., 1987. Upper Paleocene to middle Eoceneositional sequences and hiatuses in the New Jersey Atlantic MarginInRoss, C.A., and Haman, D. (Eds.), Timing and Depositional History ofEustatic Sequences: Constraints on Seismic Stratigraphy. Spec. Publ.Cushman Found. Foraminiferal Res., 24:99–112.
Oslick, J.S., Miller, K.G., Feigenson, M.D., and Wright, J.D., 1994. Ogocene-Miocene strontium isotopes: correlation to a glacioeustrecord. Paleoceanography, 9:427–443.
Owens, J.P., and Gohn, G.S., 1985. Depositional history of the Cretacseries in the U.S. coastal plain: stratigraphy, paleoenvironments, andtonic controls of sedimentation. In Poag, C.W. (Ed.), Geologic Evolutionof the United States Atlantic Margin: New York (Van Nostrand Rein-hold), 25–86.
Pazzaglia, F.J., 1993. Stratigraphy, petrography, and correlation of late Czoic middle Atlantic Coastal Plain deposits: implications for late-stapassive-margin geologic evolution. Geol. Soc. Am. Bull., 105:1617–1634.
Pazzaglia, F.J., and Brandon, M.T., 1996. Macrogeomorphic evolution opost-Triassic Appalachian Mountains determined by deconvolution ofoffshore basin sedimentary record. Basin Res., 8:255–278.
Pazzaglia, F.J., and Gardner, T.W., 1994. Late Cenozoic flexural deformof the middle U. S. Atlantic passive margin. J. Geophys. Res., 99:12143–12157.
Pekar, S.F., and Miller, K.G., 1996. New Jersey Oligocene “Icehousequences (ODP Leg 150X) correlated with global δ18O and Exxoneustatic records. Geology, 24:567–570.
Poag, C.W., 1977. Foraminiferal biostratigraphy. In Scholle, P.A. (Ed.), Geo-logical Studies on the COST No. B-2 Well, U.S. Mid-Atlantic Outer Con-tinental Shelf Area. Geol. Surv. Circ. U.S., 750:35–36.
————, 1978. Stratigraphy of the Atlantic continental shelf and slopethe United States. Annu. Rev. Earth Planet. Sci., 6:251–280.
————, 1980. Foraminiferal stratigraphy, paleoenvironments, and deptional cycles in the outer Baltimore Canyon Trough. In Scholle, P.A.(Ed.), Geological Studies of the COST No. B-3 Well, United States Mid-Atlantic Continental Slope Area. Geol. Surv. Circ. (U.S.), 833:44–65.
————, 1985. Depositional history and stratigraphic reference sectioncentral Baltimore Canyon trough. In Poag, C.W. (Ed.), Geologic Evolu-tion of the United States Atlantic Margin: New York (Van Nostrand Rein-hold), 217–264.
Poag, C.W., and Sevon, W.D., 1989. A record of Appalachian denudatiopostrift Mesozoic and Cenozoic sedimentary deposits of the U.S. miAtlantic continental margin. Geomorphology, 2:119–157.
Poag, C.W., and Ward, L.W., 1993. Allostratigraphy of the U.S. midAtlantic continental margin—characteristics, distribution, and depotional history of principal unconformity-bounded Upper Cretaceous aCenozoic sedimentary units. Geol. Surv. Prof. Pap. U.S., 1542.
Poag, C.W., Watts, A.B., et al., 1987. Init. Repts. DSDP, 95: Washington(U.S. Govt. Printing Office).
Poore, R.Z., and Bybell, L.M., 1988. Eocene to Miocene biostratigraphNew Jersey core ACGS#4: implications for regional stratigraphy. U.S.Geol. Surv., 1829:1–22
Posamentier, H.W., and James, D.P., 1993. An overview of sequence-sgraphic concepts: uses and abuses. In Posamentier, H.W., SummerhayesC.P., Haq, B.U., and Allen, G.P. (Eds.), Sequence Stratigraphy andFacies Associations. Spec. Publ. Int. Assoc. Sedimentol., 18:3–18.
Posamentier, H.W., Jervey, M.T., and Vail, P.R., 1988. Eustatic controlclastic deposition, I. Conceptual framework. In Wilgus, C.K., Hastings,B.S., Kendall, C.G.St.C., Posamentier, H.W., Ross, C.A., and Van Woner, J.C. (Eds.), Sea-level Changes; an Integrated Approach. Spec.Publ.—Soc. Econ. Paleontol. Mineral., 42:109–124.
Reynolds, D.J., Steckler, M.S., and Coakley, B.J., 1991. The role of the ment load in sequence stratigraphy: the influence of flexural isostasycompaction. J. Geophys. Res., 96:6931–6949.
Ryan, W.B.F., and Miller, E.L., 1981. Evidence of a carbonate platfobeneath Georges Bank. Mar. Geol., 44:213–228.
Sawyer, D.S. (Ed.), 1996. The Margins Initiative. Initial Science Plan, JointOceanogr. Inst., Inc.
Schlee, J.S., 1981. Seismic stratigraphy of Baltimore Canyon Trough. AAPGBull., 65:26–53.
15
N. CHRISTIE-BLICK ET AL.
o
gi
,
v
tm
e
In
t
s
,
.
tiary.
ties, and
III,phy
arine.
D.,
f sea
ho-
conti-
Scholle, P.A. (Ed.), 1977. Geological studies on the COST No. B-2 well,U.S. mid-Atlantic outer continental shelf area. Geol. Surv. Circ. (U.S.),750.
Sea Level Working Group Report, 1992. JOIDES J., 18:28–36.Sedimentary and Geochemical Processes Panel White Paper, 1994. JOIDES
J., 20:41–48.Sheridan, R.E., Gradstein, F.M., et al., 1983. Init. Repts. DSDP, 76: Washing-
ton (U.S. Govt. Printing Office). Sheridan, R.E., Musser, D.L., Glover, L., III, Talwani, M., Ewing, J.I., H
brook, W.S., Purdy, G.M., Hawman, R., and Smithson, S., 1993. Dseismic reflection data of EDGE U.S. mid-Atlantic continental-marexperiment: implications for Appalachian sutures and Mesozoic riftand magmatic underplating. Geology, 21:563-567.
Sloss, L.L., 1988. Forty years of sequence stratigraphy. Geol. Soc. Am. Bull.,100:1661–1665.
Steckler, M.S., Reynolds, D.J., Coakley, B.J., Swift, B.A., and Jarrard1993. Modelling passive margin sequence stratigraphy. In Posamentier,H.W., Summerhayes, C.P., Haq, B.U., and Allen, G.P. (Eds.), SequenceStratigraphy and Facies Associations. Spec. Publ. Int. Assoc. Sedimentol., 18:19–41.
Steckler, M.S., and Watts, A.B., 1982. Subsidence history and tectonic etion of Atlantic-type continental margins. In Scrutton, R.A. (Ed.),Dynamics of Passive Margins. AGU Geodyn. Ser., 6:184–196.
Stoll, H.M., and Schrag, D.P., 1996. Evidence for glacial control of rapidlevel changes in the Early Cretaceous. Science, 272:1771–1774.
Sugarman, P.J., Miller, K.G., Owens, J.P., and Feigenson, M.D., 1993. Stium-isotope and sequence stratigraphy of the Miocene Kirkwood Fortion, southern New Jersey. Geol. Soc. Am. Bull., 105:423–436.
Thorne, J.A., and Watts, A.B., 1984. Seismic reflectors and unconformitipassive continental margins. Nature, 311:365–368.
Underhill, J.R., 1991. Controls on Late Jurassic seismic sequences, Moray Firth, UK North Sea: a critical test of a key segment of Exxooriginal global cycle chart. Basin Res., 3:79–98.
Vail, P.R., 1987. Seismic stratigraphy interpretation using sequence straphy, Part 1. Seismic stratigraphy interpretation procedure. In Bally, A.W.(Ed.), Atlas of Seismic Stratigraphy (Vol. 1). AAPG Stud. Geol., 27:1–10.
————, 1992. The evolution of seismic stratigraphy and the global level curve. In Dott, R.H., Jr. (Ed.), Eustasy: The Historical Ups andDowns of a Major Geological Concept. Mem.—Geol. Soc. Am., 180:83–91.
Vail, P.R., Audemard, F., Bowman, S.A., Eisner, P.N., and Perez-Cruz1991. The stratigraphic signatures of tectonics, eustasy, and sedimeogy—an overview. In Einsele, G., Ricken, W., and Seilacher, A. (EdsCycles and Events in Stratigraphy: Berlin (Springer), 617–659.
16
l-eepinng
R.,
-
olu-
sea
ron-a-
s at
nner's
igra-
ea
G.,ntol-),
Vail, P.R., and Hardenbol, J., 1979. Sea-level changes during the TerOceanus, 22:71–79.
Vail, P.R., Hardenbol, J., and Todd, R.G., 1984. Jurassic unconformichronostratigraphy, and sea-level changes from seismic stratigraphybiostratigraphy. In Schlee, J.S. (Ed.), Interregional Unconformities andHydrocarbon Accumulation. AAPG Mem., 36:129–144.
Vail, P.R., Mitchum, R.M., Jr., Todd, R.G., Widmier, J.M., Thompson, S., Sangree, J.B., Bubb, J.N., and Hatlelid, W.G., 1977. Seismic stratigraand global changes of sea level. In Payton, C.E. (Ed.), Seismic Stratigra-phy—Applications to Hydrocarbon Exploration. AAPG Mem., 26:49–212.
van Hinte, J.E., Wise, S.W., Jr., et al., 1987. Init. Repts. DSDP, 93: Washing-ton (U.S. Govt. Printing Office).
Van Wagoner, J.C., 1995. Sequence stratigraphy and marine to nonmfacies architecture of foreland basin strata, Book Cliffs, Utah, U.S.AInVan Wagoner, J.C., and Bertram, G.T. (Eds.), Sequence Stratigraphy ofForeland Basin Deposits: Outcrop and Subsurface Examples from theCretaceous of North America. AAPG Mem., 64:137-223.
Van Wagoner, J.C., Mitchum, R.M., Campion, K.M., and Rahmanian, V.1990. Siliciclastic Sequence Stratigraphy in Well Logs, Cores, and Out-crops: Concepts for High-Resolution Correlation of Time and Facies.AAPG Methods Explor. Ser., 7.
Watkins, J.S., and Mountain, G.S. (Eds.), 1990. Role of ODP Drilling in theInvestigation of Global Changes in Sea Level. Rep. JOI/USSAC Work-shop, El Paso, TX, Oct. 24–26, 1988.
Watts, A.B., 1982. Tectonic subsidence, flexure and global changes olevel. Nature, 297:469–474.
————, 1988.Gravity anomalies, crustal structure and flexure of the litsphere at the Baltimore Canyon trough. Earth Planet. Sci. Lett., 89:221–238.
Watts, A.B., and Steckler, M.S., 1979. Subsidence and eustasy at the nental margin of eastern North America. In Talwani, M., Hay, W., andRyan, W.B.F. (Eds.), Deep Drilling Results in the Atlantic Ocean: Conti-nental Margins and Paleoenvironment. Am. Geophys. Union, MauriceEwing Ser., 3:218–234.
Weimer, P., and Posamentier, H.W. (Eds.), 1993. Siliciclastic SequenceStratigraphy: Recent Developments and Applications. AAPG Mem., 58.
Ms 174AIR-101