Embed Size (px)
Citation preview
1
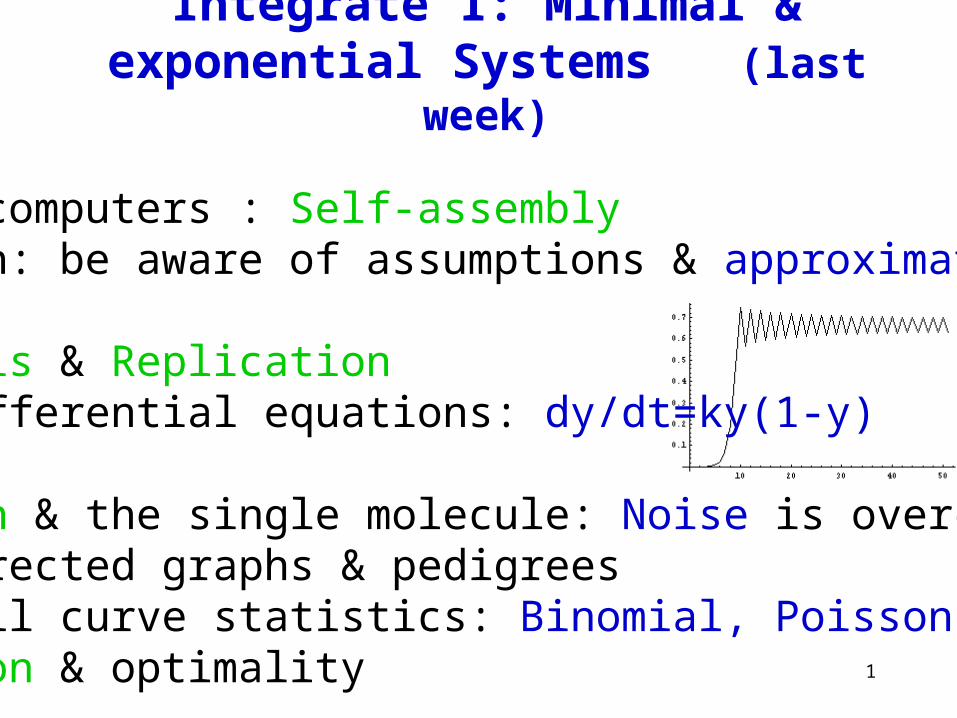
Integrate 1: Minimal & exponential Systems (last week)
Life & computers : Self-assembly Math: be aware of assumptions & approximations
Catalysis & Replication Differential equations: dy/dt=ky(1-y)
Mutation & the single molecule: Noise is overcome Directed graphs & pedigrees Bell curve statistics: Binomial, Poisson, NormalSelection & optimality
2
Integrate 1: Minimal & exponential Systems (last week)
Big questions: How can we define (& design) “General biology” (self-replicating systems)?
How soon might the exponential of IT and/or Biotech overtake human intelligence?
DNA single molecule stochastics is a given. How does life reduce the noise by dozens of logs?
3
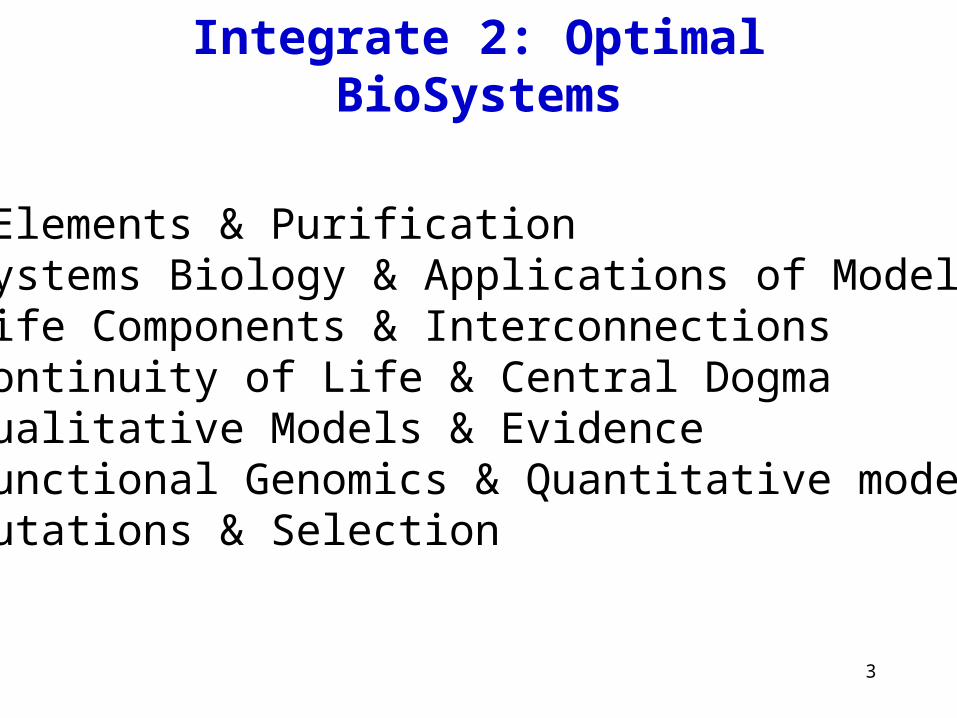
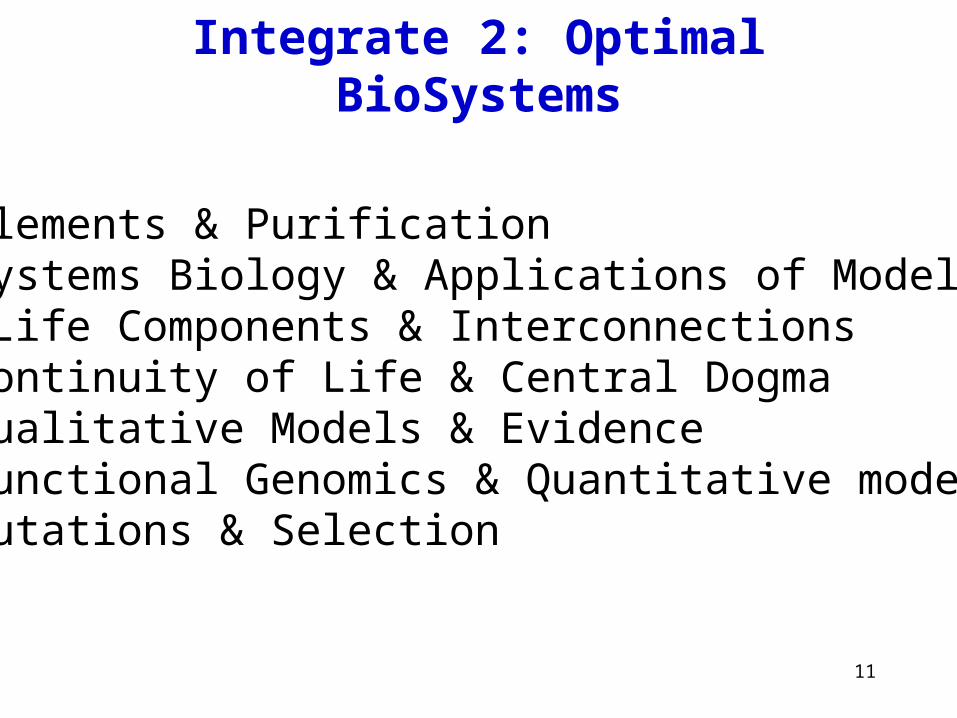
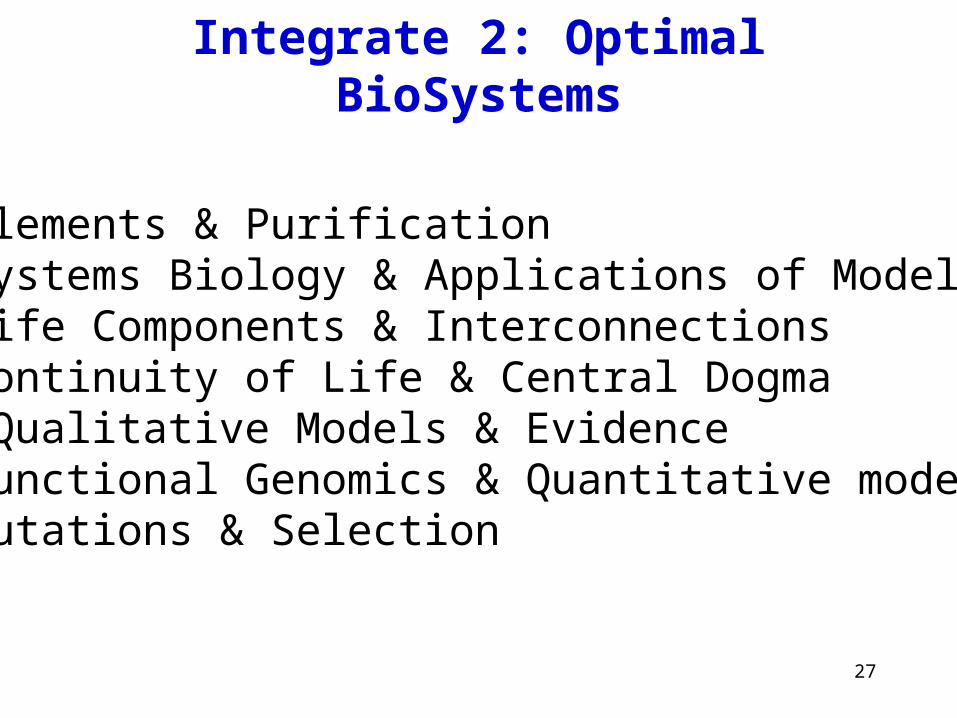
Integrate 2: Optimal BioSystems
•Elements & PurificationSystems Biology & Applications of ModelsLife Components & InterconnectionsContinuity of Life & Central DogmaQualitative Models & EvidenceFunctional Genomics & Quantitative modelsMutations & Selection

4
From atoms to (bio)molecules
H2O H2 , O2 H+ , OH-
CH4 C60 CO3-
NH3 N2 NO3-
H2S Sn SO4-- Mg++
PH3 K+PO4-- Na+
Gas Elemental Salt
5
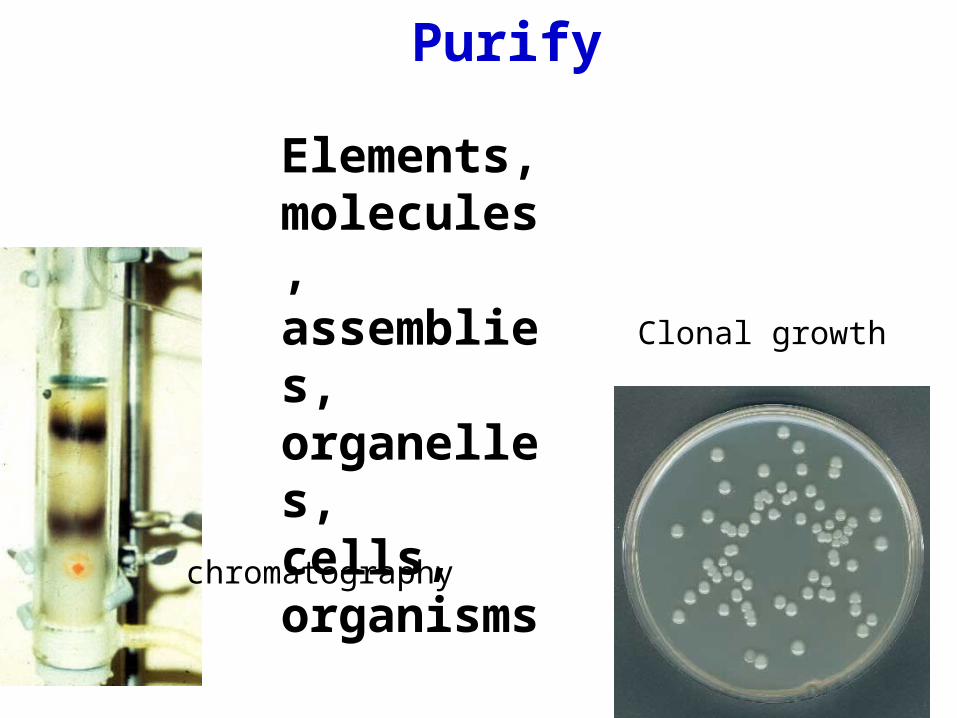
Purify
Elements, molecules, assemblies, organelles, cells, organisms
chromatography
Clonal growth

6
Pre 1970s: Column/gel purification revolution
Mid-1970s: Recombinant DNA brings clonal (single-step) purity.
1984-2002: Sequencing genomes & automation aids return to whole systems.
Purified history
7
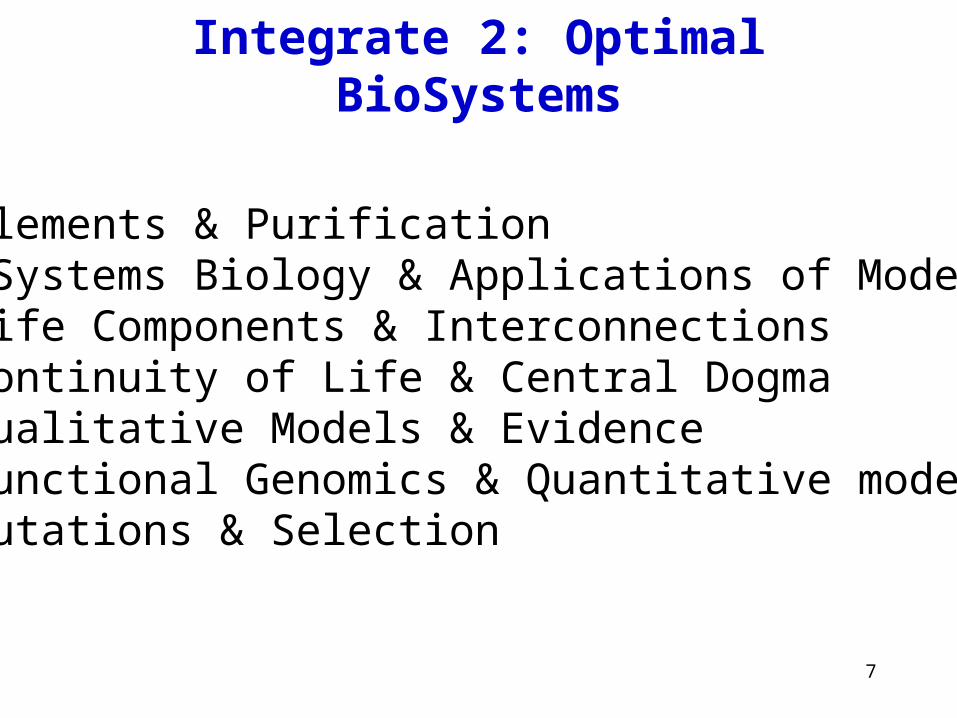
Integrate 2: Optimal BioSystems
Elements & Purification•Systems Biology & Applications of ModelsLife Components & InterconnectionsContinuity of Life & Central DogmaQualitative Models & EvidenceFunctional Genomics & Quantitative modelsMutations & Selection
8
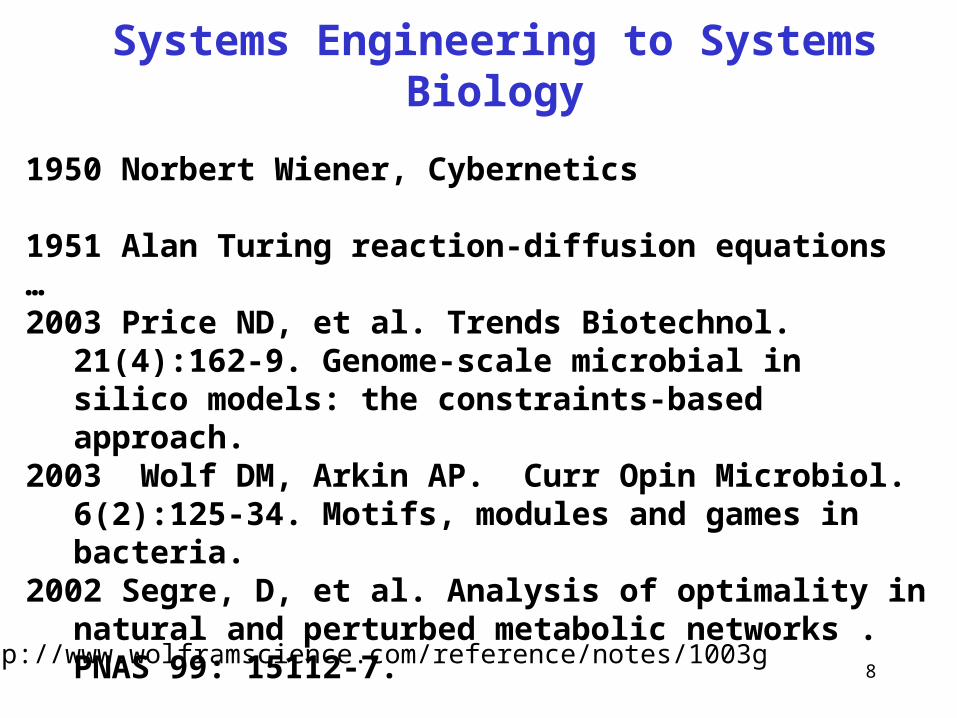
Systems Engineering to Systems Biology
1950 Norbert Wiener, Cybernetics
1951 Alan Turing reaction-diffusion equations…2003 Price ND, et al. Trends Biotechnol.
21(4):162-9. Genome-scale microbial in silico models: the constraints-based approach.
2003 Wolf DM, Arkin AP. Curr Opin Microbiol. 6(2):125-34. Motifs, modules and games in bacteria.
2002 Segre, D, et al. Analysis of optimality in natural and perturbed metabolic networks . PNAS 99: 15112-7.
http://www.wolframscience.com/reference/notes/1003g

9
Why Genomes & Systems?#0. Why sequence the genome(s)? To allow #1,2,3 below.
#1. Why map variation? #2. Why obtain a complete set of human RNAs, proteins & regulatory elements?#3. Why understand comparative genomics and how genomes evolved? To allow #4 below.
#4. Why quantitative biosystem models of molecular interactions with multiple levels (atoms to cells to organisms & populations)?To share information. Construction is a test of understanding & to make useful products.

10
Grand (& useful) Challenges A) From atoms to evolving minigenome-cells.• Improve in vitro macromolecular synthesis. • Conceptually link atomic (mutational) changes to population evolution (via molecular & systems modeling). • Novel polymers for smart-materials, mirror-enzymes & drug selection. B) From cells to tissues.• Model combinations of external signals & genome-programming on expression.• Manipulate stem-cell fate & stability. • Engineer reduction of mutation & cancerous proliferation. • Programmed cells to replace or augment (low toxicity) drugs. C) From tissues to physio- & eco- systems• Programming of cell and tissue morphology. • Quantitate robustness & evolvability.• Engineer sensor-effector feedback networks where macro-morphologies determine the functions; past (Darwinian) or future (prosthetic).
11
Integrate 2: Optimal BioSystems
Elements & PurificationSystems Biology & Applications of Models•Life Components & InterconnectionsContinuity of Life & Central DogmaQualitative Models & EvidenceFunctional Genomics & Quantitative modelsMutations & Selection

12
Number of component types (guesses)
M.gen Worm HumanBases .58M >97M 3000MDNAs 1 7 25Genes .48k 19k 21kRNAs .4k >30k .2-3MProteins .6k >50k .3-10MCells 1 959 1014
http://www.nature.com/cgi-taf/DynaPage.taf?file=/nature/journal/v409/n6822/full/409860a0_fs.htmlhttp://www.bio-itworld.com/news/071503_report2902.html
13
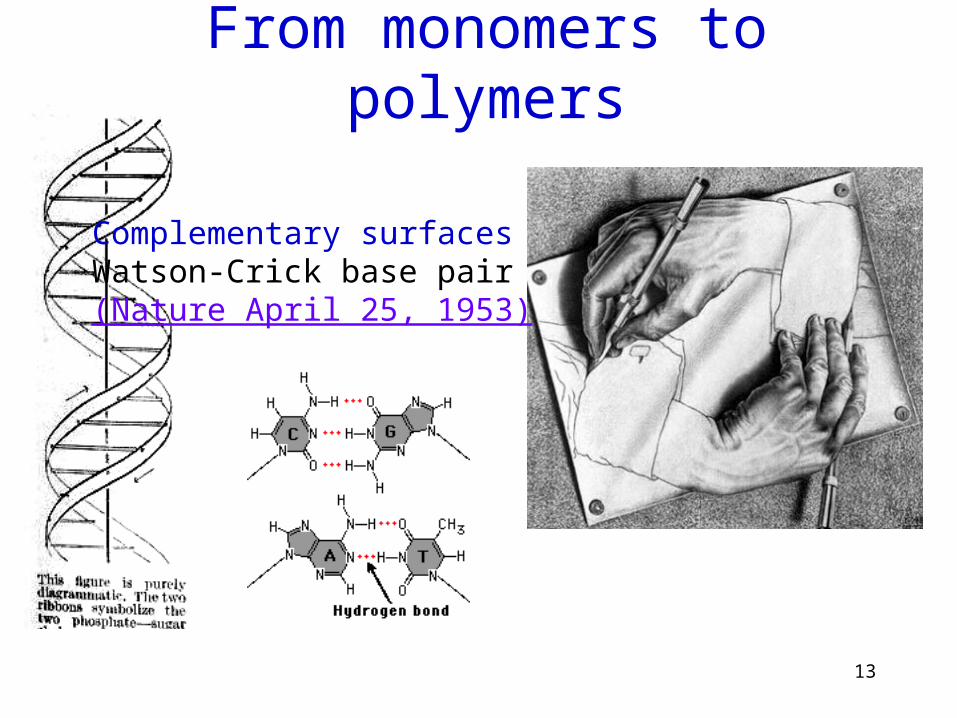
From monomers to polymers
Complementary surfacesWatson-Crick base pair (Nature April 25, 1953)
14
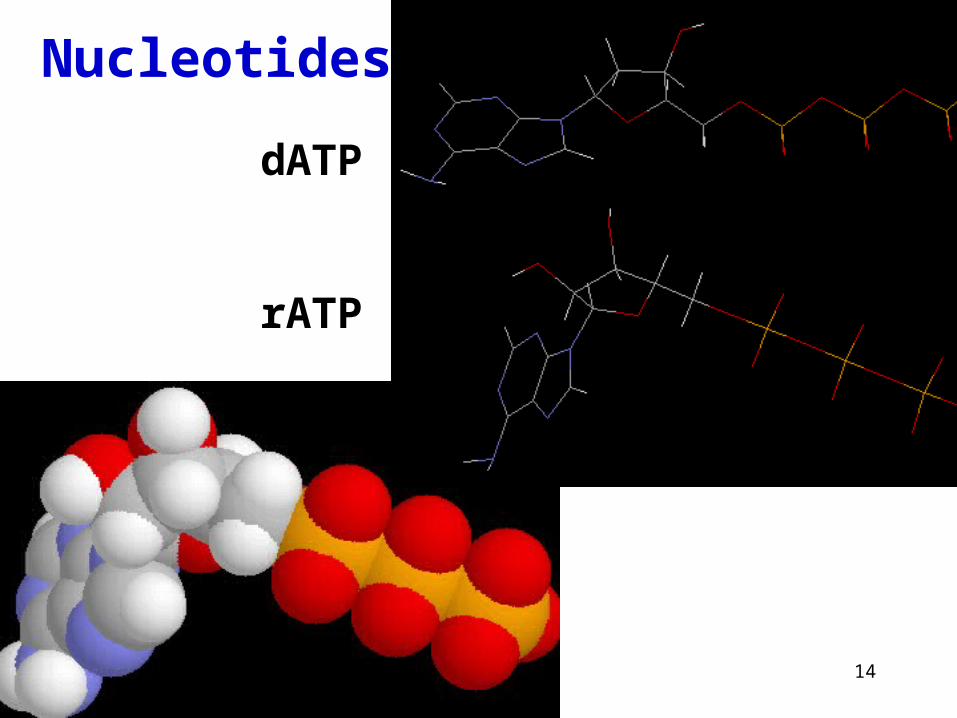
dATP
rATP
Nucleotides

15
GlycineGlyG
The simplest amino acid component of proteins
config(glycine,[ substituent(aminoacid_L_backbone), substituent(hyd), linkage(from(aminoacid_L_backbone,car(1)), to(hyd,hyd(1)), nil,single)]).
Smiles String: [CH2]([NH3+])[C](=[O])[O-]
Klotho
16
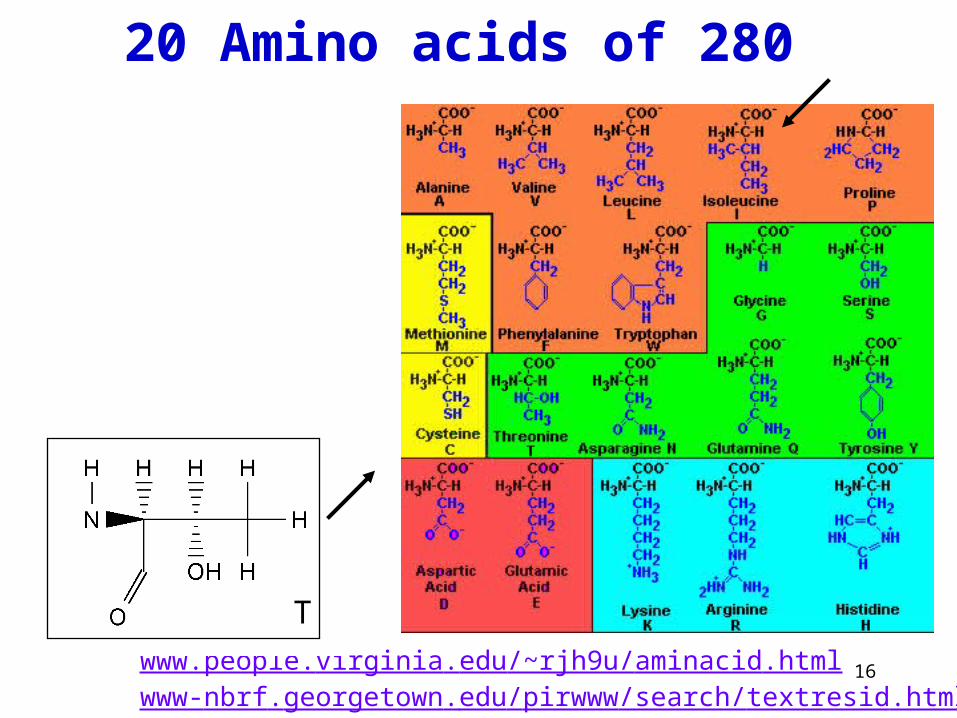
20 Amino acids of 280
www.people.virginia.edu/~rjh9u/aminacid.htmlwww-nbrf.georgetown.edu/pirwww/search/textresid.html
T
17
Integrate 2: Optimal BioSystems
Elements & PurificationSystems Biology & Applications of ModelsLife Components & Interconnections•Continuity of Life & Central DogmaQualitative Models & EvidenceFunctional Genomics & Quantitative modelsMutations & Selection
18
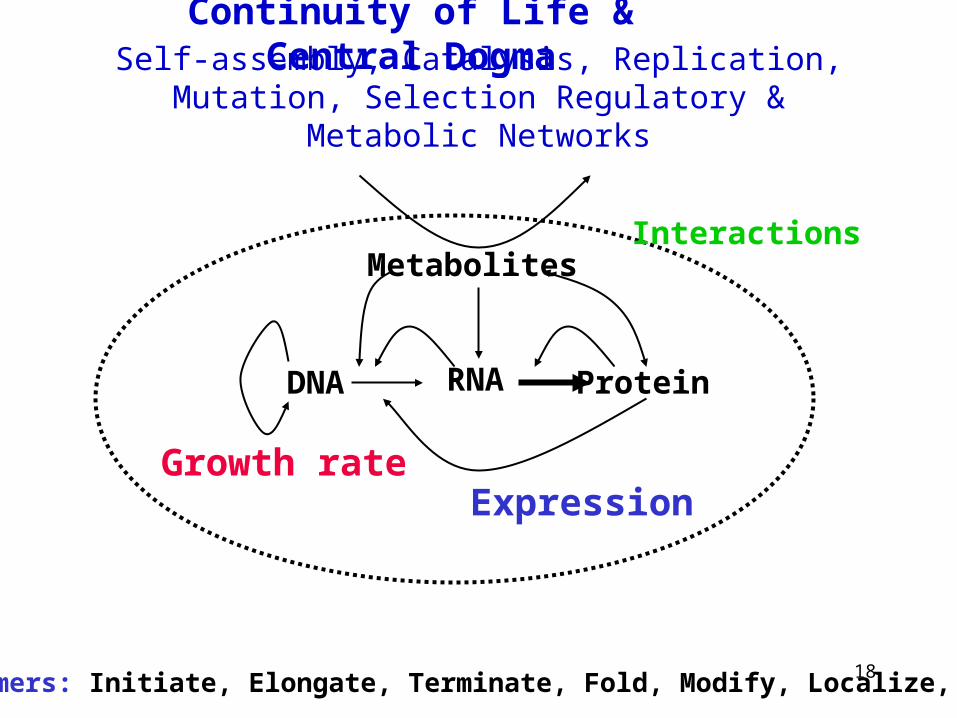
Continuity of Life & Central Dogma
RNA
Metabolites
DNA Protein
Growth rateExpression
Interactions
Polymers: Initiate, Elongate, Terminate, Fold, Modify, Localize, Degrade
Self-assembly, Catalysis, Replication, Mutation, Selection Regulatory & Metabolic Networks

19
"The" Genetic Code
x= u c a g
Uxu F Y Cuxc Suxa - - TERuxg - WCxu L Hcxc P Rcxa Qcxg
axu N Saxc I T C-Saxa K Raxg M NH+
gxu Dgxc V A G O-gxa Egxg H:D/A
M
Adjacent mRNA codons
F
3’ uac 5'... aug
3’aag uuu ...
‘Silent’ codon changes

20
Translationt-,m-,r-RNA
Ban N, et al. 1999 Nature. 400:841-7.
Large macromolecular complexes:Ribosome: 3 RNAs (over 3 kbp plus over 50 different proteins)
Science (2000) 289: 878, 905, 920, 3D coordinates.The ribosome is a ribozyme.

22
Continuity & Diversity of life
http://www.colorado.edu/epob/epob1030cornwall/fall_2001/Evolution_of_Life.gif
23
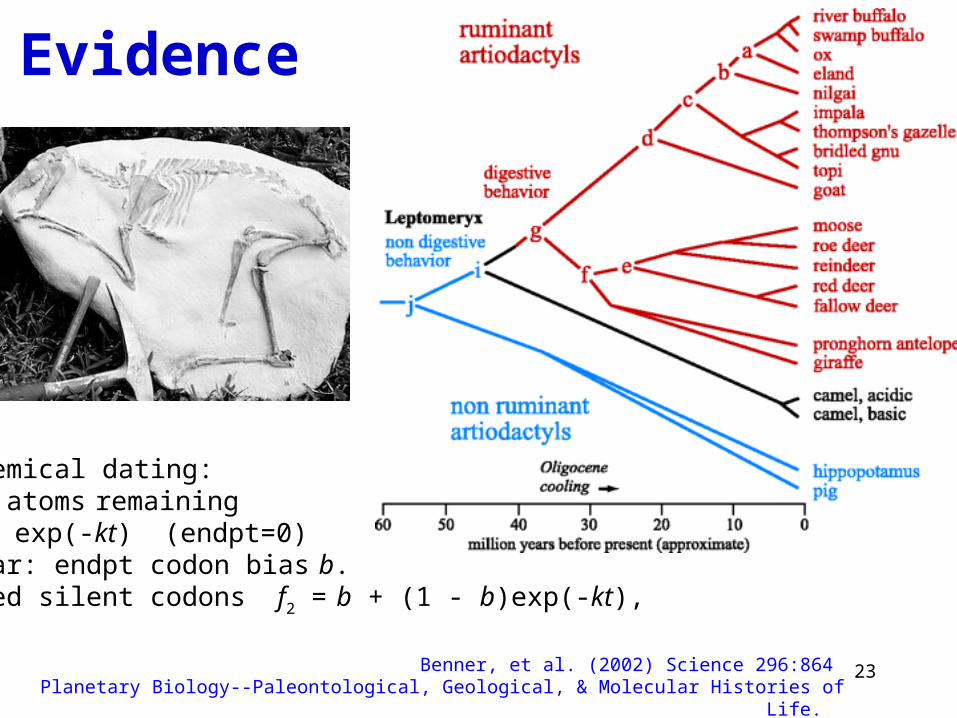
Evidence
Benner, et al. (2002) Science 296:864 Planetary Biology--Paleontological, Geological, & Molecular Histories of Life.
Radiochemical dating:Initial atoms remaining f = 1 - exp(-kt) (endpt=0)Molecular: endpt codon bias b. Conserved silent codons f2 =
b + (1 - b)exp(-kt),

24
How many living species?
5000 bacterial species per gram of soil (<70% DNA bp identity)Millions of non-microbial species (& dropping)Whole genomes: 100 done since 1995, 700 in the pipeline! (ref)Sequence any: 16234 (in 1995) to 79961 species (in 2000) NCBI
& Why study more than one species?Comparisons allow discrimination of subtle functional constraints.

25
1. "Standard Code"Base1 = TTTTTTTTTTTTTTTTCCCCCCCCCCCCCCCCAAAAAAAAAAAAAAAAGGGGGGGGGGGGGGGGBase2 = TTTTCCCCAAAAGGGGTTTTCCCCAAAAGGGGTTTTCCCCAAAAGGGGTTTTCCCCAAAAGGGGBase3 = TCAGTCAGTCAGTCAGTCAGTCAGTCAGTCAGTCAGTCAGTCAGTCAGTCAGTCAGTCAGTCAG AAs = FFLLSSSSYY**CC*WLLLLPPPPHHQQRRRRIIIMTTTTNNKKSSRRVVVVAAAADDEEGGGG
Genetic codes (ncbi)
Starts = ---M---------------M---------------M----------------------------2. The Vertebrate Mitochondrial Code AAs = FFLLSSSSYY**CCWWLLLLPPPPHHQQRRRRIIMMTTTTNNKKSS**VVVVAAAADDEEGGGGStarts = --------------------------------MMMM---------------M------------3. The Yeast Mitochondrial Code AAs = FFLLSSSSYY**CCWWTTTTPPPPHHQQRRRRIIMMTTTTNNKKSSRRVVVVAAAADDEEGGGGStarts = ----------------------------------MM----------------------------11. The Bacterial "Code" AAs = FFLLSSSSYY**CC*WLLLLPPPPHHQQRRRRIIIMTTTTNNKKSSRRVVVVAAAADDEEGGGGStarts = ---M---------------M------------MMMM---------------M------------14. The Flatworm Mitochondrial Code AAs = FFLLSSSSYYY*CCWWLLLLPPPPHHQQRRRRIIIMTTTTNNNKSSSSVVVVAAAADDEEGGGGStarts = -----------------------------------M----------------------------22. Scenedesmus obliquus mitochondrial Code AAs = FFLLSS*SYY*LCC*WLLLLPPPPHHQQRRRRIIIMTTTTNNKKSSRRVVVVAAAADDEEGGGGStarts = -----------------------------------M----------------------------

26
Gesteland, R. F. and J. F. Atkins. 1996. Recoding - Dynamic reprogramming of translation (1996). Ann. Rev.Biochem 65:741-768
Herbst KL, et al. 1994 PNAS 91:12525-9 A mutation in ribosomal protein L9 affects ribosomal hopping during translation of gene 60 from bacteriophage T4."Ribosomes hop over a 50-nt coding gap during translation..."
Translational reprogramming
27
Integrate 2: Optimal BioSystems
Elements & PurificationSystems Biology & Applications of ModelsLife Components & InterconnectionsContinuity of Life & Central Dogma•Qualitative Models & EvidenceFunctional Genomics & Quantitative modelsMutations & Selection
28
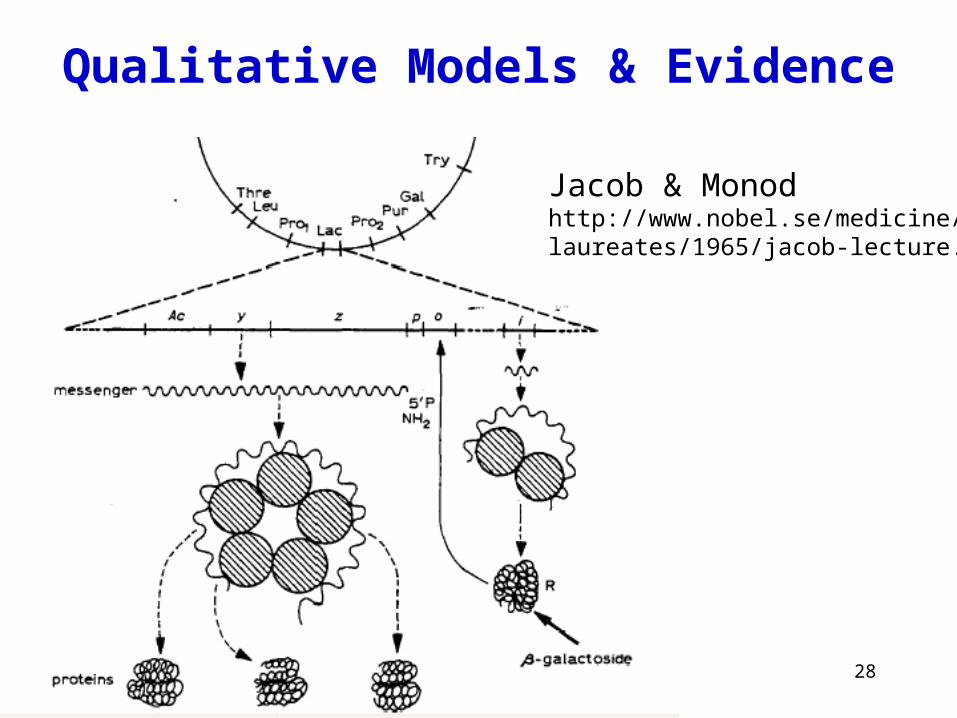
Qualitative Models & Evidence
Jacob & Monodhttp://www.nobel.se/medicine/laureates/1965/jacob-lecture.html

29
metabolismcryptic genesinformation transferregulation type of regulation genetic unit regulated trigger trigger modulationtransportcell processescell structurelocation of gene productsextrachromosomalDNA sites
Qualitative biological statements (beliefs) and evidence
Riley, GeneProtEC
MIPS functions
30
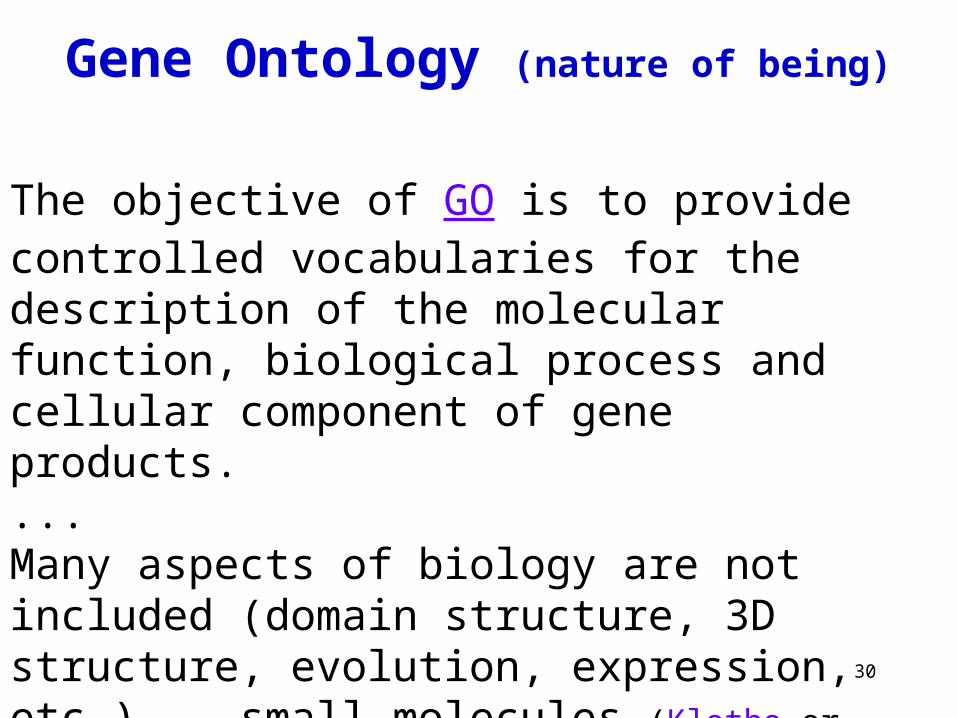
The objective of GO is to provide controlled vocabularies for the description of the molecular function, biological process and cellular component of gene products....Many aspects of biology are not included (domain structure, 3D structure, evolution, expression, etc.)... small molecules (Klotho or LIGAND )
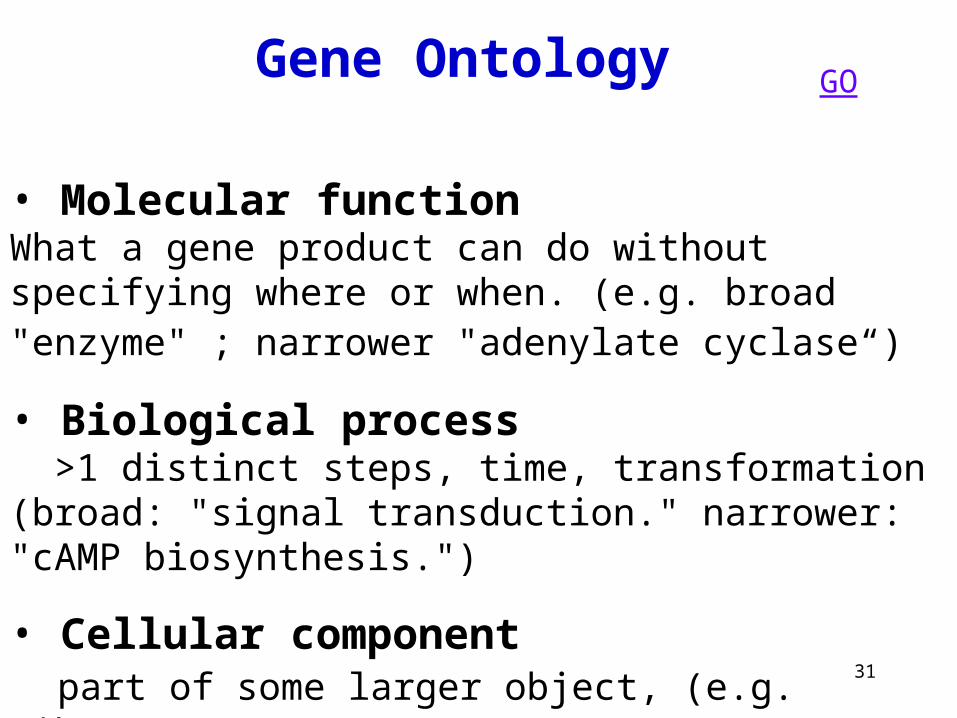
Gene Ontology (nature of being)
31
• Molecular functionWhat a gene product can do without specifying where or when. (e.g. broad "enzyme" ; narrower "adenylate cyclase“)
• Biological process >1 distinct steps, time, transformation (broad: "signal transduction." narrower: "cAMP biosynthesis.")
• Cellular component part of some larger object, (e.g. ribosome)_
Gene Ontology GO
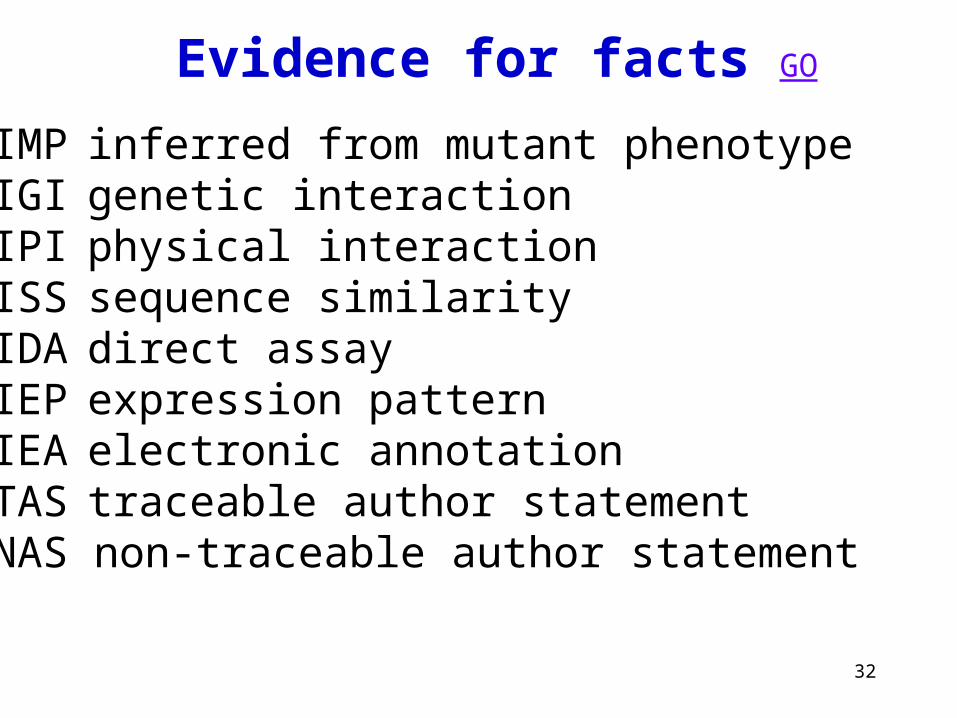
32
IMP inferred from mutant phenotypeIGI genetic interactionIPI physical interactionISS sequence similarity IDA direct assayIEP expression patternIEA electronic annotation TAS traceable author statementNAS non-traceable author statement
Evidence for facts GO

33
Direct observation
C.elegans cell lineage & neural connections
Towards Automatic Construction of Cell-Lineage of C.elegans from Nomarski DIC Microscope ImagesTomohiro Yasuda et al.1999
34
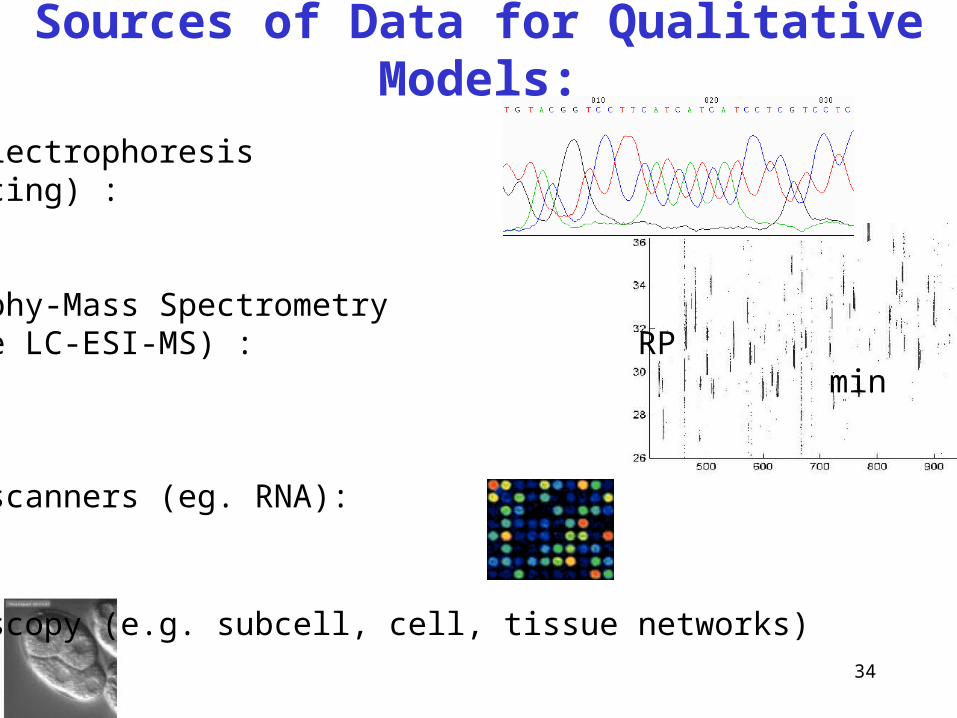
Capillary electrophoresis(DNA Sequencing) : 0.4Mb/day
Chromatography-Mass Spectrometry (eg. peptide LC-ESI-MS) : RP20Mb/day min
Microarray scanners (eg. RNA): m/z 300 Mb/day
Other microscopy (e.g. subcell, cell, tissue networks)
Sources of Data for Qualitative Models:

35
Signaling PAthway Database
SPAD
>500 bio-databasesHow are the data& models entered?
36
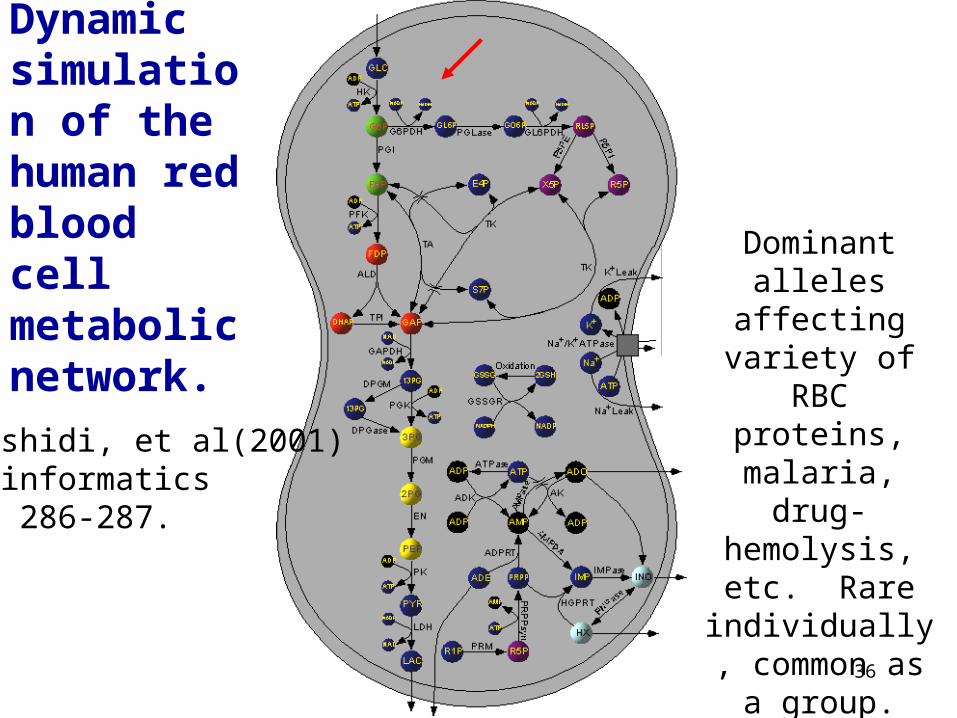
Jamshidi, et al(2001)Bioinformatics17: 286-287.
Dominant alleles affecting variety of RBC proteins,
malaria, drug- hemolysis, etc.
Rare individually, common as a
group.
Dynamic simulation of the human red blood cell metabolic network.
37
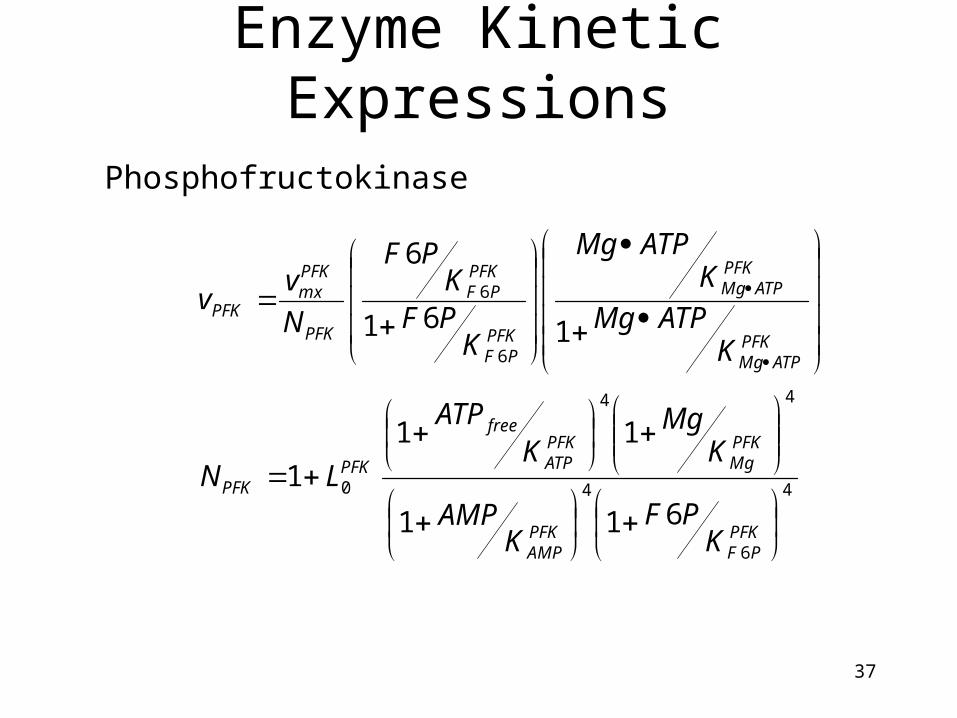
Enzyme Kinetic Expressions
Phosphofructokinase
4
6
4
44
0
6
6
611
11
1
161
6
PFKPF
PFKAMP
PFKMg
PFKATP
free
PFKPFK
PFKATPMg
PFKATPMg
PFKPF
PFKPF
PFK
PFKmx
PFK
KPF
KAMP
KMg
KATP
LN
KATPMg
KATPMg
KPFK
PF
N
vv

38
How do enzymes & substrates formally differ?
ATP E2+P ADP E EATP EP
E
A EA EB B
Catalysts increase the rate (&specificity) without being consumed.

39
Continuity of Life & Central Dogma
RNA
Metabolites
DNA Protein
Growth rateExpression
Interactions
Polymers: Initiate, Elongate, Terminate, Fold, Modify, Localize, Degrade
Self-assembly, Catalysis, Replication, Mutation, Selection Regulatory & Metabolic Networks

40
Integrate 2: Optimal BioSystems
Elements & PurificationSystems Biology & Applications of ModelsLife Components & InterconnectionsContinuity of Life & Central DogmaQualitative Models & Evidence•Functional Genomics & Quantitative modelsMutations & Selection

41
Capillary electrophoresis(DNA Sequencing) : 0.4Mb/day
Chromatography-Mass Spectrometry (eg. peptide LC-ESI-MS) : RP20Mb/day min
Microarray scanners (eg. RNA): m/z 300 Mb/day mpg
Other microscopy (e.g. subcell, cell, tissue networks)
Sources of Data for Quantitative Models:

42
(the challenge of distant homologs)? ?
Functional Genomics(quantitative ligand interactions)
Structural Genomics
100% Sequence Identity:1. Enolase Enzyme2. Major Eye Lens Protein
100% Sequence Identity:1. Thioredoxin Redox2. DNA Polymerase Processivity
43
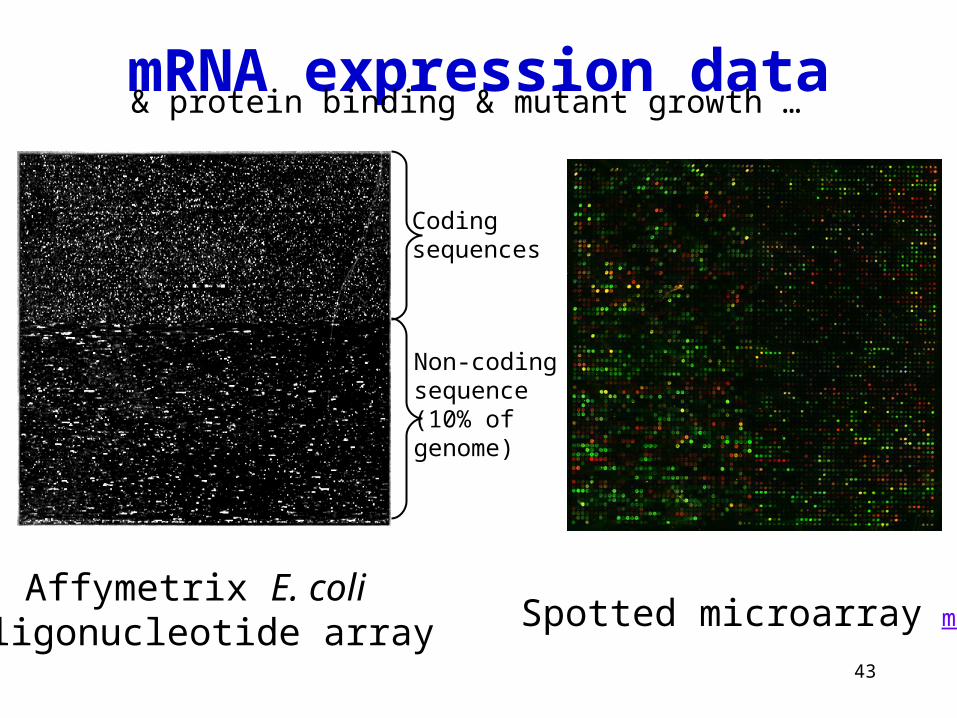
mRNA expression data
Non-coding sequence(10% of genome)
Coding sequences
Affymetrix E. coli oligonucleotide array Spotted microarray mpg
& protein binding & mutant growth …
44
Function (1): Effects of a mutation on fitness (reproduction) summed over typical environments.Function (2): Kinetic/structural mechanisms.Function (3): Utility for engineering relative to a non-reproductive objective function.
Proof : Given the assumptions, the odds are that the hypothesis is wrong less than 5% of the time, keeping in mind (often hidden) multiple hypotheses.
Is the hypothesis suggested by one large dataset already answered in another dataset?
What is functional genomics?
45
Whole systems: Less individual gene- or hypothesis-driven experiments; Automation from cells to data to model as a proof of protocol.
Quality of data: DNA sequencing raw error: 0.01% to 10%. Consensus of 5 to 10 error: 0.01% (1e-4)
Completion: No holes, i.e. regions with data of quality less than a goal (typically set by cost or needs of subsequent projects).
Impossible: The cost is higher than reasonable for a given a time-frame and quality assuming no technology breakthroughs. Cost of computing vs. experimental "wet-computers".
Genomics Attitude
46
Integrate 2: Optimal BioSystems
Elements & PurificationSystems Biology & Applications of ModelsLife Components & InterconnectionsContinuity of Life & Central DogmaQualitative Models & EvidenceFunctional Genomics & Quantitative models•Mutations & Selection
47
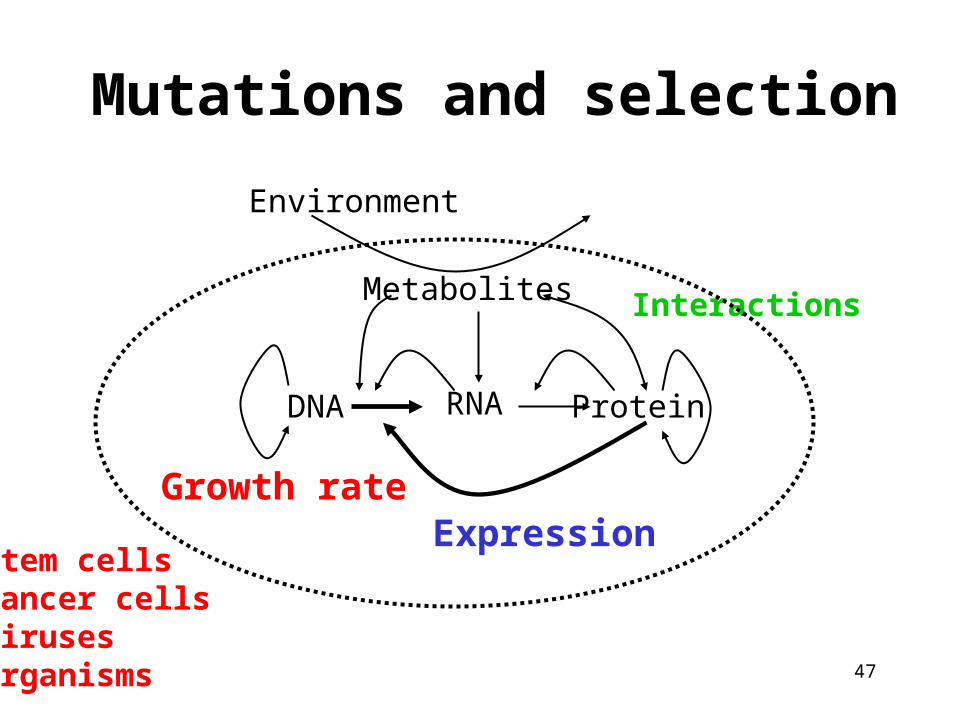
DNA RNA Protein
Metabolites
Growth rateExpression
Interactions
Environment
Mutations and selection
stem cellscancer cellsvirusesorganisms
48
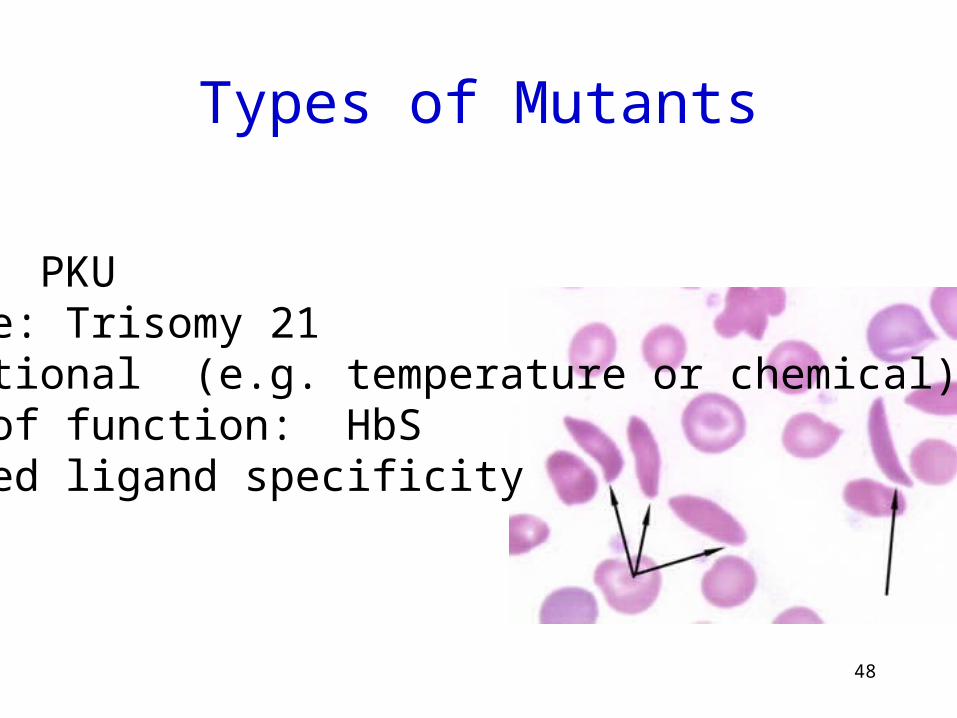
Types of Mutants
Null: PKUDosage: Trisomy 21Conditional (e.g. temperature or chemical)Gain of function: HbSAltered ligand specificity

49
In-framemutants+ wild-type
Pool Select
MultiplexPCRsize-tagor chipreadout
40° pH5 NaCl Complex
t=0
Multiplex Competitive Growth Experiments
Tagged mutants

50
over environments, e ,times, te , selection coefficients, se,R = Ro exp[-sete]
80% of 34 random yeast insertions have s<-0.3% or s>0.3%t=160 generations, e=1 (rich media); ~50% for t=15, e=7.Should allow comparisons with population allele models.
Multiplex competitive growth experiments:Thatcher, et al. (1998) PNAS 95:253.Badarinarayana, et al. (2001) Nature Biotech.19: 1060. Smith V, et al. (1995) PNAS 92:6479. Shoemaker D, et al. (1996) Nat Genet 14:450.
Ratio of strains
51
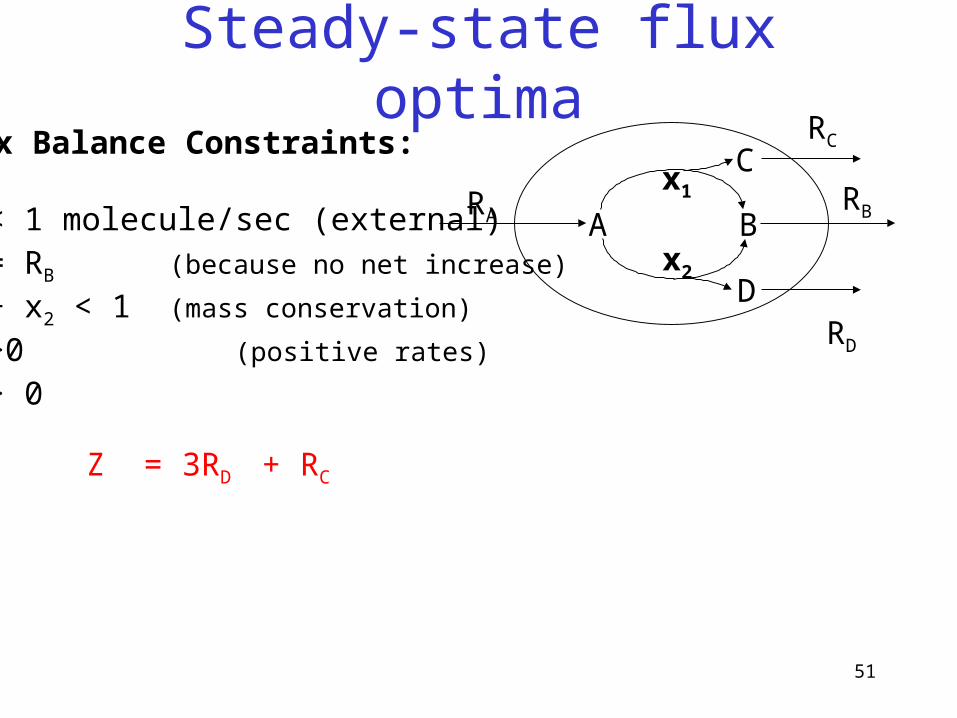
Steady-state flux optima
A BRA
x1
x2
RB
D
CFlux Balance Constraints:
RA < 1 molecule/sec (external)RA = RB (because no net increase)
x1 + x2 < 1 (mass conservation) x1 >0 (positive rates)
x2 > 0
RC
RD
Z = 3RD + RC

52
Steady-state flux optima
A BRA
x1
x2
RB
D
C
Feasible fluxdistributions
x1
x2
Max Z=3 at (x2=1, x1=0)
RC
RD
Flux Balance Constraints:
RA < 1 molecule/sec (external)RA = RB (because no net increase)
x1 + x2 < 1 (mass conservation) x1 >0 (positive rates)
x2 > 0
Z = 3RD + RC
(But what if we really wanted to select for a fixed ratio of 3:1?)
53
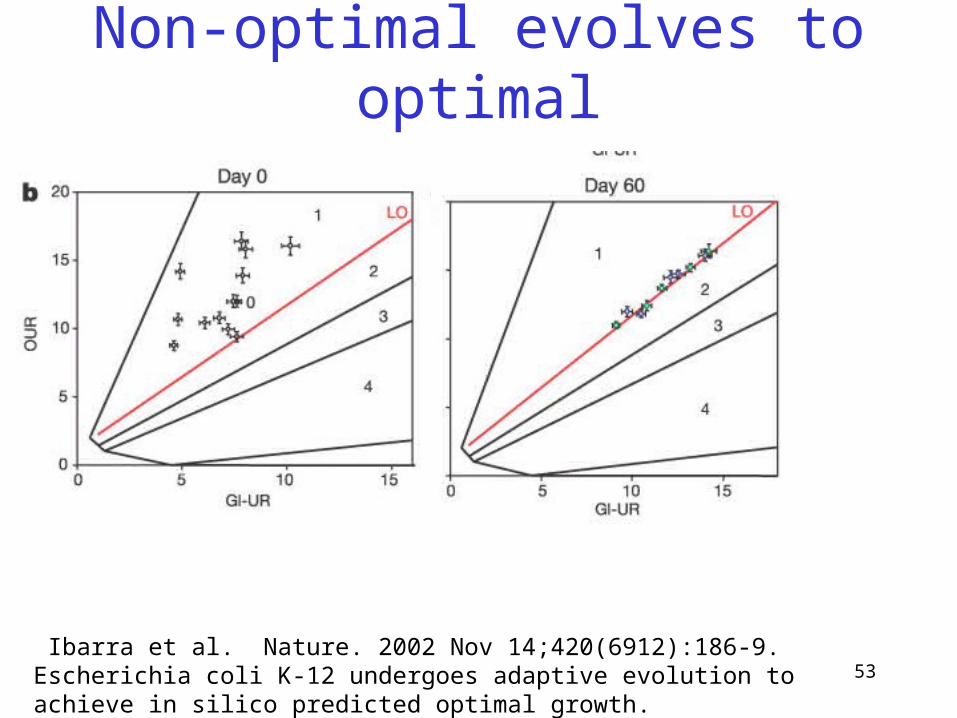
Non-optimal evolves to optimal
Ibarra et al. Nature. 2002 Nov 14;420(6912):186-9. Escherichia coli K-12 undergoes adaptive evolution to achieve in silico predicted optimal growth.
54
Integrate 2: Optimal BioSystems
Elements & PurificationSystems Biology & Applications of ModelsLife Components & InterconnectionsContinuity of Life & Central DogmaQualitative Models & EvidenceFunctional Genomics & Quantitative modelsMutations & Selection


![RESEARCH ARTICLE OpenAccess Component … · RBE method thus profits from the fact that RB approximations yield a rapid and in many cases exponential convergence [5]. ... In Section](https://img.dokumen.tips/doc/110x75/5e9b6a6fcc45df78504a1767/research-article-openaccess-component-rbe-method-thus-profits-from-the-fact-that.jpg)