Embed Size (px)
Citation preview

1
Innovative Thinkingin Retail Banking
Investor Pre - Roadshow Presentation April 2008

2
Individuals
in need of
basic low cost banking
Our Focus

3
We deliver on four core needs:
• Accessibility
• Affordability
• Simplicity
• Personal Service
3
4
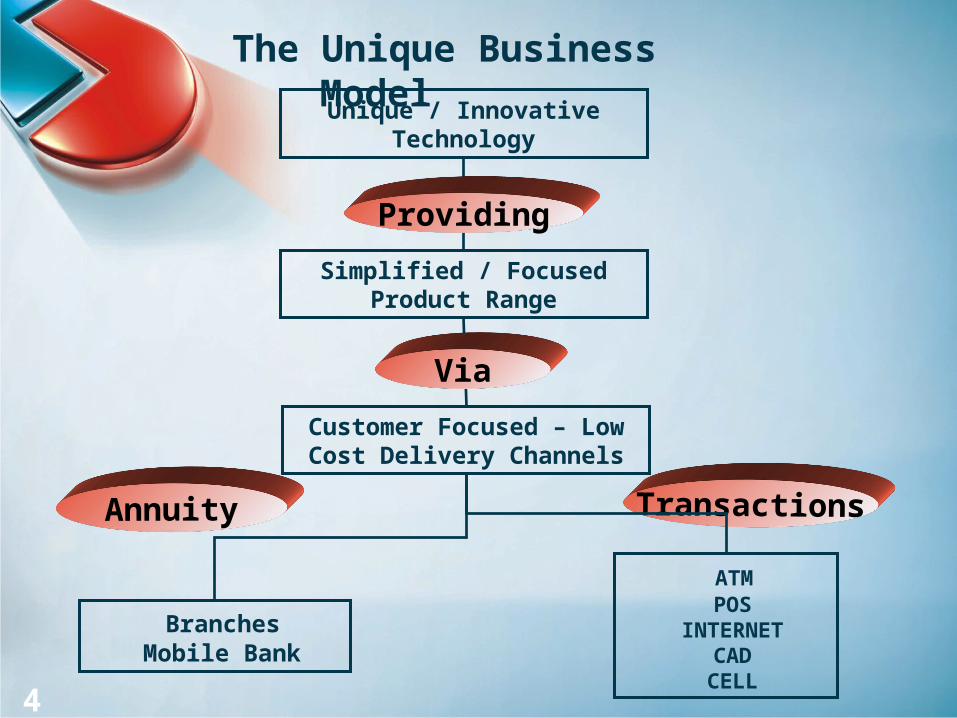
The Unique Business Model
Unique / Innovative Technology
Simplified / Focused Product Range
Branches Mobile Bank
ATM POS
INTERNET CAD CELL
Providing
Customer Focused – Low Cost Delivery Channels
Annuity Transactions
Via
4

5
The Capitec Bank RevolutionOur Technology Platform
•Features• Paperless• Process Driven• Real Time Delivery• Cashless• Central Control – no branch back office• Handle high volume transactions efficiently
•Structure• Open Platform• Windows-based• Scaleable
5

6
Simplified Focused Product Offer- Structure
Transactions
• Purchases
• Transfers
• Debit orders
• Stop orders
Multi loan
1 / 3 / 6 month loans
12 / 18 / 24 / 36 month term loans
Cash Wallet
Savings Account
Focus Save Accounts
6

7
Simplified Focused Product Offer- Price
Savings and Transactions
• Aggressive
Loans
• Competitive
7

8
Our People
• Cultural alignment
• Service driven
• Recruit for potential, train for skill
• Team approach
• Zero to hero in 7 weeks Firm Foundations
• Ongoing investment in competency E Learning
8

9
The MarketAverage Income Spread
LSM Number
(People million)Income %
1 2.1 R 0 – R 947 7
2 3.8 R 949 – R 1 179 12
3 3.8 R 1 179 – R 1 443 13
4 4.5 R 1 443 – R 1 977 15
5 4.1 R 1 977 – R 2 549 13
6 4.3 R 2 549 – R 4 366 14
7 2.3 R 4 366 – R 6 659 8
8 1.7 R 6 659 – R 9 388 6
9 1.9 R 9 388 – R12 077 6
10 1.7 R12 077 – R19 298 6* Household Income after statutory deductions
Target Market
17m
9

10
Client Base
02/07 02/08
Salary clients only 78 368 158 005
Loan clients only 236 092 348 966
Loan & salary clients 132 712 170 922
Sub-total 447 172 677 893
Savings clients 563 107 693 283
Total 1 010 279 1 371 176
10

11
Salary ClientsAge
2.906.58
15.74
5.73
41.83
27.23
-
5
10
15
20
25
30
35
40
45
18 - 20 21 - 30 31 - 40 41 - 50 51 - 60 61+
%
11

12
Loan ClientsAge
-
5
10
15
20
25
30
35
40
18
- 20
21
- 30
31
- 40
41
- 50
51
- 60
60
+
%
Male Female
12
13
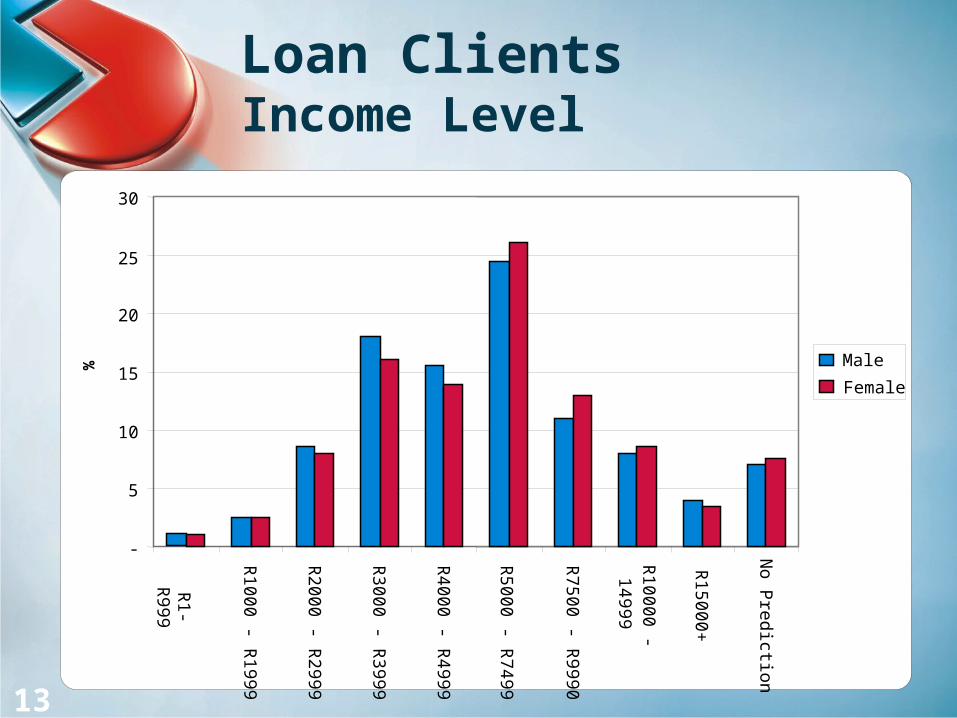
Loan ClientsIncome Level
-
5
10
15
20
25
30
R1- R
999
R1000 - R
1999
R2000 - R
2999
R3000 - R
3999
R4000 - R
4999
R5000 - R
7499
R7500 - R
9990
R10000 -14999
R15000+
No P
rediction
% Male
Female
13

14
History
1. Microlending
2. Bank (2000/1)- Management team
- Determining strategy- Bank licence- PASA membership- IT platform
3. Conversion- Microlending to bank
- Deposit taking- Client conversion to bank with Capitec
4. Growth Strategy14

15
Group & Operations Structure
100% 100%75%
PSG Group 34.9%
Management 8.79%
Non-ex directors
(excl black directors) 15.79%
BEE groups & individuals
15.99%
Other
24.53%
CAPITEC BANK HOLDINGS (CBHL)
Listed and registered as a bank controlling
company
Capitec Bank (Retail bank)
Key Distributors (FMCG wholesaler)
Other (No activity)
15

16
Management
• CEO
Riaan Stassen (54)
• CFOAndre du Plessis (46)
• Other Executives:
- IT Chris Oosthuizen (53)
- Risk Christian van Schalkwyk (52)- Human Resources Leon Venter (46)- Operations/Sales Gerrie Fourie (44)- Marketing & Corporate Affairs Carl Fischer (51)- Credit Risk Jaco Carstens (39)
Ian Abrahams (39)- Card Services & Business
Support Andre Olivier (40)Faick Davids (31)
16

17
Employment Equity Profile
Target 2004 2008
Senior Management 20% 8% 11%
Middle management 30% 15% 25%
Junior Management 40% 18% 50%
Rest 82% 81% 93%
17

18
Key Risks and Mitigants
• Credit
• Liquidity
• Regulatory
• Systems
• Interest rate
• Taxation
18
19
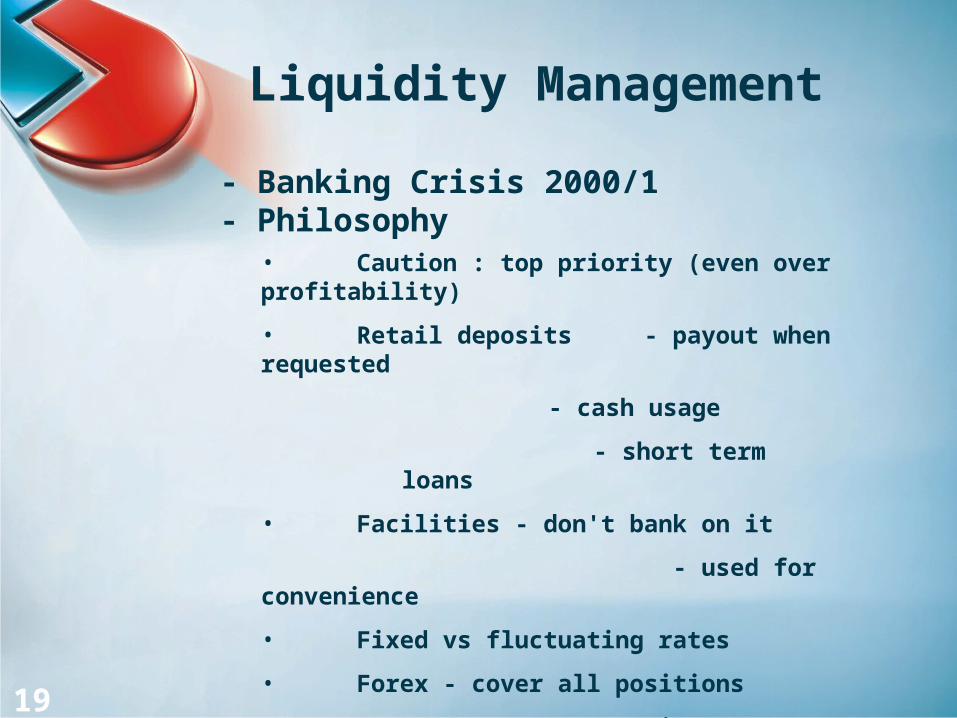
Liquidity Management
• Caution : top priority (even over profitability)
• Retail deposits - payout when requested
- cash usage
- short term loans
• Facilities - don't bank on it
- used for convenience
• Fixed vs fluctuating rates
• Forex - cover all positions
- no appetite
• Simplicity / no complex structures
- Banking Crisis 2000/1- Philosophy
19

20
Liquidity - History
• Initial strategy – Self funding
• Build trust – Retail savings deposit base
• Wholesale funding agreements
• Un-published ratings
• Preference shares
• Published ratings
• BBEE
• Short term corporate paper
• DMTN
• Retail term deposit base
20

21
Basel II – Pillar 1 Minimum Regulatory Capital Requirement
Basel I Feb 2007
Dec 2007
79%
51%
Basel II (BIA) Dec 2007
Feb 2008
37%
36%
Basel II (ASA) Feb 2008 58%
21

22
Basel II – Pillar 2 The Supervisory Review Process
• Supervisory Review and Evaluation Process (SREP)
• Risk Management
• Capital Management
• Capitec Internal Capital Assessment Process (CICAAP)
• Foundation Internal Ratings Based approach (FIRB) for credit risk
22

23
Basel II – Pillar 3Market Discipline
• Regulation 43 Public disclosures
• Quarterly, Bi-annual and Annual disclosures
• Dedicated Website Page under Investor relations
23

24
National Credit Act (NCA)
Act
• Income components & ceilings
• Procedures, rules & output
• Debt counseling & mediation
VAT leakage
Opportunity
Strategy (pre-empting effect)
24

25
Financial Highlights

26
Holdings vs Bank results
- IFRS
Holdings :
Equity settled in Statement of Changes in Shareholders Equity
Bank :
Cash settled through Income Statement
26

27
Loans Advanced
1,4771,904
2,2592,863
3,449
5,162
0
1,500
3,000
4,500
6,000
2003 2004 2005 2006 2007 2008
Rm
27
28
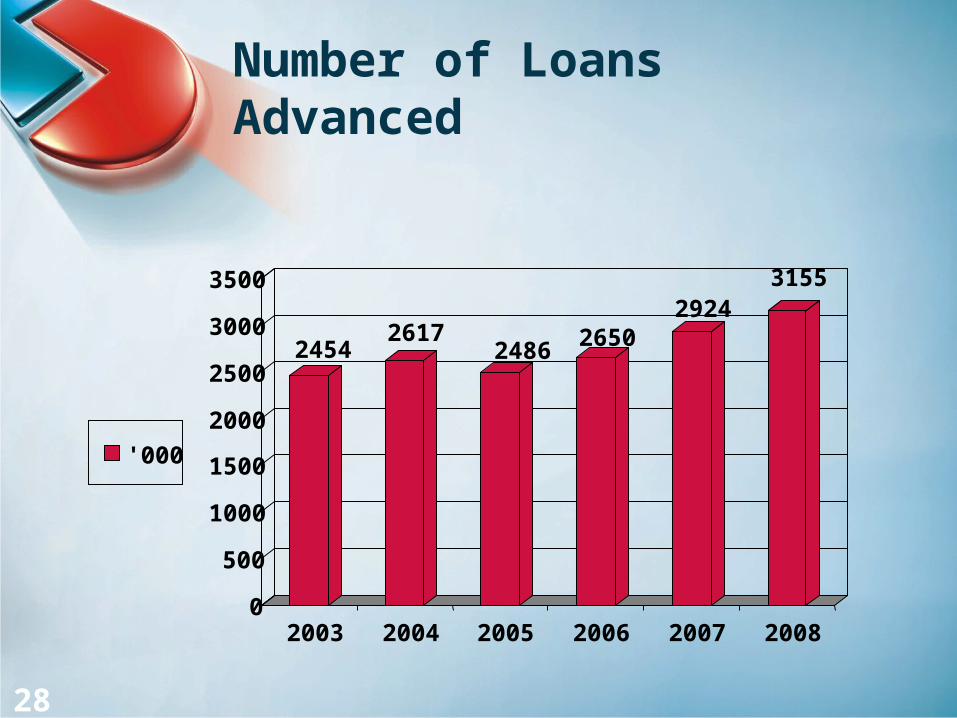
Number of Loans Advanced
24542617
2486 26502924
3155
0
500
1000
1500
2000
2500
3000
3500
2003 2004 2005 2006 2007 2008
'000
28

29
Loans advanced per product
R’m 2007 % 2008 %
1 Month 1600 46 1 692 33
3 Month 687 20 757 15
6 Month 392 11 314 6
12 Month 425 12 797 15
18 Month 190 6 430 8
24 Month 155 5 774 15
36 Month - 398 8
3 449 5 162
29

30
Impairment per product
% 1
Month
3
Month
6
Month
12 Month
18 Month
24 Month
36 Month
2008 1.05 3.83 5.14 10.18 12.99 15.78 29.37
2007 1.61 3.16 6.85 13.13 24.30 21.65 -
30
31
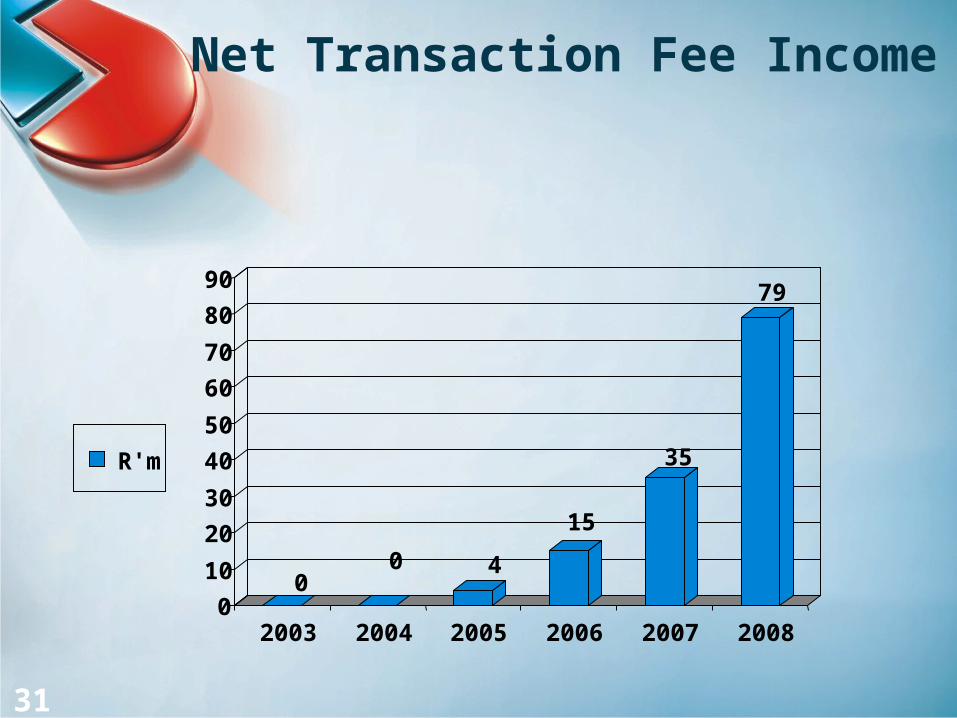
Net Transaction Fee Income
00 4
15
35
79
0
10
20
30
40
50
60
70
80
90
2003 2004 2005 2006 2007 2008
R'm
31

32
Value of Savings Deposits
04 74
314
554
838
0
100
200
300
400
500
600
700
800
900
2003 2004 2005 2006 2007 2008
R'm
32

33
Operations

34
Bank Branches
44
148
251 253280
331
0
100
200
300
400
2003 2004 2005 2006 2007 2008
Number
34

35
ATMs
5875
180 210
407
765
0
100
200
300
400
500
600
700
800
2003 2004 2005 2006 2007 2008
No
35

36
Employees
1,180
1,4021,708
1,9012,129
2,800
1,000
1,500
2,000
2,500
3,000
2003 2004 2005 2006 2007 2008
No
36

37
Profitability
38
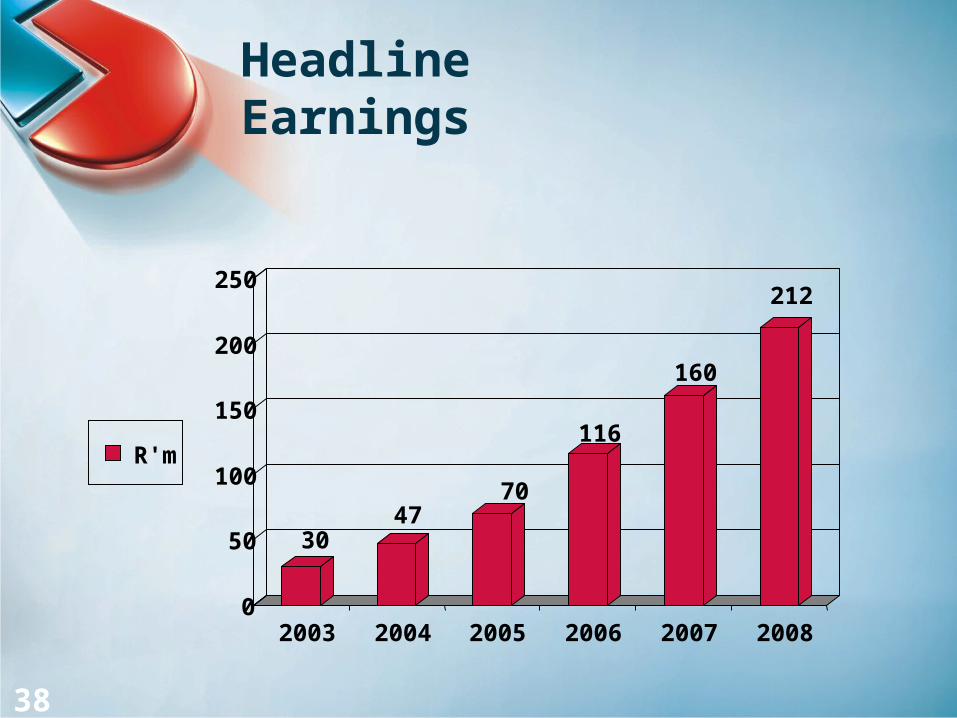
Headline Earnings
3047
70
116
160
212
0
50
100
150
200
250
2003 2004 2005 2006 2007 2008
R'm
38

39
Headline Earnings per Share
4570
101
165
222
259
0
50
100
150
200
250
300
2003 2004 2005 2006 2007 2008
Cents
39

40
Return on Equity
8
12
16
23
26
22
0
10
20
30
2003 2004 2005 2006 2007 2008
%
40

41
Cost to Income Ratio
77 76 7466 60
58
0
50
100
2003 2004 2005 2006 2007 2008
%
41

42
Shareholder Funds
384 426 473564
1,1171,217
0
300
600
900
1200
2003 2004 2005 2006 2007 2008
R'm
42

43
Market Capitalisation
164399
1,072
2,233
3,0313,195
0
500
1000
1500
2000
2500
3000
3500
4000
2003 2004 2005 2006 2007 2008
R'm
43

44
Total Assets
434512
805
1,251
2,191
2,937
0
500
1000
1500
2000
2500
3000
2003 2004 2005 2006 2007 2008
R'm
44

45
Going Forward

46
Going forwardInvestment • Distribution
- +25 Branches
- +75 Mobile Banks- +50 ATMs- +2 250 POS devices
• Technology- Branch Streamlining
Challenges• Cash-plastic• Economy• Competitors• Funding• Crime
46

47
Thank You
Questions ?