Embed Size (px)
Citation preview

Wor
ld tr
ade
deve
lopm
ents
in 2
002
and
pros
pect
s fo
r 200
3
1
1. Highlights of world trade in 20021
In 2002, world trade recovered from its steep decline in2001. From the first through the third quarter, world tradeexpanded strongly but stalled in the fourth quarter of 2002. Theaverage annual rate of merchandise trade expansion in 2002was therefore limited to 3% in real terms, only half the rateobserved in the 1990s.
The trade recovery benefited from strong import demand indeveloping Asia, the transition economies and the United States.Sluggish import demand in Western Europe and a sharpcontraction of Latin America’s imports constituted a drag onglobal trade expansion.
Manufactured goods again recorded above-average tradegrowth while trade in mining products (mainly fuels) stagnatedin real terms. Total merchandise trade growth again exceededmerchandise output growth.
Exchange rates and price developments continued to affecttrade flows. Exchange rate changes affect not only thecompetitiveness of traders but also nominal trade values. Thedepreciation of the United States dollar against the currencies ofmajor traders in Asia and Western Europe since early 2002 waswidely expected, given the prevailing current account imbalances(see Chart 1).
World trade developments in 2002 and prospects for 2003
80
90
100
110
2001 2002 200380
90
100
110
2001 2002 2003
Asia
Annualaverage
Western Europe
a Currency baskets weighted by trade values. West European currencies are those of Euro-zone, the United Kingdom, Switzerland, Sweden and Norway. The Asian currencies are those of Japan, China, Republic of Korea, Chinese Taipei, Singapore and Hong Kong, China.
Chart 1
Dollar depreciation against Western European and Asian currenciesa, 2001-03(Indices, January 2001 = 100)
deficit, the latter equivalent to 5% of its GDP. United States’merchandise trade recorded a deficit in all seven geographicregions, with all its six major trading partners and in 15 of the17 merchandise product groups distinguished in this report.Trade with Asia alone accounted for one half of the UnitedStates’ trade deficit (see Table A10). The reliance of the globaltrade expansion on above-average United States import growthbears severe risks. Already, a re-balancing of the current UnitedStates’ merchandise trade deficit, solely by a reduction ofimports, would – theoretically – imply a contraction of worldmerchandise trade by 7%. This hypothetical calculation highlightsthe extent to which global trade growth is sustained by theUnited States economy.
- China’s trade expansion (both exports and imports)remained outstanding. In the 1990s, China’s trade growth wasthree times faster than global trade and between 2000 and2002 its exports and imports rose by 30%, while world tradestagnated. China has become the fourth largest merchandisetrader (if one counts the EU as a single trader) in 2002. Acrossthe globe, China has become a major supplier and for manyeconomies, also a major export destination (see Chart 2).
1 In April 2003, the WTO Secretariat published in a press release (Press 337) itsfirst account of trade developments in 2002. The World Trade Report, 2003,released in August 2003, includes an economic analysis of 2002 tradedevelopments. International Trade Statistics, 2003 adds an overview section to acomprehensive set of tables and charts, provides new information on trade byproduct and intra-regional trade flows in 2002 and concludes by reporting brieflyon trade developments in the first half of 2003.
Western European currencies appreciated by 6% on anannual average basis against the dollar in 2002 leading to astrengthening of the region’s dollar prices which lifted the dollarvalue of Western Europe’s trade. Exchange rate changes had anegligible effect on Asia’s nominal trade growth in 2002, thedollar value remaining on average unchanged from thepreceding year. The slight average price increase reported forfuels and non-fuel commodities contributed to the overallincrease in world trade prices in 2002.
Among the main features of world trade in 2002, four areoutstanding:
- A combination of declining exports and rising imports bythe United States has led to a record trade and current account
Chart 2
Share of China in exports and imports of major traders, 2000 and 2002(Percentage share)
Exports Imports
2000
20 10 5 20151050
2002
United States
EU
Japan
Developing Asia
- Chemicals emerged as the product group with thestrongest trade growth over the last two years. Driven bypharmaceutical trade among the developed countries, its share inworld merchandise exports rose above 10%, exceeding in valuenot only world trade in automotive products, but also that ofagricultural products.
- The steady rise in the number of regional trade agreements(RTAs) suggests an increase in the share of preferential trade at

Wor
ld tr
ade
deve
lopm
ents
in 2
002
and
pros
pect
s fo
r 200
3
2
the expense of non-discriminatory multilateral trade. However,due to new Members, the share of world trade accounted for byWTO Members increased further to 95% in 2002 and the tradeof the six major plurilateral RTAs combined did not expand fasterthan world merchandise trade in 2002, nor in the 1995-2002period.
2. Global merchandise output andtrade volume developments by sector
World merchandise output is estimated to have increased byslightly less than 1% in 2002. All three sectors (agriculture,manufacturing and mining) recorded a positive albeit rathermoderate growth in output. The rebound in trade was strongerthan that of output. The expansion of trade in agriculture andmanufacturing again exceeded that of output, while for themining sector, both trade and output recorded only marginaladvances in 2002. Comparing the trade and outputdevelopments in 2002 with those of the 1990s, one notices thatrecent growth rates are much lower, and that the gap betweentrade and output growth in 2002 has become much smaller thanin the previous decade, when trade and output recorded averagegrowth rates of 6.5% and 2.5% respectively (see Chart 3).
strengthening of dollar prices in international trade.Consequently, world merchandise exports recovered by 4% invalue terms in 2002 after contracting by 4% in the precedingyear. Commercial services exports expanded by 6% and thereforefaster than merchandise trade in 2002 (see Table 1). Among thethree major commercial services categories, the expansion oftransportation and travel services again lagged well behind thatof other commercial services (see Table IV.2).
All merchandise product groups benefited from the reboundof trade in 2002 and recorded an improved performance whencompared with the preceding year, although two product groupsrecorded a further contraction in their export value in 2002. Thevariation of annual growth rates remained quite large among the14 merchandise groups distinguished in this Report, rangingfrom less than 2% to 10%. Among the three broad merchandiseproduct categories, agricultural products and manufacturedgoods expanded at above-average rates while the global tradevalue of mining products (mainly fuels) decreased for the secondyear in a row (Table IV.1). Divergent price developmentscontributed to this outcome due to the strengthening of prices ofagricultural products and manufactured goods, while those ofmining products weakened slightly.
At the more disaggregated product group level, internationaltrade in chemicals and automotive products recordedoutstanding growth. By contrast, the steepest decline in dollarvalue is found in the exports of non-ferrous metals, adevelopment which can be attributed largely to weaker prices, inparticular, for aluminium (see Chart 4).
For the second year in a row chemicals were the mostbuoyant component of world merchandise trade. World exportsin this product category expanded by 10% and amounted to$660 billion. All three major importers of chemicals (EU, UnitedStates and China) recorded strong import demand in 2002. Onthe export side, large variations in growth could be observedamong the leading exporters. While the EU, Switzerland andSingapore reported double-digit growth in their chemicalsexports, those of NAFTA countries and the Republic of Korearemained roughly unchanged. Japan’s exports of chemicalsrecovered by 8% in 2002 but did not fully offset the precedingyear’s decline (see Table IV.39).
There are two elements in the recent development of worldtrade in chemicals worth highlighting. First, the strength of tradein chemicals in recent years can largely be attributed to the rapidexpansion of trade in pharmaceutical products, lifting the shareof chemicals in world merchandise trade to a new peak level ofabove 10% in 2002. Strong pharmaceutical sales in the majordeveloped markets, the spread of production-sharing networksand a rise in re-imports, sustained, according to industry sources,global trade in pharmaceuticals. Second, the United Statesrecorded a trade deficit in its chemicals trade for the first timesince the World War II. Despite this fact, it has roughlymaintained its share in world chemical exports since 1990. Theshift from a sizeable surplus to a deficit in the trade balance of
Table 1
World exports of merchandise and commercial services, 1990-02
(Billion dollars and percentage)
Merchandise 6270 6.5 13.0 -4.0 4.0 15.0
Commercial services 1570 6.5 6.0 0.0 6.0 …
Value Annual percentage change
2002 1990-00 2000 2001 2002 2003First half
ExportsOutput
Chart 3
World merchandise trade and production by major product group, 2002(Annual percentage change in volume terms)
Agricultural products
Mining products
Manufactures All products
4
3
2
1
0
3. Development of trade values byproduct
The rebound of global trade in 2002 was somewhat strongerin nominal dollar terms than in real or volume terms. Exchangerate and commodity price developments contributed to the

Wor
ld tr
ade
deve
lopm
ents
in 2
002
and
pros
pect
s fo
r 200
3
3
this sector can be entirely attributed to the dynamic developmentof the United States’ imports of chemicals, which has nearlydoubled its share since 1990 reaching 13% of world chemicalimports in 2002.
World exports of automotive products benefited from the pickup in global automobile production/demand and recoveredstrongly, reaching a new peak level in 2002 of $630 billion.Western and Eastern Europe and Asia had been the regions withthe most dynamic expansion of automotive product exports andimports. EU exports, accounting for nearly one half of worldexports of automobiles, rose by 10%. EU exports to thirdcountries are reported to have increased more than intra-EUtrade (16% versus 7% respectively). As automobile production inthe Czech Republic, Hungary, Poland, Slovakia and Turkeybecomes increasingly integrated into a European automobileproduction network, both exports and imports of theseeconomies continue to rise. Japan’s automobile exportsrecovered from the sharp setback in 2001 and expanded atdouble-digit rates to all regions except Latin America. Japan’sautomotive product exports to Asia rose by nearly one quarter,with shipments to China up by 77% (see Table A16).
NAFTA members’ exports of automotive products, traded verylargely within the region, increased by 4% in 2002. NAFTAimports from third countries, mainly Japan, the EU and theRepublic of Korea, increased by more than 15%. Mexico’sexports stagnated and imports declined in 2002, in contrast totheir sharp rise throughout the 1990s. The Central/EasternEuropean countries continued to expand their exports andimports of automotive products at double-digit rates in 2002.
A combination of trade liberalization, leading to lowerdomestic car prices, rising foreign direct investment (FDI) inflowsin the automobile sector and strong domestic demand led to animport surge of automotive products in China in 2002. Despitethe 42% rise in China’s imports of automotive products, its sharein world imports of this product group was still only 1% in 2002.A strong recovery of imports of automotive products wasreported in a number of Asian economies (e.g. Australia (18%),Japan (7%), the Republic of Korea (49%), Chinese Taipei (11%),New Zealand (32%) and Thailand (12%)). However, Asia’simports of automotive products in 2002 still remained belowtheir 1996 peak level, while global imports of all other regionsexpanded by one third over this six year period. The currentimport level of automotive products in many Asian markets isoften rather low since the domestic automobile industry isprotected by high import barriers.2 Consequently, intra-Asiantrade in automotive products is also limited and accounts for
only one fifth of the region’s exports. For all other manufacturedgoods, the share of intra-Asian trade was close to one half in2002. Global trade in automotive products continues to bedriven by EU and United States’ import demand which,combined, accounts for more than two thirds of world imports ofautomotive products (see Table IV.53).
Although world trade in iron and steel recovered by 7% in2002, this did not fully offset the decline of the preceding year.The recovery in real terms remained rather moderate given thestrengthening of prices for steel trade internationally. Theincrease of iron and steel imports by the EU and the UnitedStates mainly benefited suppliers in their own geographichemisphere. In the case of the EU, the beneficiaries have beenWestern European and transition economies while in the UnitedStates, NAFTA countries and Latin American steel exportersregained market share. It is uncertain as to what extent thespecial safeguard measures on selected steel productsintroduced by the United States in March 2002 have contributedto the observed rise in steel prices and “regionalization” of steelimports. An outstanding feature in global steel trade in 2002was the strength of China’s import expansion. China’s steelimports rose by 27% to $13.6 billion and accounted for 9% ofworld steel imports. China’s steel imports therefore exceededthose of the EU from third countries, and approached in sizethose of the United States. The sharp rise in China’s importssustained the recovery of the major Asian steel exporters, inparticular those of Japan and Chinese Taipei which succeeded inexpanding their steel shipments to China by nearly 40% in 2002(see Table IV.33).
International trade in clothing continued its expansion of thesecond half of the 1990s in 2002 by almost 4%, approximatelythe average rate of merchandise trade growth in 2002. The valueof world clothing exports reached $200 billion, accounting for3.2% of world merchandise exports (see Table IV.1). The threemajor importers of clothing, Western Europe, the United Statesand Japan which account for more than four fifths of worldimports, recorded quite divergent developments in 2002. WhileEU clothing imports from all sources rose by 5%, those of theUnited States stagnated and those of Japan decreased further by8%. As in preceding years, intra-EU trade expanded less rapidlythan imports from third countries, bringing down the share ofthe former in EU imports to a record low of 40%. Among themajor suppliers of the EU market, China, Turkey and Romaniaexpanded their shipments between 15% and 22% in 2002.Although Tunisia again increased its share in EU imports, Africa’sshare decreased in its principal export market due to the declineof EU imports from Mauritius and Madagascar. Madagascar’sclothing exports were apparently affected by trade disruptionscaused by civil strife in the country (see Table IV.68).
The sources of US imports continued to shift significantly in2002. The weight of China increased further at the expenseprimarily of high-income Asian economies such as Hong Kong,China, the Republic of Korea and Chinese Taipei, leaving theshare of Asia in United States imports of clothing unchanged at57%. Clothing imports from the Latin American region decreasedby 2%, mainly due to the 5% fall of shipments from Mexico andthe Dominican Republic which were only partly offset by the 3%increase of imports from Honduras, Guatemala and El Salvador.Supported by the AGOA Agreement, US clothing imports fromAfrica expanded for the second year in a row at a rate faster
-4 -2 0 2 4 6 8 10 12
Chart 4
World merchandise exports by product, 2002
(Annual percentage change)
Chemicals
Automotive products
Iron and steel
Agricultural products
Other consumer goods
Clothing
Textiles
Other machinery & equip.
Ores & minerals
Office & telecom. equip.Fuels
Average
Non-ferrousmetals
Other semi manufactures
2 In 2002, the share of imported passenger cars in domestic registrations was lessthan 2.5% in the Republic of Korea, India, and Malaysia. In addition, thecorresponding share of imported cars decreased markedly in Indonesia, thePhilippines, Chinese Taipei, and Thailand between 2000 and 2002, to levelsranging from 21% to 4.5%.

Wor
ld tr
ade
deve
lopm
ents
in 2
002
and
pros
pect
s fo
r 200
3
4
than total clothing imports and amounted to $1.67 billion or2.5% of United States imports in 2002.
The decline in Japan’s clothing imports left the structure of itssupplies largely unchanged. China consolidated its alreadypredominant position as a supplier of clothing. In 2002, Chinaaccounted for 78% of Japan’s imports of clothing from allsources (see Table IV.68).
The collapse of the rapid expansion in the global informationand communication technology industry continued to depressinternational trade flows in office and telecom equipment.Exports of office and telecom equipment, which was the mostdynamic product category in world merchandise trade in the1990s, stagnated at nearly $840 billion in 2002. The three majorexporters of this product category, the EU, the United States andJapan all reported a further decrease in their shipments. Thedeveloping East Asian economies as a group, however, staged astrong export recovery in 2002. In particular, the intra-regionaltrade of developing Asia in office and telecom products isestimated to have expanded by nearly 20%, reaching $130billion. This is a remarkable development given the fact thatimports of office and telecom equipment of Western Europe,North America and Japan continued to decline in the same year.China established itself as the largest supplier of and destinationfor electronic goods among the developing economies. Itsexports of office and telecom equipment surged by 45% to $75billion while its imports rose by one third to $66 billion.3 Amongthe Central/Eastern European countries, Hungary, Czech Republicand Poland expanded their exports and imports of office andtelecom equipment at double-digit rates in 2002. These threecountries have become major suppliers of electronic goods tomarkets in Western Europe and in the transition economies (seeTable IV.45).
4. Trade by region
Overview
The recovery of global trade in 2002 was broadly shared,withall regions recording an improved performance in theirmerchandise and commercial services’ trade in respect of thepreceding year (see Tables I.3 and I.4). In the case of exportsfrom North America and the Middle East, however, this meant asmaller rate of decline. The notable exception to this positivetrend was the contraction of Latin America’s commercial servicestrade and a marked decline of its merchandise imports (formerchandise trade see Chart 5).
Trade of the transition economies, which is of similar size tothat of Latin America, expanded at double-digit rates for bothexports and imports (merchandise and commercial services) andremained, for the second year in a row, the region with thefastest annual trade expansion. The marked difference in tradedevelopments between Latin America and the transitioneconomies can be partly attributed to different developments in FDI flows. While FDI flows to Latin America continued todecline, those to the transition economies rose further in 2002(see Chart 6).
In 2002, Asia recorded the strongest recovery in merchandisetrade of all regions, almost offsetting the sharp contraction of itsexports and imports in the preceding year. Asia’s commercialservices exports expanded faster than global exports while theregion’s services imports lagged behind world commercialservices’ trade expansion. Western Europe’s merchandise andservices trade values were sustained, in the short run, mainly bythe price effects of the strength of the euro and other European
3 From an economic perspective there might be some overstatement in the sizeand rise of China’s trade in office and telecom equipment in 2002. The reportedtrade numbers include shipments from processing zones which after being firstexported and sold are afterwards returned to China. The value of these returnedgoods recorded as imports (of Chinese origin) amounted to $6.88 billion in 2002.However, even if one did not take into account this particular trade flow, Chinawould remain the most dynamic of all major traders in office and telecomequipment in 2002.
Imports
Exports
-8 -6 -4 -2 0 2 4 6 8 10 12
Transitioneconomies
Developing Asia
Middle East
Western Europe
Africa
North America
Japan
Latin America
Chart 5
World merchandise trade by region, 2002
(Annual percentage change)
100
90
80
70
60
50
40
30
20
10
0
50
40
30
20
10
01997-00 2001 2002 1997-00 2001 2002
Latin America (refer to left scale)
Transition economies(refer to right scale)
Chart 6
FDI inflows into Latin America and transition economies, 1997-02(Billion dollars)
currencies vis-à-vis the United States dollar. The meagreeconomic growth of the region, however, precluded a moredynamic trade expansion. Nevertheless, Western Europe’s sharein world merchandise and commercial services trade againincreased slightly (to 41% and 47% respectively). In the 1990s,Western Europe’s share of both merchandise and commercialservices trade declined sharply. Although North Americaneconomic activity gained momentum in the course of 2002, itsnominal trade growth was weak. Marginal increases in servicestrade and a decline in merchandise exports led to an erosion ofNorth America’s share in global trade. Merchandise imports ofthe Middle East increased strongly, still benefiting from high oilrevenues since 2000. The region’s merchandise exportsstagnated in 2002 after declining in the preceding year. Africa’sexports and imports of merchandise and commercial services areestimated to have expanded at about 2% and therefore lessthan world trade (see Tables III.1, III.2, III.4 and III.5).

Wor
ld tr
ade
deve
lopm
ents
in 2
002
and
pros
pect
s fo
r 200
3
5
Developments in 2002 further accentuated the two largeregional trade imbalances in the global economy: the alreadylarge North American trade deficit widened and the substantialsurplus of the Asian region increased further. North America’smerchandise imports exceeded exports by $400 billion or 40%,while Asia’s exports were 15% larger than imports. All otherregions recorded moderate or declining surplus positions. As oilexporting countries reduced their trade surplus, the tradebalances of the Middle East and that of the transition economiesmoved closer to equilibrium. Western Europe’s trade surplusstrengthened slightly while weak domestic demand and reduced capital inflows turned Latin America’s trade deficit intoa surplus.
Trade developments by selected regions
Following a standstill in 2001, the North American economyexpanded by 2.5% in 2002. Domestic demand growth exceeded3% but like GDP remained below its average expansion rate inthe 1990s. Canada’s GDP growth exceeded that of the UnitedStates for the fourth year in a row. Employment levels continuedto shrink in the region, in particular, in the manufacturing sector.Inflation rates remained moderate despite strong fiscal andmonetary policy stimuli.
Trade did not recover as strongly as one might have expectedfrom the pick up of economic activity in the region and in theworld economy. Canada’s exports and imports increased onlymarginally in real terms and US exports decreased by 4%. OnlyUS merchandise imports recovered strongly in real terms in 2002from the contraction in the preceding year (see Table 2).
Merchandise export and import prices of North Americacontinued to decrease slightly, in particular, those of fuels,contributing to the value decline in merchandise exports andlimiting the rise in merchandise imports. North America’smerchandise exports decreased by 4% overall to $946 billion in2002. All major product groups recorded decreases on a year-to-year basis with above average decreases in office and telecomequipment (15%), mining products (9%) and other machineryand transport equipment (6%). Exports of automotive products,however, rose by 4.5% due to the recovery of intra-NorthAmerican trade.
North American exports decreased to all regions in 2002.Intra-North American shipments and exports to Asia, the MiddleEast and transition economies decreased by 2% to 3% while
those to Latin America, Western Europe and Africa decreased by7%, 10% and 12% respectively.
Developments in 2002 further accentuated the shift in thedestination of North American exports to NAFTA members whichaccounted, in that year and for the first time, for more than onehalf of total exports. The shares of all the other regions werereduced between 1995 and 2002. The focusing of NorthAmerica’s exports on NAFTA countries is accompanied by asteady loss of market share in Asia, Western Europe and theMiddle East since 2000.
North America’s imports from Asia, Western Europe and LatinAmerica increased while imports from the Middle East andAfrica, with their high share of fuels, decreased in 2002. Acomparison of the North American import structure in 2002 withthat of 1995 reveals that both China and Mexico recordedsubstantial gains in market share at the expense of all othermajor regions and suppliers. The largest reduction in their shareof US imports is recorded for Hong Kong, China, Japan,Singapore and Chinese Taipei (see Table III.13).
North America’s commercial services exports and importsincreased only marginally in 2002. For travel services, a declinewas recorded for both exports and imports while intransportation services only imports decreased. A strongexpansion of other commercial services exports and imports inthe United States more than offset the decrease of Canadianexports and imports in this services category.
In 2002, Latin America’s economy recorded its worstperformance in more than a decade. Merchandise imports andcommercial services trade shrank as they have not done sincethe debt crisis in 1982/83. Several factors contributed to this.Financial turbulence in MERCOSUR economies, a furthercontraction of capital inflows, civil strife in Venezuela andColombia and fewer foreign tourists all contributed to themoderate decline in GDP and the steep fall in Latin America’sreal imports in 2002. The trade decline was particularly strongfor intra-regional trade. Given the sluggish economic activity,under-employment increased and per capita income decreased inmost countries. The current account deficit was sharply reducedas a result of the impact of curtailed capital inflows andsignificantly reduced imports. The region’s trade balance recordedthe first surplus since 1990.
The decline in the dollar prices of Latin America’s traderesulted in trade value changes which were even weaker thanthe changes reported in real terms. The dollar value of
Table 2
GDP and trade developments in North America, 2002
(Annual percentage change)
GDP 3.2 4.2 3.9 0.4 2.5 3.2 4.1 3.8 0.3 2.4 2.8 5.4 4.5 1.5 3.3
Merchandise
Exports (value) 7 4 14 -6 -4 7 2 13 -6 -5 8 11 16 -6 -3
Imports (value) 9 11 18 -6 2 9 12 19 -6 2 7 7 11 -7 0
Exports (volume) 7 6 9 -5 -3 7 4 9 -6 -4 9 11 9 -4 1
Imports (volume) 9 11 11 -3 4 9 11 12 -3 5 9 11 10 -6 1
Commercial services
Exports (value) 8 8 7 -3 1 8 9 7 -3 1 8 7 9 -4 -2
Imports (value) 7 10 12 -1 1 8 10 13 -2 2 5 6 8 -1 -2
North America United States Canada
1990-00 1999 2000 2001 2002 1990-00 1999 2000 2001 2002 1990-00 1999 2000 2001 2002

Wor
ld tr
ade
deve
lopm
ents
in 2
002
and
pros
pect
s fo
r 200
3
6
commercial services trade decreased more than that ofmerchandise trade (see Table 3).
Latin America’s merchandise exports by major product grouprecorded divergent trends. Exports of mining products (mainlyfuels) and of machinery and transport equipment both decreasedby 2%, while the region’s exports of agricultural productscontinued to expand by 4%, helped by rising commodity prices.Agricultural and mining products account for about one fifth andmachinery and transport equipment for one third of LatinAmerica’s merchandise exports in 2002. Clothing and iron andsteel exports recovered by 2% and 19% respectively (see TableIII.22).
Latin America’s merchandise exports by destination show amarked contrast between the contraction of 10% of intra-regional trade and the 3% expansion of extra-regional exports.Latin America’s shipments to North America and Western Europerose by 2% and 3% respectively, but expanded at double-digitrates to developing countries in Asia, Africa and the MiddleEast. The latter three destinations combined account for 8% ofLatin America’s exports while those to North America andWestern Europe account for 61% and 12% respectively (see Table III.23).
More than half of Latin America’s commercial services exportsare travel receipts, the highest share among all regions. Thedownturn in global tourism in 2002 therefore, reduced theexport potential of Latin America’s services exports. LatinAmerica’s travel earnings are estimated to have decreased by3.5% but other commercial services exports decreased two timesmore. Again intra-regional trade was the principal element in theshrinkage of Latin America’s services exports.
A review of country trade performances in 2002 is reportedin Chart 7. Throughout the different parts of Chart 7 thecountries are always ranked in the same order, from left to rightaccording to the size of the dollar value of their total trade (i.e.exports and imports of merchandise and services trade dividedby two). Several features of Latin America’s trade performancecan be highlighted. First, the high concentration of LatinAmerica’s trade is apparent in the upper part of Chart 7. Fiveout of 35 countries in the region account for more than twothirds of the region’s trade. Second, the smaller traders oftenhave a higher trade per capita level than the larger traders,pointing to a higher reliance of small countries on internationaltrade. Third, a majority of countries recorded a decline in theirexports of merchandise and commercial services trade. Fourth,
the variation in the country trade growth in 2002 is high, butsmaller than on average in the second half of the 1990s. Fifth, afew countries in Latin America achieved a strong tradeperformance despite the difficult regional setting. In respect tomerchandise trade, Costa Rica, Ecuador and Peru recorded hightrade growth while for commercial services trade, Ecuador,Guatemala and Panama reported an outstanding expansion ofboth exports and imports.
Although economic activity picked up in the course of the firstthree quarters of 2002, the average annual increase in output ofWestern Europe was further reduced to about 1%. The sluggishgrowth in Western Europe is due to the weakness of privatedomestic demand. Private investment and consumption nearlystagnated in the Euro-zone and expansionary fiscal policies ledto rising public sector deficits but failed to bring back confidenceto investors and consumers. Pending structural reforms of thesocial security system increased uncertainty regarding consumers’income prospects. The sluggish GDP growth led to a further risein unemployment. Weak internal demand, the appreciation of theeuro and other European currencies vis-à-vis the dollarcontributed to the further decrease in Western Europe’s inflationrates. The region’s current account surplus increased as bothexport volume and export prices increased more than importvolumes and prices.
The acceleration in the value of Western Europe’smerchandise and services trade has to be attributed largely toexchange rate changes which boosted the region’s dollar tradeprices. Western Europe’s merchandise exports rose by 6% andthus faster than its merchandise imports which recovered from a2% decline in 2001. Western Europe’s commercial servicesexports and imports rose by 9%. Trade in other commercialservices, the largest services category, was buoyant, as exportsand imports expanded at double-digit rates in 2002 (see Table 4).
Western Europe’s merchandise exports by product grouprecorded an unusual development in 2002, with the export valueof agricultural products expanding by nearly 7%, faster thanmanufactured goods.4 Among manufactured goods, double-digitincreases are reported for both chemicals and automotiveproducts (13% and 10% respectively) while exports of office andtelecom equipment recorded a further decline of nearly 7%.
Table 3
GDP and trade developments in Latin America, 2002
(Annual percentage change)
GDP 3.2 0.1 3.4 0.4 -0.8 3.5 3.6 6.6 -0.3 1.5 3.2 -0.6 2.8 0.5 -1.3
Merchandise
Exports (value) 9 7 20 -3 0 15 16 22 -5 1 6 0 19 -2 0
Imports (value) 11 -4 16 -2 -7 15 12 23 -4 0 9 -13 10 -1 -13
Exports (volume) 9 5 8 2 2 14 12 13 -3 1 6 -1 4 7 2
Imports (volume) 11 -1 12 -1 -5 13 13 19 -4 1 9 -10 7 2 -8
Commercial services
Exports (value) 7 2 11 -2 -4 7 1 17 -7 -1 7 2 9 -1 -4
Imports (value) 7 -4 11 1 -9 5 12 19 -1 3 8 -7 8 1 -12
Latin America Mexico Other Latin America
1990-00 1999 2000 2001 2002 1990-00 1999 2000 2001 2002 1990-00 1999 2000 2001 2002
4 A recovery of intra-regional trade and a double-digit increase of Western Europe’sexports to both North America and the transition economies contributed to thisoutcome.

Wor
ld tr
ade
deve
lopm
ents
in 2
002
and
pros
pect
s fo
r 200
3
7
Chart 7
Latin America. Merchandise and commercial services trade, 2002
Note: Countries are ranked in descending order (from left to right) of the sum of exports and imports in 2002.
Trade of merchandise and services, 2000-02(Billion dollars, exports plus imports divided by two)
Exports of merchandise, 2002(Annual percentage change)
Exports of commercial services, 2002(Annual percentage change)
Imports of commercial services, 2002(Annual percentage change)
Imports of merchandise, 2002(Annual percentage change)
Trade of merchandise and services per capita, 2000-02(Dollars, average of exports and imports divided by population)
120
100
80
60
40
20
0
Mexico (183)
Brazil
Argentina
Argentina
Chile Uruguay
10000
9000
8000
7000
6000
5000
4000
3000
2000
1000
0
Uruguay
Suriname
Suriname
Bahamas
Average
Average
Average
NetherlandsAntilles
Aruba(12750)
St. Kitts and Nevis
Haiti
Haiti
Belize(20)
Guatemala
GuatemalaCosta Rica
Ecuador
Ecuador(20)
Argentina (-46)
Argentina (-56)
Venezuela (-34)
Paraguay
Paraguay
Uruguay
Uruguay (-32)
Average
Average
St. Kitts and Nevis
Guatemala
Costa RicaEcuador
Ecuador
Argentina(-33)
St. Lucia
PanamaPanama (26)
St. Lucia (-30)
El Salvador
Grenada (-48)
Barbados
Cuba
Peru
15
10
5
0
-5
-10
-15
-20
-25
-30
15
10
5
0
-5
-10
-15
-20
-25
-30
15
10
5
0
-5
-10
-15
-20
-25
-30
15
10
5
0
-5
-10
-15
-20
-25
-30

Wor
ld tr
ade
deve
lopm
ents
in 2
002
and
pros
pect
s fo
r 200
3
8
Clothing exports increased by 6.5% to $61 billion but continuedto remain below their 1998 peak level (see Table III.32).
Western Europe’s merchandise trade with transitioneconomies was again the most dynamic regional component ofits exports and imports, expanding at double-digit rates.European Union trade with this region is now close to thecombined trade with Africa, the Middle East and Latin America.The EU’s trade with North America recorded a further increase inthe bilateral trade surplus as shipments to North Americaincreased by 5% and imports decreased by 6%.
Although the EU’s merchandise exports to Asia expanded by5% and thus somewhat faster than imports from that region, thebilateral deficit continued to widen. Trade developments betweenthe EU and individual Asian countries showed significantdifferences in 2002. While exports to and imports from Japancontinued to shrink for the second consecutive year, those withChina expanded at double-digit rates in 2002. As a result ofthese divergent trends, China became the third largest supplierto the EU, ahead of Japan and Switzerland. Despite theoutstanding growth of EU exports to China, these shipments arestill equivalent to less than half of EU shipments to Switzerland(see Table III.37).
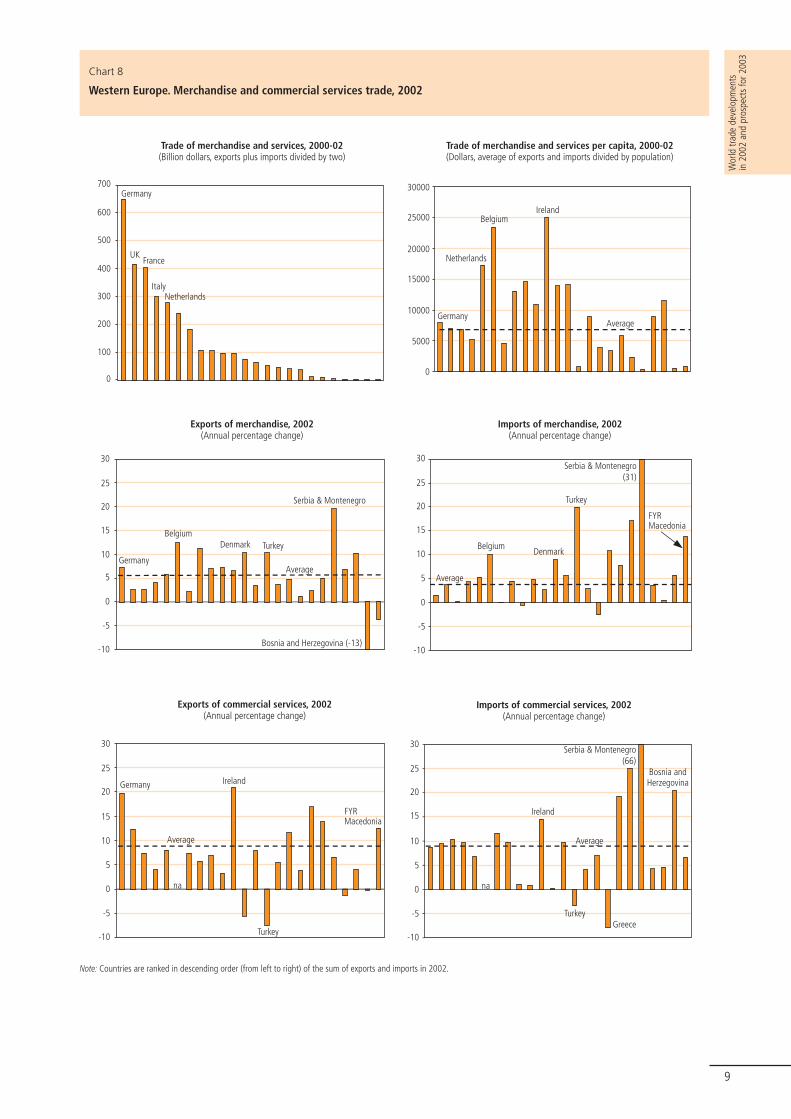
The data in Chart 8 reports the trade performances ofindividual Western European countries in 2002. In this region,the variation in annual trade growth rates by country are muchsmaller for both exports and imports of merchandise and servicestrade in Western Europe than in other regions. Only four out of29 countries reported a decrease in their exports or imports ofmerchandise and commercial services. Belgium, Denmark andTurkey reported above average export and import growth of theirmerchandise trade.
In the case of commercial services trade, outstandingdevelopments in this sector are increases of 20% by Germanyand Ireland. German exports of transportation services andinsurance services surged in 2002, while Ireland’s servicesgrowth is closely linked to the sharp rise in licence and patentfees collected by multinational companies located in Ireland.
Economic growth decelerated in the transition economies in2002. At nearly 4%, however, growth was still the strongest of allthe seven geographic regions discussed in this report. The RussianFederation, which accounts for nearly one half of the region’soutput, reported GDP growth of 4.5% and many membercountries of the Commonwealth of Independent States (CIS) andthe Baltic States recorded even stronger output growth. Only in
Central and Eastern Europe was growth limited to 2.5%. FDIinflows to the region increased in 2002, defying the globaldownward trend. The FDI inflows together with preparations forEU accession by the Central/Eastern European countries andBaltic States stimulated the region’s trade performance. Despitethe solid economic growth over the 1999-2002 period, under-employment is still widespread in the region. Inflation rates havecome down markedly, in particular, in the EU accession countries.In the Russian Federation, consumer price inflation was reduced,but remained at double-digit rates in 2002.
The transition countries’ merchandise imports rose, in realterms, by more than 10% in 2002. Although the rise ofmerchandise exports by 8% was somewhat less rapid thanimports, the expansion rate was still more than twice that ofGDP. Export prices increased slightly in 2002, while import prices,measured in dollar terms, remained unchanged. The dollar valueof the transition economies exports of merchandise andcommercial services rose by 10%. Import growth exceeded thatof exports for the second year in a row (see Table 5).
The expansion rate of major product groups in themerchandise exports of transition economies differed sharply.Exports of mining products (including fuels) recovered by 5%while those of manufactured goods and agricultural productsrose by more than 10%. There was a remarkable growth intransition economies exports of fuels, whereas world trade inthat product group stagnated. The outstanding rise in fuelexports can be largely attributed to the rise in Russia’s oiloutput, while OPEC oil production decreased by 6% in 2002.Exports of agricultural products to Western Europe increased by15% and account for 40% of the transition economies’ exportsin this product category. Among manufactured goods, exports ofautomotive products and office and telecom equipment rose byabout 15% in 2002. Clothing exports, which account for lessthan 4% of the region’s merchandise exports, rose by 6%.Available information on the breakdown of commercial servicesexports by category point to a very strong expansion oftransportation services. Travel receipts rose by 5%, only half therate of total services exports.
The strength of economic activity in the region did not lead toan above-average growth for intra-regional trade, as might havebeen expected. Transition economies’ exports to Western Europeand Asia rose at double-digit rates to $176 billion and $24.3billion respectively, while intra-regional trade rose by 5% to $80billion. The combined shipments to North America, Latin America,
Table 4
GDP and trade developments in Western Europe, 2002
(Annual percentage change)
GDP 2.1 2.6 3.5 1.3 0.9 2.1 2.8 3.5 1.5 0.9 - - - - -
Merchandise
Exports (value) 4 0 4 0 6 4 0 4 0 6 5 -1 7 1 6
Imports (value) 4 2 7 -2 4 4 2 6 -2 4 5 4 15 -4 1
Exports (volume) 5 3 9 2 1 5 3 9 2 1 4 1 13 4 2
Imports (volume) 5 5 8 0 0 5 5 8 0 -1 5 6 9 0 -1
Commercial services
Exports (value) 5 3 2 2 9 5 4 1 3 10 ... ... ... ... ...
Imports (value) 5 4 2 3 9 5 4 2 3 9 ... ... ... ... ...
Western Europe European Union (15) EU (15) excl. intra-trade
1990-00 1999 2000 2001 2002 1990-00 1999 2000 2001 2002 1990-00 1999 2000 2001 2002
Wor
ld tr
ade
deve
lopm
ents
in 2
002
and
pros
pect
s fo
r 200
3
9
Chart 8
Western Europe. Merchandise and commercial services trade, 2002
Note: Countries are ranked in descending order (from left to right) of the sum of exports and imports in 2002.
Trade of merchandise and services, 2000-02(Billion dollars, exports plus imports divided by two)
Exports of merchandise, 2002(Annual percentage change)
Exports of commercial services, 2002(Annual percentage change)
Imports of commercial services, 2002(Annual percentage change)
Imports of merchandise, 2002(Annual percentage change)
Trade of merchandise and services per capita, 2000-02(Dollars, average of exports and imports divided by population)
700
600
500
400
300
200
100
0
30000
25000
20000
15000
10000
5000
0
Germany
Germany
UKFrance
Italy
Netherlands
Netherlands
Ireland
Ireland
Belgium
Belgium
Average
Average
Average
30
25
20
15
10
5
0
-5
-10
Denmark
Turkey
Turkey
FYRMacedonia
Serbia & Montenegro(31)
Serbia & Montenegro(66)
30
25
20
15
10
5
0
-5
-10
30
25
20
15
10
5
0
-5
-10
30
25
20
15
10
5
0
-5
-10
na
Greece
Bosnia andHerzegovinaGermany Ireland
Average
Turkey
na
Germany
Belgium
Average
Denmark Turkey
Serbia & Montenegro
Bosnia and Herzegovina (-13)
FYRMacedonia

Wor
ld tr
ade
deve
lopm
ents
in 2
002
and
pros
pect
s fo
r 200
3
10
Africa and the Middle East accounted for only 10% of exports bytransition countries in 2002.
Trade developments of individual transition economies in 2002are reported in Chart 9. Although the Russian Federation remainsby far the largest trader in the region, the combined trade of theCzech Republic, Hungary and Poland, with their much smallereconomies, exceeded that of the Russian Federation. The highertrade intensity (as measured by per capita trade) of theCentral/Eastern European countries and Baltic States, incomparison to other transition economies, is also highlighted.
Out of 22 transition countries, 14 recorded an increase intheir exports or imports in excess of 10% in 2002. Azerbaijan isthe only country reporting a decrease in its merchandise exportsin 2002. In commercial services trade the performance across theregion is even stronger, with 16 economies recording a rise intheir commercial service trade (exports or imports) in excess of10%. Lower commercial services trade is only reported forTajikistan for exports and the Ukraine for imports.
Africa’s economic growth in 2002 at 2.7% remained belowexpectations and only marginally above its population growth.South Africa’s economy, accounting for more than one third ofthe region’s output, grew somewhat faster than the regionalaverage, while Nigeria, the most populous country in Africa,recorded a near stagnation in its output. Despite sluggish overallgrowth in the region, ten African economies expanded faster
than 5% and five countries recorded GDP growth above 10%.Unfavourable weather conditions and political turmoilcontributed to a steep fall in the GDP of Madagascar andZimbabwe. FDI inflows decreased sharply from their peak level in2001, largely due to developments in Morocco and South Africawhich, in 2001, attracted 45% of Africa’s FDI inflows5. Theprivatization of state-owned enterprises could attract substantialamounts of FDI, however the privatization process is “still slowand reluctant” in the region.6
Provisional 2002 trade data indicate a moderate expansion ofAfrica’s merchandise and commercial services trade. Prices forAfrica’s principal commodities recorded no uniformdevelopments. While the yearly averages of world market pricesfor petroleum, gold, coffee and cocoa beans edged up in 2002,those of non-ferrous metals, iron ore, tea and groundnutscontinued to soften. Despite a recovery in the second half of2002, cotton prices averaged for the full year, in nominal terms,their lowest level in 30 years. Total merchandise (and commercialservices) exports and imports increased by 2%, pointing to afurther loss in Africa’s share in world trade (see Table 6).
Africa’s trade picture brightens if one does not look at totaltrade but at the arithmetic average growth of African countries’
Table 5
GDP and trade developments in transition economies, 2002
(Annual percentage change)
GDP 2.3 4.3 7.0 4.5 3.7 3.2 2.6 3.8 2.7 2.5 1.6 6.4 10.0 5.0 4.3
Merchandise
Exports (value) 7 0 26 5 10 8 1 14 12 14 5 1 40 -2 4
Imports (value) 4 -12 14 11 11 9 -1 13 9 11 -6 -32 13 20 13
Exports (volume) 7 -2 17 8 8 ... ... ... ... ... ... ... ... ... ...
Imports (volume) 8 -9 16 15 11 ... ... ... ... ... ... ... ... ... ...
Commercial services
Exports (value) 2 -14 10 7 10 2 -11 14 6 3 -2 -27 5 10 22
Imports (value) 2 -8 15 12 16 4 1 11 7 13 -4 -19 22 14 16
Transition economies C./E. Europe Russian Federation
1995-00 1999 2000 2001 2002 1995-00 1999 2000 2001 2002 1995-00 1999 2000 2001 2002
Table 6
GDP and trade developments in Africa, 2002
(Annual percentage change)
GDP 2.1 2.6 3.1 3.1 2.7 1.7 2.0 3.5 2.8 3.0 2.3 2.9 2.9 3.2 2.5
Merchandise
Exports (value) 3 11 26 -6 2 3 1 12 -2 2 4 14 30 -7 2
Imports (value) 3 -4 1 2 2 5 -9 11 -5 4 2 -3 -1 4 2
Commercial services
Exports (volume) 5 9 0 0 2 4 -4 -3 -7 0 5 12 1 2 3
Imports (volume) 4 -3 5 2 2 4 2 0 -9 3 4 -3 5 3 2
Africa South Africa Other Africa
1990-00 1999 2000 2001 2002 1990-00 1999 2000 2001 2002 1990-00 1999 2000 2001 2002
5 UNCTAD, World Investment Report, 2003.6 Economic Commission for Africa, Economic Report on Africa 2003.

Wor
ld tr
ade
deve
lopm
ents
in 2
002
and
pros
pect
s fo
r 200
3
11
Note: Countries are ranked in descending order (from left to right) of the sum of exports and imports in 2002.
Trade of merchandise and services, 2000-02(Billion dollars, exports plus imports divided by two)
Exports of commercial services, 2002(Annual percentage change)
Imports of commercial services, 2002(Annual percentage change)
Imports of merchandise, 2002(Annual percentage change)
Trade of merchandise and services per capita, 2000-02(Dollars, average of exports and imports divided by population)
Russian Federation
Poland
Czech Rep.
Hungary
Ukraine
Czech Rep.
Hungary
Lithuania
Average
Hungary
Romania
Lithuania
Average
Average
Estonia (44)
Chart 9
Transition Economies. Merchandise and commercial services trade, 2002
Exports of merchandise, 2002(Annual percentage change)
100
90
80
70
60
50
40
10
20
30
0
5000
4500
4000
3500
3000
2500
2000
1500
1000
500
0
30
25
20
15
10
5
0
-5
30
25
20
15
10
5
0
-5
30
35
25
20
15
10
5
0
-5
30
35
25
20
15
10
5
0
-5
Slovak Rep.
Estonia
Latvia
Kyrgyz Rep.
Azerbaijan (97)
Russian Fed.
Lithuania
Lithuania
Average
Kazakhstan
Moldova
Czech Rep.
Romania
Armenia (48)
Average
Azerbaijan (-6)

Wor
ld tr
ade
deve
lopm
ents
in 2
002
and
pros
pect
s fo
r 200
3
12
merchandise exports and imports which exceeded worldmerchandise trade growth in 2002 by 5.5% and 7%respectively. The arithmetic average growth is far less affectedthan total merchandise trade by the trade contraction in Nigeria,and gives a more accurate view of the performance of the fifty-plus countries of this continent.
A breakdown of Africa’s merchandise exports by productindicates that exports of agricultural products rose by 9% to$22.1 billion in 2002. Agricultural products, which account for16% of total merchandise exports by region, expandedsignificantly to Western Europe and North America.7 Exports offuels are estimated to have stagnated at $69 billion, accountingfor almost one half of Africa’s total exports. Exports ofmanufactured goods only increased marginally in 2002, whileother semi-manufactures, among which diamonds are prominent,declined at double-digit rates. Africa’s exports of clothing ($7.4billion), machinery and transport equipment ($7 billion) and ironand steel ($2.9 billion) have expanded faster than world trade inthese categories.
Developments of Africa’s merchandise exports by regiondiffered strongly in 2002. Shipments to Western Europedecreased slightly while those to North America stagnated.Exports to Asia, however, increased by 10%. Despite recentdevelopments, Western Europe still accounted for more than one
half of African exports. North America and Asia account each for17% and thereby roughly twice as much as African intra-trade.
Chart 10 reports on African trade performance by individualcountries in 2002. The upper part of this chart highlights themajor traders as well as trade intensity measured by per capitatrade level. Out of the 50 African countries displayed in thisChart, 34 countries have a trade per capita level of less than$200 dollars.8
The annual variation of African countries’ merchandiseexports and imports shown in the lower part of Chart 10, revealsan extreme diversity in trade performance. Merchandise exportsincreased by more than 10% in 17 African countries in 2002,while 18 other African countries recorded a fall in their exports.Merchandise imports of 18 African countries increased by morethan 10%, while 15 other African countries reported a reductionin their imports. Among Africa’s major traders, only Nigeriarecorded a sharp contraction of both its exports and imports in2002. This trade development is closely linked to the cut inNigeria’s oil production agreed within OPEC.
7 In 2002, EU imports of agricultural products from Africa increased by 9% to$12.5 billion, while those of the United States rose by 8% to $1.2 billion.8 The world average trade per capita level in 2000-2002 was $1300 and $590 fordeveloping countries.
Note: Countries are ranked in descending order (from left to right) of the sum of exports and imports in 2002.
Trade of merchandise and services, 2000-02(Billion dollars, exports plus imports divided by two)
Imports of merchandise, 2002(Annual percentage change)
Trade of merchandise and services per capita, 2000-02(Dollars, average of exports and imports divided by population)
Exports of merchandise, 2002(Annual percentage change)
Chart 10
Africa. Merchandise and commercial services trade, 2002
35
30
25
20
15
10
5
0
30
25
20
15
10
5
0
-5
-10
-15
-20
30
25
20
15
10
5
0
-5
-10
-15
-20
3500
3000
2500
2000
1500
1000
500
0
South Africa
AlgeriaEgypt
Nigeria
Morocco
Egypt
NigeriaTunisia
Libya
Mauritius
Gabon
Equatorial GuineaSeychelles (6500)
Average
Nigeria (-35)
Equatorial Guinea
Seychelles (-35)
Average
Sierra Leone(45)
Nigeria
Morocco
Equatorial Guinea
Average
Rwanda (-34)
Angola Ghana Congo
Congo, D.R. Lesotho (40)

Wor
ld tr
ade
deve
lopm
ents
in 2
002
and
pros
pect
s fo
r 200
3
13
Table 7
GDP and trade developments in the Middle East, 2002
(Annual percentage change)
Merchandise
Exports (value) 2 12 7 -20 29 44 -8 0
Imports (value) 5 4 4 -3 -1 12 6 7
Commercial services
Exports (value) 8 10 9 6 10 18 -10 -1
Imports (value) 3 5 4 -11 1 9 -6 1
1990-95 1995-00 1990-00 1998 1999 2000 2001 2002
Political conflicts continued to hamper economic developmentand the trade expansion of the Middle East. Economic growthremained subdued. Oil production decreased by more than 5%while gas production continued to expand. Israel, the major non-oil exporting economy in the region, recorded a further decline ofits GDP, as economic activity, in particular tourism, had beennegatively affected by insecurity linked to the prevailing civilstrife.
Merchandise exports of the region are estimated to havestagnated at $245 billion. It is estimated that the decrease in thevolume of oil exports was partly offset by higher oil prices andincreased gas supplies. Fuels exports are estimated to havedecreased by 3% and account for about 70% of the region’smerchandise exports. Chemicals (mainly petrochemicals) havebecome the second biggest merchandise export category in theMiddle East. Shipments of chemicals increased by about 5% to
Trade of merchandise and services, 2000-02(Billion dollars, exports plus imports divided by two)
Imports of merchandise, 2002(Annual percentage change)
Trade of merchandise and services per capita, 2000-02(Dollars, average of exports and imports divided by population)
Exports of merchandise, 2002(Annual percentage change)
Average
Saudi Arabia
Saudi Arabia
UAE
UAE
Israel
Israel
Iran Rep. of
Iran Rep. of
Kuwait
Kuwait
Syria
Jordan
Bahrain
Saudi Arabia
Average
Average
UAE (16000)
Israel
Israel
Iran
Kuwait
Kuwait
SyriaJordan
Yemen
Bahrain
10000
9000
8000
7000
6000
5000
4000
3000
2000
1000
0
Chart 11
Middle East. Merchandise and commercial services trade, 2002
Note: Estimated data for Iraq are not shown separately but included in the regional aggregate.
80
70
60
50
40
30
20
10
0
30
25
20
15
10
5
0
-5
30
25
20
15
10
5
0
-5
Oman
Yemen
Qatar
Qatar (14000)
Iran, Islamic Rep. of

Wor
ld tr
ade
deve
lopm
ents
in 2
002
and
pros
pect
s fo
r 200
3
14
Table 8
GDP and trade developments in Asia, 2002
(Annual percentage change)
GDP 3.3 2.5 4.2 1.5 1.5 1.5 0.2 2.8 0.4 -0.7 6.7 6.4 7.1 3.4 5.4
Merchandise
Exports (value) 9 7 18 -9 8 5 8 14 -16 3 11 7 21 -7 10
Imports (value) 8 9 23 -7 6 5 11 22 -8 -3 10 9 25 -7 9
Exports (volume) 8 6 16 -4 11 3 2 9 -10 8 8 6 16 -4 11
Imports (volume) 8 10 17 -2 10 5 10 11 -1 2 8 10 16 -2 9
Commercial services
Exports (value) 9 5 12 -1 7 5 -2 13 -7 2 11 7 13 2 8
Imports (value) 7 5 8 -2 3 3 3 1 -7 0 11 6 13 1 5
Asia Japan Developing Asiaa
1995-00 1999 2000 2001 2002 1995-00 1999 2000 2001 2002 1995-00 1999 2000 2001 2002
a Defined as Asia excluding Japan, Australia and New Zealand.
10% and amounted to $16 billion. Merchandise imports rose onaverage by a further 7% reaching $178 billion in 2002 (seeTable 7).
Merchandise exports of the Middle East to Asia stagnated in2002, the rise in exports to developing Asia of 6% being offsetby a decrease in shipments to Japan. As the Middle East’sexports to North America and Western Europe decreased, theshare of Asian developing countries in the Middle East’s exportsrose to 30%, equal to the combined share of North America andWestern Europe.
Import growth continued to be sustained by the large tradesurplus in the region. The high level of oil prices since 2000resulted in sharply higher export earnings which, after a shorttime lag, led to substantial increases in imports (see Chart III.15).The stagnation of the Middle East’s exports and imports ofcommercial services is the outcome of two divergentdevelopments which offset each other. There is a markedcontraction of Israel’s commercial services exports (-13%) andimports (-9%) while for most of the other countries in theregion, services trade expanded strongly. The Middle Eastregion’s exports and imports of commercial services areestimated to have each risen by more than 5% if one excludesIsrael from the regional aggregate values.
Middle East trade by country is reported in Chart 11. Sevencountries in the region show a rather high trade per capita whencompared with developing countries in general. However, forthree others (Islamic Republic of Iran, Syrian Arab Republic andYemen) trade per capita remained below $400 dollars. Mostcountries in the region recorded a small increase or a decline intheir merchandise export earnings in 2002 with the twoexceptions of the Syrian Arab Republic and Jordan who recordedstrong increases. A contrasting picture is provided formerchandise imports which rose strongly in most countries in theregion, but stagnated in Israel.
In 2002, economic growth in Asia was limited to only 1.5%,unchanged from the preceding year and only half the average raterecorded for the 1990s. The aggregate growth of Asia conceals thedivergent economic performance of Japan and of all the othereconomies in the Asia-Pacific region. While Japan’s economyslowed further and recorded a slightly negative GDP growth,developing Asia, Australia and New Zealand have seen anacceleration in their GDP growth. Developing Asia’s 5.5% GDPgrowth in 2002 matched the average growth of the second half of
the 1990s. Among the Asian developing economies, the recoverywas less pronounced in Hong Kong, China, Singapore and ChineseTaipei which had already experienced a decline or stagnation oftheir output in the preceding year. Despite the recovery, under-employment and low investment levels remain a concern in mostof the Asian economies and are important factors in explaining thepursuit of expansionary fiscal policies in many countries.
There was a further decline in FDI inflows to Asian developingcountries if China is excluded from the total. In Indonesia,foreign disinvestment continued for the fifth year in a row. Theunabated strength of FDI flows into China and the sluggishnessof FDI flows to other Asian developing economies is leading to aconcentration of FDI inward stocks in three economies (i.e.China, Hong Kong, China and Singapore). In 2002, these threeeconomies already accounted for more than three quarters of thetotal FDI inward stock in developing Asia in 2002.
Asia’s trade rebounded strongly from its contraction in 2001.Despite the strength of the recovery in its merchandise tradeexport and import growth (by 8% and 6% respectively) in 2002,recovery remained incomplete as the respective trade valuesremained below their 2000 peak levels.
The weakness of the nominal trade recovery has to be partlyattributed to the further decrease in the region’s dollar exportand import prices. The depreciation of the yen against the USdollar, on an annual average basis, contributed to the nearly 5%decrease in Japanese export prices. In real terms, Asia’s exportsand imports are estimated to have expanded by about 10% andthus more than twice that of world trade. The recovery in Asia’scommercial services trade was somewhat weaker than that ofmerchandise trade. Commercial services exports rose faster thanimports, a development which can be found across all threemajor services categories. For both exports and imports,transportation services was the least dynamic component ofservices trade while travel and other commercial servicesexpanded somewhat faster than the average rates for totalcommercial services (see Table 8).
Asia’s merchandise exports by main product groups showquite distinct developments in 2002: Exports of mining productsrose by 2%, agricultural products by 7% and manufacturedgoods by 8.5%. The region’s exports of office and telecomequipment, automotive products, chemicals and iron and steelproducts all increased by more than 10%. Exports of otherconsumer goods, clothing and textiles increased between 3.5%

Wor
ld tr
ade
deve
lopm
ents
in 2
002
and
pros
pect
s fo
r 200
3
15
a Includes significant re-exports.Note: Countries are ranked in descending order (from left to right) of the sum of exports and imports in 2002.
Trade of merchandise and services, 2000-02(Billion dollars, exports plus imports divided by two)
Exports of commercial services, 2002(Annual percentage change)
Imports of commercial services, 2002(Annual percentage change)
Imports of merchandise, 2002(Annual percentage change)
Trade of merchandise and services per capita, 2000-02(Dollars, average of exports and imports divided by population)
Chart 12
Asia. Merchandise and commercial services trade, 2002
700
600
500
400
300
200
100
0
Exports of merchandise, 2002(Annual percentage change)
Japan
China
Hong Kong, Chinaa
Korea, Rep. of
Taipei, ChineseSingaporea
Malaysia
India
Hong Kong, China(46000)
Singapore (49000)
India
10000
9000
8000
7000
6000
5000
4000
3000
2000
1000
0
Average
PakistanIndonesia
AustraliaNew Zealand
Brunei (12000)
Macao, China
Japan
China
India
Average
Brunei 30
25
20
15
10
5
0
-5
-10
-15
30
25
20
15
10
5
0
-5
-10
-15
30
25
20
15
10
5
0
-5
-10
30
25
20
15
10
5
0
-5
-10
Cambodia
Viet NamPhilippines
Nepal
Lao People'sD.R. (-18)
China
Average
nana
New Zealand
Philippines(-17)
Thailand
Sri Lanka
China
China
India
India
Average
Average
CambodiaViet NamPhilippines
Philippines
Sri Lanka
na nana
Nepal (-23)
Lao People's D.R.
Papua NewGuinea

Wor
ld tr
ade
deve
lopm
ents
in 2
002
and
pros
pect
s fo
r 200
3
16
Table 9
Intra-regional trade of major RTAs, 1995 and 2002
(Billion dollars, percentage)
EU (15) 1509 24.1 64.0 61.6 65.2 61.9
NAFTA (3) 626 10.0 46.0 56.5 37.7 38.1
AFTA (10) 97 1.6 25.5 24.0 18.8 23.6
CEFTA (7) 19 0.3 14.6 12.2 11.3 10.2
MERCOSUR (4) 10 0.2 20.5 11.5 18.1 17.0
ANDEAN (5) 5 0.1 12.3 10.2 12.9 13.9
Total 2266 36.3 - - - -
Intra-trade Share of intra-trade in:
RTA Value Share in Exports Importsworld exports 1995 2002 1995 2002
and 7%. In a number of product groups, however, the recoveryobserved in 2002 was not strong enough to offset the declinesin the preceding year (e.g. office and telecom equipment,clothing, textiles, iron and steel and mining products).
Asia’s merchandise exports by destination reveal that therebound of intra-regional trade was the principal factor in overalltrade expansion. The 9% growth of intra-Asian trade exceededthe expansion rate of shipments to North America and WesternEurope of 5% and 3% respectively. The share of intra-regionaltrade recovered and accounted for nearly one half of Asia’sexports but still less than in 1996, before the Asian financialcrisis. Asia’s combined exports to Latin America, the transitioneconomies, Africa and the Middle East accounted for 8.5% oftotal exports (see Table III.71).
Chart 12 reports on Asian trade developments by country in2002. In the right upper part of the chart one can find the tradeper capita level of individual Asian economies. A marked contrastis apparent between the high-income economies, mainly groupedat the left side of the chart, with a high level of trade per capitaand the low-income countries with a large population such asBangladesh, China, India, Indonesia, Myanmar and Pakistan whichreport a per capita trade level ranging between nearly $400(Indonesia) and $80 dollars (e.g. Bangladesh, India and Myanmar).
One of the main features of Asia’s merchandise tradedevelopment in 2002 was the contrasting trade growth of thetwo largest traders in the region. Although Japan’s traderecovered from the steep contraction of 2001, its export growthof 3% remained sharply lower than the average growth rate ofthe region and its imports continued to shrink. China’s exportsand imports, however, both expanded by more than 20%.Above-average rates of growth for both exports and imports arereported for Cambodia, India, the Philippines and Viet Nam.Cambodia’s trade performance is outstanding among the smallertraders in Asia which, in many cases, recorded a contraction oftheir exports or imports in 2002.
Three of the four high-income newly industrialized developingeconomies in Asia (e.g. Hong Kong, China, Singapore andChinese Taipei) recorded below average trade growth not onlyfor merchandise but also for commercial services trade. Thefourth economy, the Republic of Korea, experienced strong traderecovery in 2002 with its exports and imports matching theregional average growth rates.
China, India and the Philippines recorded above-averagegrowth of their commercial services exports as they did formerchandise trade. However, in respect of commercial servicesimports, only China recorded double-digit growth while those ofIndia and the Philippines decreased.
5. Merchandise trade of major regionaltrade agreements
The tendency to conclude new RTAs continued unabated in2002 and in the first half of 2003. At the end of 2002, 176 RTA’swere in force and notified to the WTO, 17 more than at the endof the preceding year. Recent RTAs are often spread acrossgeographic regions and are increasingly of a bilateral type.Reviewing RTA trade developments, one should bear in mindthat in many RTAs only a fraction of intra-regional trade isconducted at preferential terms and duty free.9
Trade developments of six major plurilateral reciprocal RTAs in2002 are reviewed below. Four observations highlight prominenttrade aspects of these RTAs:
- Intra-trade developments of the six RTAs were very muchaffected by the overall trade developments of their region.Consequently, the value of intra-trade decreased in the threeRTAs located in South and North America with its lacklustretrade growth in 2002 (ANDEAN, MERCOSUR and NAFTA), butincreased in the three RTAs situated in Europe and Asia (EU,CEFTA and AFTA) where trade expanded faster than the globalaverage (see Table I.9).
- In 2002, there was no clear trend in respect to the relativedevelopment of intra-RTA trade. The share of intra-tradeincreased in a majority of RTAs on the import side but not on theexport side. AFTA is the only RTA which reported a recovery ofthe intra-regional trade share for both exports and imports in2002.
- The relative weight of intra-regional trade of the majorplurilateral RTAs has not increased in 2002. Intra-regional tradeof the six RTAs combined expanded as fast as world tradeleaving the share of these trade flows in world merchandisetrade (exports plus imports) unchanged at 35%.
- Neither the short- nor the medium-term developments(1995-2002) point to a general increase of the share of intra-RTA trade. For the EU and CEFTA, the share of intra-regionaltrade decreased in the medium term, partly due to the dynamicbilateral trade generated by the EU enlargement process.MERCOSUR’s relative decline in intra-regional trade isparticularly pronounced on the export side and reflected theimpact of the regional financial crisis. On the import side, theshare of intra-regional trade started to decline with the sharpdevaluation of the Brazilian currency in 1999. The share of AFTA’s
9 For a detailed discussion of the economic, political and institutional aspects ofRTAs see WTO, World Trade Report 2003, pp. 46-66.

Wor
ld tr
ade
deve
lopm
ents
in 2
002
and
pros
pect
s fo
r 200
3
17
intra-regional trade increased steadily on the import side since1995. However, for exports, the corresponding share has not yetregained the level prevailing before the Asian financial crisis.NAFTA is the only RTA which recorded a significant increase inthe share of intra-trade between 1995 and 2002 (see Table 9).
The summary provided in Table 9 also reveals the markeddifferences in size and integration among the six plurilateralRTAs. For the EU and NAFTA, more than one half of theirexports are intra-regional while for the other four RTAs, thecorresponding share ranges between 24% and 10%. Thedifferences between the two groups of RTAs on the import sideare, in general, as pronounced as on the export side. Only forRTAs with a significant trade imbalance, the intra-trade sharesdiffer between exports and imports (i.e. NAFTA andMERCOSUR).
6. Trade developments in the first halfof 2003 and prospects
In the first half of 2003 world merchandise exports rose by15% in dollar terms over the corresponding period in 2002, astrong acceleration compared to the average 4% annual growthin 2002. The main factor behind this buoyant nominal tradegrowth has been the depreciation of the US dollar against thecurrencies of major traders in Europe and Asia in the first sixmonths of 2003 (see Chart 1). Higher oil and non-fuelcommodity prices also contributed to the dollar price increase ininternational trade.
The exports and imports of Western Europe and the transitioneconomies expanded by more than 20% in dollar terms, largelydue to price and exchange rate developments. In Asia, wherecurrency changes against the dollar were more limited, exportsrose by 15% and imports by nearly 20%. China’s trade remainedthe strongest component of Asia’s trade. China’s imports growthis reported to have increased by 45% and exceeded in value tothat of Japan. Partly due to higher oil prices, Japan’s importgrowth (17%) was stronger than that of exports (13%). The sixnewly industrialized economies expanded both exports andimports by 12.5%. Latin America’s imports remained unchangedfrom the preceding year’s level while exports recorded anincrease of 8%, thereby strengthening the region’s trade surplus.In contrast to the Latin American trade balance, the NorthAmerican trade deficit continued to widen in the first half of2003, as imports rose by 10%, or twice as fast as exports.
Adjusted for price and exchange rate changes, a different andless bright trade picture emerges. OECD countries’ real trade ingoods and services (exports plus imports) expanded by only 4%in the first half of 2003. In addition, most of this increase has tobe attributed to the trade expansion in the second half of 2002as OECD exports have stagnated from the fourth quarter of2002 through the second quarter of 2003 (on a seasonallyadjusted basis). OECD countries’ imports were less sluggish andpicked up in the second quarter of 2003, mainly due to higherimports of the United States (see Chart 13).
Developments in the first half of 2003 and improvements ofthe leading indicators in the third quarter lead to a projection ofworld merchandise trade growth of 3%, basically unchangedfrom the preceding year’s rate.
Exports of goods and servicesGDP Imports of goods and services
OECD Countries
-10
-5
0
5
10
15
20
Q1 2001 Q1 2002 Q1 2003
-20
-15
-10
-5
0
5
10
15
20
25
30
Q1 2001 Q1 2002 Q1 2003
European Union
-10
-5
0
5
10
15
20
Q1 2001 Q1 2002 Q1 2003
-20
-15
-10
-5
0
5
10
15
20
25
30
Q1 2001 Q1 2002 Q1 2003
United States Japan
Chart 13
Real GDP and trade growth of OECD countries, 2001-03
(Percentage change on a quarter to quarter basis)