Embed Size (px)
Citation preview

1
Hantie van HeerdenElash Mistry14 Nov 2007
Overview of Experience for Long-term Insurers in SA
2006

2
Why are we here?
To provide information to practicing life actuaries on representative SA Statutory
Valuation Method bases reported in 2006

3
What will we show you?
• Brief overview of the LT insurance market in 2006
• Review the representative:– Reported AOS results (C7),– Reported valuation assumptions (G10.x) and– Reported actual experience (B - statements) for
certain key elements in a valuation basis

4
Overview of the LT Insurance Market in 2006

5
Overview: rankings
InsurerIndustr
y
% of Marke
t Assets
Rank on Assets
2006 2005 2004
Old Mutual Typical 28.3% 1 1 1
Sanlam Typical 17.1% 2 2 2
Liberty Typical 12.1% 3 3 3
Momentum Typical 11.3% 4 4 4
Investment Solutions Linked 8.0% 5 5 5
Metropolitan Life Typical 4.6% 6 6 6
Investec Assurance Linked 2.1% 7 7 8
Allan Gray Life Linked 1.9% 8 10 13
Capital Alliance Life Typical 1.5% 9 8 9
Investec Employee Benefits Typical 1.3% 10 9 7

6
Overview: by year-end
9 10
16
35
1
32
0
100
200
300
400
500
600
700
800
900
Feb Mar Jun Aug Sep Nov Dec
Month of year-end
As
se
ts in
R'b
n
0
5
10
15
20
25
30
35
Nu
mb
er
of
ins
ure
rs
Total assets Number of insurers

7
Overview: by license
R235 bn premiums | R220 bn benefits | 94% retention
3 4 2
100
52 3 1
88
8
119 118
0
50
100
150
Assistance Disability Fund Health Life SinkingFund
R'b
n
Gross premiums Gross benefits

8
Overview: per business class
R235 bn premiums | R220 bn benefits | R1,146 bn assets
291
68 82
438
201
66
0
50
100
150
With-profitbusiness
With-profitannuities
Without-profitannuities
Linked Marketrelated
OtherPre
miu
ms
an
d b
en
efi
tsR
'bn
050100150200250300350400450500
As
se
ts R
'bn
Gross premiums Gross benefits Total Assets

9
Overview: growth by license
Growth from 2005 to 2006 by type of licence
18%12%
16% 14%11%
32%
19%14%
4%
14%
21%
31%
57%
49%
0%
10%
20%
30%
40%
50%
60%
Assistance Disability Fund Health Life SinkingFund
TotalGross
Gross premiums Gross benefits

10
Overview: growth per business class
Growth from 2005 to 2006 per type of business
2%
24%
54%
10%
31%
3%
13%
53%
23%
29%
17%15%
4%8%
46%
5%
27%26%
0%
10%
20%
30%
40%
50%
60%
With-profitbusiness
With-profitannuities
Without-profitannuities
Linked Market related Total
Gross premiums Gross benefits Total Assets

11
Overview: over time
Amounts in R‘bn 2006 2005 2004 2003
Total assets 1,281 1,069 906 817
Total liabilities 1,170 975 817 736
Excess assets 111 94 89 81
CAR before management action
69 65 63 73
CAR after management action
29 27 27 32
Funding factor (Excl CAR)
1.10 1.10 1.11 1.11
CAR Cover 3.89 3.48 3.28 2.55
CAR after / CAR before 42% 41% 43% 44%

12
Overview: key indicators
IndustryTotal R'bn 2006
Total R'bn 2005
Total R'bn 2004t l r a n c
Number of active insurers
31 11 6 9 12 4 73 71 70
Net premiums received
69% 29% 1.3% 0.3% 0.5% 0.6% 220 166 151
Net benefits paid
68% 29% 1.0% 0.2% 0.4% 1.0% 210 160 162
Acquisition expenses
94% 0.4% 1.7% 0.7% 1.0% 2.1% 16 15 12
Operational expenses
94% 2.5% 1.3% 0.7% 0.7% 0.8% 13 10 8t = typical; l = linked; r = reinsurer; a = assistance; n = niche; c = captive

13
Overview: asset composition per industry
Asset classes t l r a n c All
Equities 45% 44% 0% 7% 59% 21% 45%
Fixed interest 20% 13% 62% 5% 29% 32% 19%
CIS 12% 21% 2% 51% 3% 13% 14%
Cash 9% 14% 24% 22% 7% 25% 10%
Property 4% 0% 0% 1% 0% 0% 3%
Other 10% 7% 12% 12% 2% 9% 9%
Investment Yield 22.1% 31.3% 6.2% 14.6% 24.8% 13.8% 23.1%
Total Assets (R'bn)
1,060 200 8 1 9 3 1,281

14
Capital Adequacy Requirement (CAR)

15
Distribution of CAR
80%
2%
18%
0%
20%
40%
60%
80%
MCAR TCAR OCAR
% of Active Insurers % of Total CAR
16
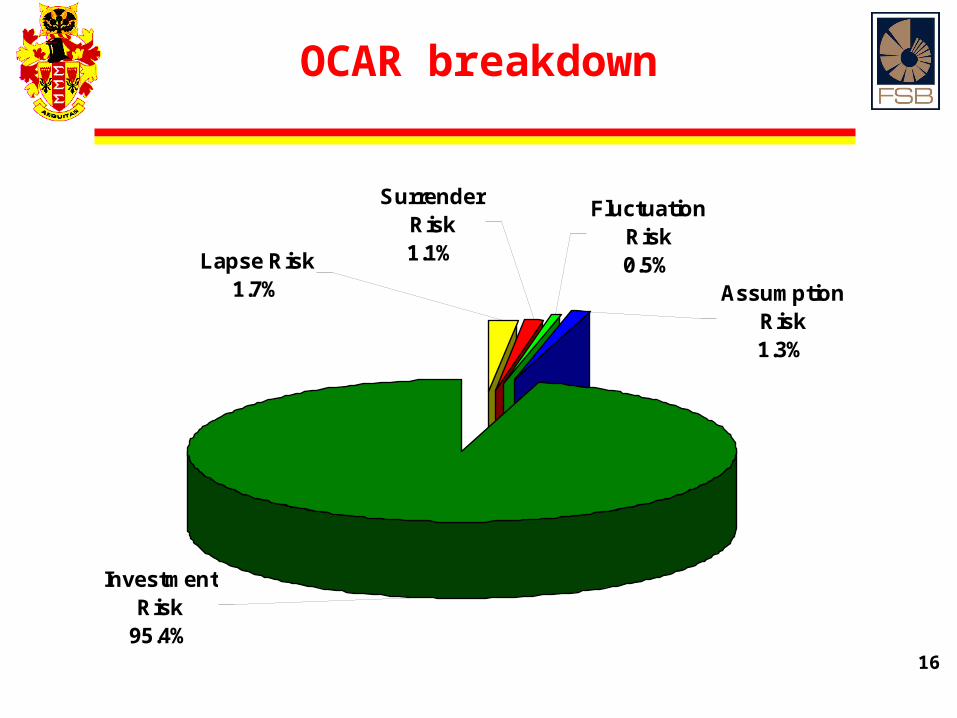
OCAR breakdown
Investment Risk
95.4%
Fluctuation Risk0.5%
Surrender Risk1.1%Lapse Risk
1.7% Assumption Risk1.3%
17
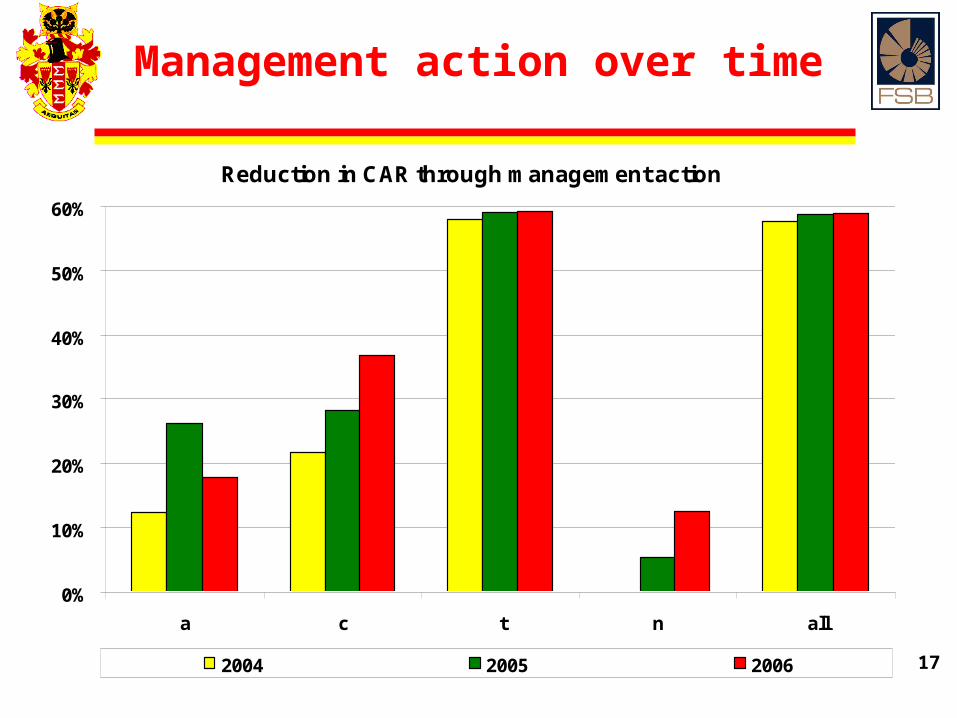
Management action over time
Reduction in CAR through management action
0%
10%
20%
30%
40%
50%
60%
a c t n all
2004 2005 2006

18
Proportion of insurers that applymanagement action
Industry
Number ofinsurers usingmanagement
action
Total numberof insurers
Proportion
Assistance 1 9 11%
Captives 1 4 25%
Niche 3 12 25%
Typical 11 31 35%
Total 16 73 22%

19
Management action
• Examples of management actions used:– Reduce future bonuses– Reduce/Remove non-vested bonuses– Reduce bonus smoothing reserve– Implement additional surrender charge

20
Analysis of Surplus (AOS)
21
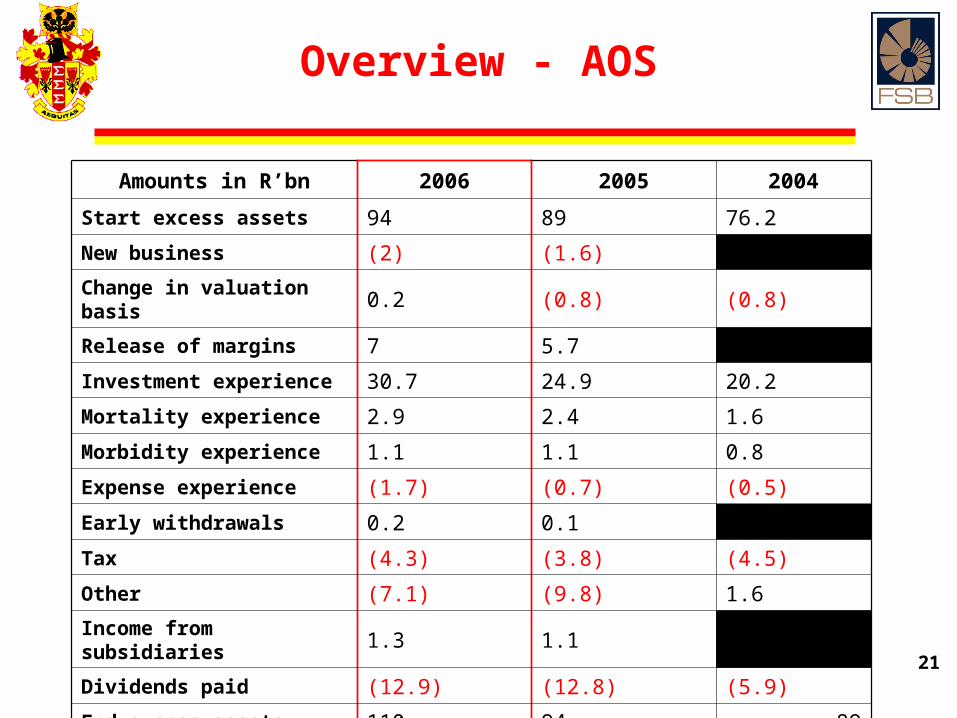
Overview - AOS
Amounts in R’bn 2006 2005 2004
Start excess assets 94 89 76.2
New business (2) (1.6)
Change in valuation basis 0.2 (0.8) (0.8)
Release of margins 7 5.7
Investment experience 30.7 24.9 20.2
Mortality experience 2.9 2.4 1.6
Morbidity experience 1.1 1.1 0.8
Expense experience (1.7) (0.7) (0.5)
Early withdrawals 0.2 0.1
Tax (4.3) (3.8) (4.5)
Other (7.1) (9.8) 1.6
Income from subsidiaries 1.3 1.1
Dividends paid (12.9) (12.8) (5.9)
End excess assets 110 94 89
22
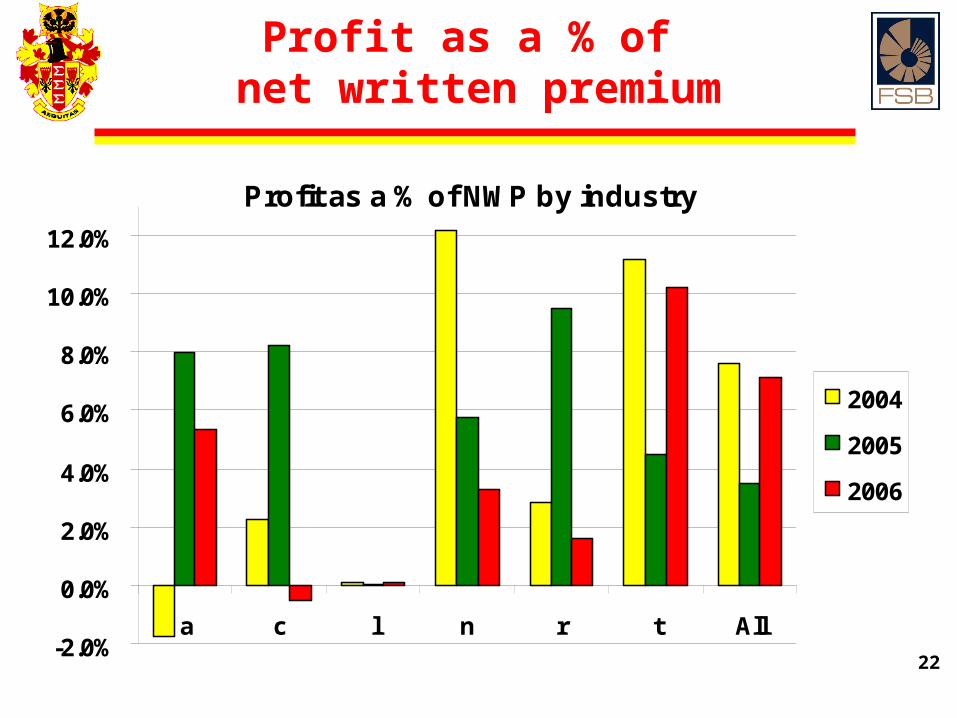
Profit as a % of net written premium
Profit as a % of NWP by industry
-2.0%
0.0%
2.0%
4.0%
6.0%
8.0%
10.0%
12.0%
a c l n r t All
2004
2005
2006

23
Expenses

24
Split of expense losses
Split of expense losses between individual business, group business and shareholders
15% 13% 14%
5% 13% 3%
82%74%79%
0%
20%
40%
60%
80%
100%
2004 2005 2006
YearIndividual Business Group Business Shareholders

25
Expense inflation assumption
Individual Business
9.0% 9.5%
7.0% 7.0%
2.0%
5.0%
3.4% 3.9%
9.6%
7.2%
5.0%5.5% 5.1%
11.0%
4.3%
0.0%
2.0%
4.0%
6.0%
8.0%
10.0%
12.0%
2002 2003 2004 2005 2006
Year
Ex
pe
ns
e In
fla
tio
n
Maximum Minimum Weighted Average

26
Actual expense inflation
Individual Business
9.9
2.8
10.7
5.1
12.9
5.2
13.5
6.3
0
2
4
6
8
10
12
14
16
Total Acquisition Expenses Total Operating Expenses
R'b
n
2003 2004 2005 2006
8%
21%
4%
79%3%
21%

27
Initial per policy expense assumption
Initial Expenses for Recurring Premium Policies (Individual Business)
With-profit annuities
With-profits
Without-profit annuities
Other
Market-related
Linked
R 600
R 900
R 1,200
R 1,500
R 1,800
R 2,100
R 2,400
R 2,700
R 3,000
2004 2005 2006

28
Actual initial expense(individual business)
Industry
Average Initial Expense
per new policy
Average Premium per new policy
2006Change
from 20052006
Change from 2005
Assistance business
R 309 101% R 837 -35%
Cell captives R 586 -25% R 263 -8%
Linked insurers R 7,736 -11% R 561,622 5%
Niche insurers R 105 49% R 441 75%
Typical insurers R 2,382 -7% R 9,358 -1%
All R 1,831 4% R 7,530 8%

29
Actual initial expense(individual business)
Industry
Initial expense as a % of new business net premium
2006 2005 2004
Assistance business 37% 12% 49%
Cell captives 223% 270% 54%
Linked insurers 1% 2% 1%
Niche insurers 24% 28% 9%
Typical insurers 25% 27% 27%
Total 24% 25% 25%

30
Actual initial expense(individual business)
Business Class
Initial expense as % of net premium
2006 2005
New Business Premium
s
Total Premium
s
New Business Premium
s
Total Premium
s
With-profit business
108% 12% 104% 11%
With-profit annuities
2% 2% 2% 2%
Without-profit annuities
2% 2% 2% 2%
Linked 5% 4% 5% 5%
Market-related 17% 9% 23% 14%
Other 74% 36% 68% 36%
All 24% 14% 24% 15%
31
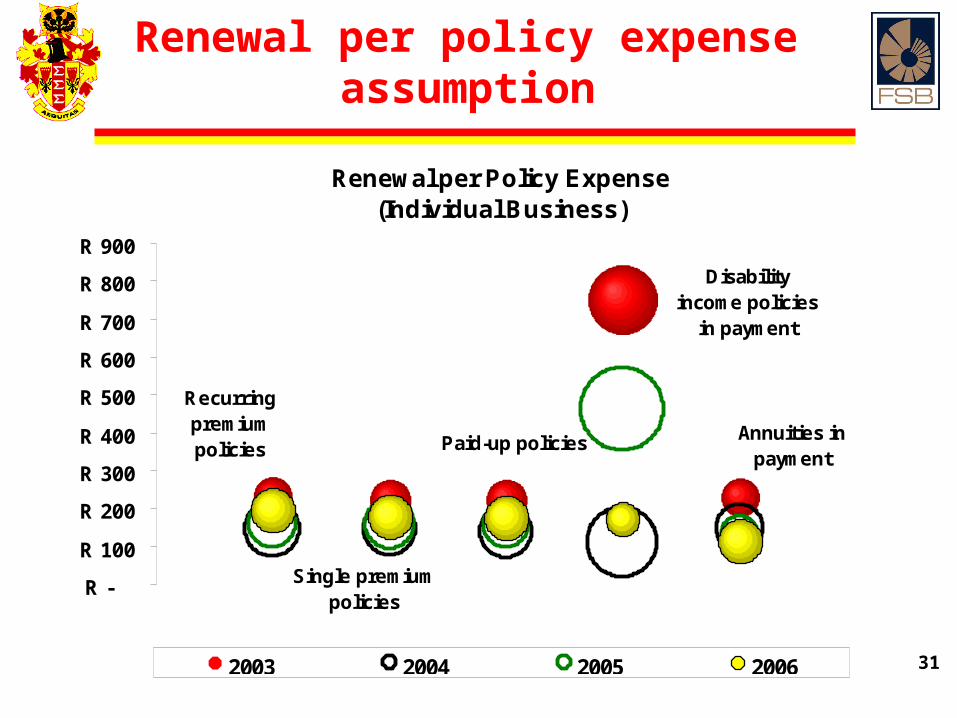
Renewal per policy expense assumption
Renewal per Policy Expense (Individual Business)
Recurring premium policies
Single premium policies
Paid-up policies
Disability income policies
in payment
Annuities in payment
R -
R 100
R 200
R 300
R 400
R 500
R 600
R 700
R 800
R 900
2003 2004 2005 2006

32
Actual operating expense(individual business)
IndustryAverage OperatingExpense per policy
Operating Expenses as % of
Total Net Premium
2006 2005 2006 2005
Assistance business
R 42 R 50 17% 16%
Cell captives R 40 R 31 5% 4%
Linked business R 303 R 302 0% 0%
Niche insurers R 22 R 20 7% 8%
Typical insurers R 255 R 220 7% 6%
Total R 226 R 199 6% 6%

33
Central Discount Rates

34
Assumed central discount rate
Individual Business
Linked MarketOther
Without-profit
annuities
With-profit annuities
With-profit business
5%
6%
7%
8%
9%
10%
11%
Ce
ntr
al D
isc
ou
nt
Ra
te
2006 2005

35
Observed investment yield
Individual BusinessWith-profit business Market
Without-profit annuities
Linked
With-profit annuities Other
0%
5%
10%
15%
20%
25%
30%
35%
Inv
es
tme
nt
Yie
ld
2006 2005

36
Cumulative distribution of assumed real returns
0.00%
20.00%
40.00%
60.00%
80.00%
100.00%
120.00%
<0.5
%
<1.0
%
<1.5
%
<2.0
%
<2.5
%
<3.0
%
<3.5
%
<4.0
%
<4.5
%
<5.0
%
<5.5
%
<6.0
%
<6.5
%
<7.0
%
<7.5
%
<8.0
%
2006 2005

37
Mortality

38
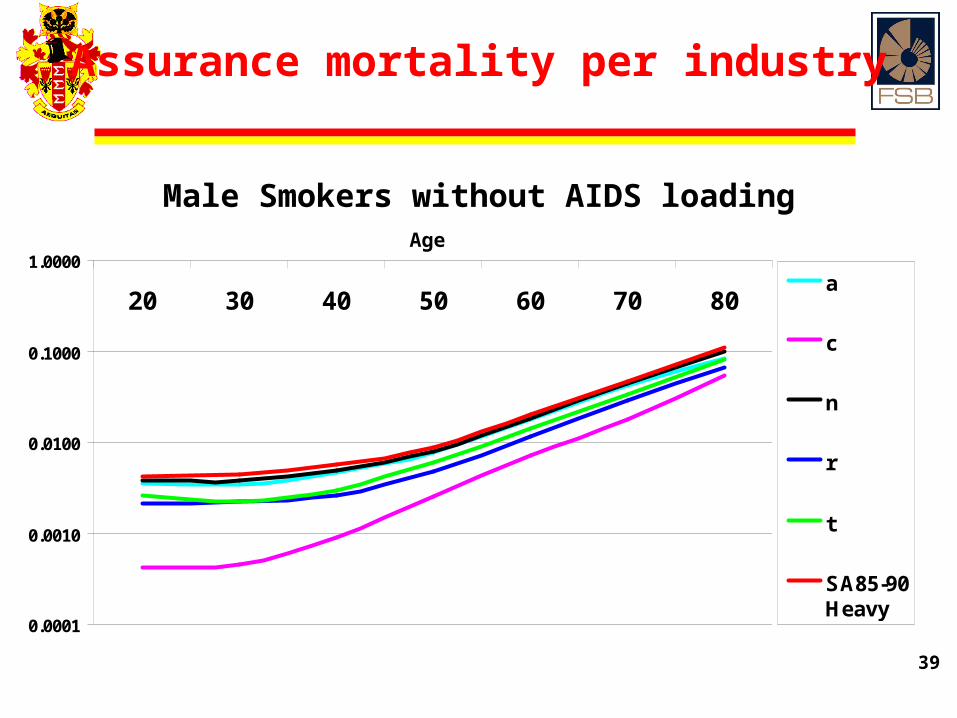
Mortality
• In the graphed rates, we tried to determine representative mortality rates
• For assured lives we used SA85/90 ultimate 100% heavy to place weighted rates in perspective.
• For annuitants we used a(55) to put weighted average rates in perspective.
39
Assurance mortality per industry
Male Smokers without AIDS loading
0.0001
0.0010
0.0100
0.1000
1.0000
20 30 40 50 60 70 80
Age
a
c
n
r
t
SA85-90Heavy

40
Change in mortality for assured lives from 2005 to 2006
Smoker without AIDS loading
99%
100%
101%
102%
103%
104%
105%
106%
20 25 30 35 40 45 50 55 60 65 70 75 80 85 90 95 100
Age
Male Female

41
AIDS loading comparison for 2005 and 2006
Mortality for Assured Lives Male Smoker
100%
110%
120%
130%
140%
150%
160%
25 30 35 40 45 50
Age
2005
2006

42
AIDS loading by industry
Mortality for Assured Lives Male Smoker
100%
120%
140%
160%
180%
200%
220%
240%
260%
280%
25 30 35 40 45 50
Age
Assistance
Niche
Reinsurers
Typical

43
Annuitant mortality by industry
Male Smoker
0.001
0.010
0.100
1.000
50 60 70 80Age a
c
r
t
a(55)

44
Change in mortality for annuitants from 2005 to 2006
93%
94%
95%
96%
97%
98%
99%
20 25 30 35 40 45 50 55 60 65 70 75 80 85 90 95 100
Age
Male Female

45
Mortality: actual vs. expected
• For assurance products:
– Individual: 79% (79%) actual vs. expected
– Group: 90% (93%) actual vs. expected
• For annuity products:
– Individual: 114% (114%) actual
– Group: 87% (93%) actual vs. expected
* Figures in brackets represent 2005 assumptions

46
Morbidity: actual vs. expected
• For lump sum disability:– Individual: 59% (73%)
– Group: 80% (80%)
• For income disability:– Individual: 71% (43%)
– Group: 49% (81%)
* Figures in brackets represent 2005 assumptions

47
Withdrawal Rates

48
Assumed lapses per business class
Individual Business
0%
5%
10%
15%
20%
25%
30%
1st 2nd 3rd 1st 2nd 3rd 1st 2nd 3rd 1st 2nd 3rd
With-Profit business Linked Market related Other
As
su
me
d L
ap
se
Ra
te
2004 2005 2006

49
Assumed surrenders per business class
Individual Recurring Premium Policies
Min
Max
Weighted Avarage
0%
5%
10%
15%
20%
25%
2005 2006 2005 2006 2005 2006 2005 2006
With-Profitbusiness
Linked Market related Other
As
su
me
d S
urr
en
de
r R
ate

50
Assumed lapses per industry
Other Individual Business
0%5%
10%15%20%
25%30%
35%40%
a c n t
As
su
me
d L
ap
se
Ra
te
1st year 2nd year 3rd year

51
Observed withdrawals per industry
Individual Business
4%
9%
0%
10%
20%
30%
a c g l n All a c g l n All
Lapse rates Surrender rate
Ob
se
rve
d R
ate
s
2004 2005 2006

52
Thank you
Hantie van HeerdenHantie van Heerden(012) 422 2801(012) 422 2801
Elash MistryElash Mistry(012) 428 8164(012) 428 8164
www.fsb.co.za