Embed Size (px)
Citation preview

1
Groundwater Pollution
Week 5 – 0407 Investigating the Site and Monitoring

2
Some Notes derived from
1.34 Waste Containment and Remediation Technology , As taught in: Spring 2004, by Dr. Peter Shanahan , MIT OpenCourseWare, Creative Commons License, http://ocw.mit.edu/OcwWeb/Civil-and-Environmental-Engineering/1-34Spring2004/CourseHome/

3
revision of previous week

4
Information to help with the clean-up of contamination can be found at http://clu-in.org/ .
For example http://clu-in.org/characterization/technologies/solvr.cfm
helps decide what is the best characterization technique.

5

6
You can click on the different technologies for more information.

7

8
You can also look at each method.

9
We then investigate the contaminant.Where is the contaminant plume?
What is in the plume?
How big is the plume?
How long has it been there?
Where is it going?
How fast will it go?

10
Q. What is a contaminant plume?

11
The contaminant plume is where the contaminant is dissolved in the ground water.

12
Usually - The contaminant plume is where the contaminant is dissolved in the ground water.
Sometimes - It can also mean where the vapor is dissolved in the air.

13
Q. Give a meaning for phase.

14
Vadose zone
Floating
Groundwater
The phases are when the pollutant is solid (solid phase), liquid (liquid phase), vapor (gaseous phase), or dissolved in the water (aqueous phase).

15
In the vadose zone contaminants could be present as:
Vapors in the void ( 공간 )
Free product in the void
Dissolved in the soil moisture ( 수분 )
Adsorbed ( 흡착하다 ) onto the soil matrix
Floating on top of the capillary fringe
Q. Draw a picture of each of the above.

16
Collecting vapor samples from contaminated areas in the unsaturated zone
http://toxics.usgs.gov/photo_gallery/photos/bimidji/bimidji10_lg.jpg

17
Adsorption (n.)( 흡착 ) is when molecules of gas, liquid, or dissolved solids stick to a surface.
Adsorb (v)
Adsorbed (v. and adj)

18
Sorption

19
Contaminants could be in the saturated zone as:Dissolved ( 녹이다 ) in the
groundwaterAdsorbed onto the aquifer materialSitting on top of the bedrock (for
dense nonaqueous phase liquids [DNAPLs])
Q. Draw diagrams of each of these.
20
NAPLs coat the Soil Particles

21
NAPLs fill the Voids

22
The first steps are called remedial ( 개선의 ) investigation ( 연구 ) (RI) activities ( 행위 )Removal of contamination sourcesDoing some soil borings ( 구멍뚫기 )Making groundwater monitoring ( 모니터 ) wellsSoil sample collection and analysisGroundwater sample collection and analysisAquifer testing
23
Questions to be answered by site
characterization
Nature and extent of contamination—
where is it?
What is future migration and control—
where is it going?
What are receptors and their risk—
what harm will it do?
What are technical options for remediation—
how do we fix it?
Waste Containment and Remediation Technology

24
Data needed from site characterization
1. Contaminant sources – research history as well as collect samples
2. Extent of contamination – need to understand transport as well
3. Hydrogeologic setting – use to understand items 1 and 2
4. Restoration potential – how easy is it to clean up?
Waste Containment and Remediation Technology

25
Stages of investigation
Stage 1 – scoping study
Is there a problem? How bad is it?
Stage 2 – prepare field study plan
Includes sampling and analysis, health and safety, and quality assurance plans
Stage 3 – conduct on-site sampling and analysis
Stage 4 – interpretation, assessment, modeling
(Stages 3 and 4 may be repeated several times)
Stage 5 – design remedial action
Waste Containment and Remediation Technology

26
First steps in understanding a site1. Understand geographic setting, topography, nearby water bodies2. Get background geologic dataConsult ground-water atlas of the area.Get reports on geology, hydrology, meteorologyCheck for reports from government geological surveys
Waste Containment and Remediation Technology

27
First steps in understanding a site
3. Understand site use and history
Where were chemicals handled or disposed?
What site structures or activities are potential sources?
What chemicals are and were handled?
Waste Containment and Remediation Technology

28
The following types of data are collected:Types of contaminants present in soil and
groundwaterConcentrations of contaminants in the
samplesVertical and areal spread of contaminant
plumes in soil and groundwaterVertical and areal spread of free-floating
product or the DNAPLsSoil characteristics including the types of
soil, density, moisture content, etc.Groundwater elevationsDrawdown data collected from aquifer tests

29http://mn.water.usgs.gov/bemidji/results/fact-sheet.pdf

30
Engineering calculations help site remediation.
These could include:Mass and volume of soil removed during tank
removalMass and volume of contaminated soil left in
the vadose zoneMass of contaminants in the vadose zoneMass and volume of the free-floating productVolume of contaminated groundwaterMass of contaminants in the aquiferGroundwater flow gradient and directionHydraulic conductivity of the aquifer

31
Understanding the geology and physical contaminants.

32
Geophysical Methods
Method ObjectElectrical resistivity Map conductive or nonconductive
contaminants; stratigraphy
Electromagnetic induction Map conductive or nonconductive contaminants; metal objects; stratigraphy
Seismic refraction Stratigraphy (top of bedrock); depth to ground water
Seismic reflection High resolution mapping of top of bedrock
Ground penetrating radar (GPR)
Buried objects (plastic and metal); stratigraphy; depth to ground water
Magnetometry Buried metal objects
Gravity survey Overburden thickness; landfill boundaries
Waste Containment and Remediation Technology

33
Ground penetrating radar
Waste Containment and Remediation Technology

34
Electromagnetic Induction
Waste Containment and Remediation Technology

35
Electrical resistivity
Waste Containment and Remediation Technology

36
Seismic
reflection
Waste Containment and Remediation Technology

37
Geophysics
suite
Waste Containment and Remediation Technology

38
Sampling the gas phase

39
Soil gas sampling system
Waste Containment and Remediation Technology

40
Output from field GC
Waste Containment and Remediation Technology

41
Soil gas survey results
Waste Containment and Remediation Technology

42
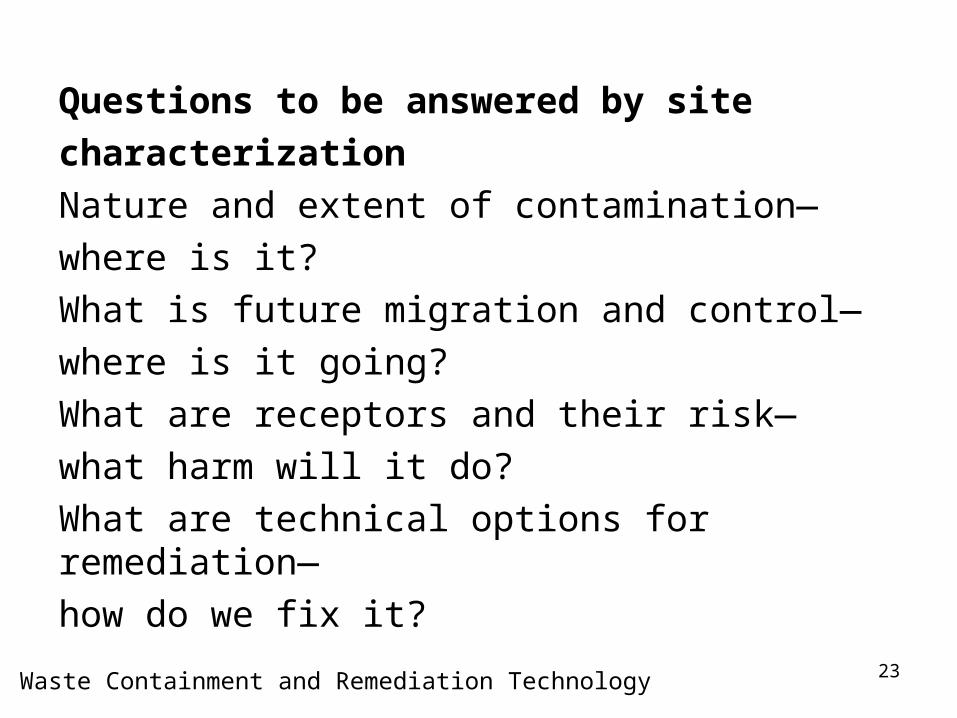
There are two main methods of getting into the ground.
- Drilling
- Direct Push
43Drilling deep test hole http://nevada.usgs.gov/adrs/images/photos/studyareas/StudyAreasandExperimentalS/study9.html

44

45
Drilling techniques
Waste Containment and Remediation Technology

46
Hollow Stem Auger
Waste Containment and Remediation Technology

47
Direct-push
technology
(Geoprobe)
Waste Containment and Remediation Technology

48
Direct-push monitoring well
Waste Containment and Remediation Technology

49
Direct push - Advantages • Inexpensive to install, replace and
abandon• Minimal waste “cuttings”• Fewer well development wastes• Rapid installation and site
characterization• Less worker exposure to contaminants• Representative chemistry and field
parameter measurements• Improved landowner relations

50
Direct push - Disadvantages • Not applicable when cobbles or
consolidated materials are present• May not be accepted for long term
monitoring in most states• Debate remains regarding aquifer
testing capabilities• Well diameter limitations• Pump diameter limitations• Potential for higher turbidity in
wells with no filter pack

51Demonstration/Validation of Long-Term Monitoring Using Wells Installed by Direct Push Technologies and Enhanced Low-Flow Groundwater Sampling Methods. DoD 2009

52
Percentage Savings for DP Well Installations Based on Well Diameter and Depth.
Demonstration/Validation of Long-Term Monitoring Using Wells Installed by Direct Push Technologies and Enhanced Low-Flow Groundwater Sampling Methods. DoD 2009

53
http://www.frtr.gov/decisionsupport/index.htm
http://www.clu-in.org/characterization/technologies/solvr.cfm