Embed Size (px)
Citation preview

Giovanni - the Bridge between Data and Science 1
Zhong Liua,b and James Ackera,c 2
aNASA Goddard Earth Sciences (GES) Data and Information Services Center (DISC) 3
bCenter for Spatial Information Science and Systems (CSISS), George Mason University 4
cAdnet Systems, Inc. 5
6
Walstad, Ryan (GSFC-610.2)[ADNET SYSTEMS INC] Wednesday, May 31, 2017 at 10:32:37 AM Eastern Daylight Time
https://ntrs.nasa.gov/search.jsp?R=20180000167 2020-06-29T08:41:31+00:00Z

7
8
Capsule: Using satellite remote sensing data sets can be a daunting task. A Web-based tool, 9 Giovanni, has been developed to facilitate access, visualization, and exploration of NASA Earth 10
science data sets 11
Abstract 12
This article describes new features in the Geospatial Interactive Online Visualization 13
ANd aNalysis Infrastructure (Giovanni), a user-friendly online tool that enables visualization, 14
analysis, and assessment of NASA Earth science data sets without downloading data and 15
software. Since the satellite era began, data collected from Earth-observing satellites have been 16
widely used in research and applications; however, using satellite-based data sets can still be a 17
challenge to many. To facilitate data access and evaluation, as well as scientific exploration and 18
discovery, the NASA Goddard Earth Sciences (GES) Data and Information Services Center 19
(DISC) has developed Giovanni for a wide range of users around the world. This article 20
describes the latest capabilities of Giovanni with examples, and discusses future plans for this 21
innovative system. 22
23
Walstad, Ryan (GSFC-610.2)[ADNET SYSTEMS INC] Wednesday, May 31, 2017 at 10:32:37 AM Eastern Daylight Time
24
Over Earth’s vast oceans and remote continents, traditional large-scale observations of 25
the atmosphere, ocean, and land surface can be difficult and costly to both deploy and maintain, 26
and are therefore impractical to provide adequate long-term observational data for research and 27
applications. This is particularly true as global observations become increasingly important for 28
understanding global change processes. Satellite instruments can overcome surface observation 29
limitations by synoptically acquiring Earth science data. NASA’s Earth Observing System (EOS) 30
project [NASA 2016] is a global observation campaign, consisting of a coordinated series of 31
polar-orbiting, low-inclination satellites intended for long-term global observations, potentially 32
enabling improved understanding of Earth’s geophysical systems. 33
[Break-up text: Giovanni simplifies satellite data access. Downloading data and software is not 34
required.] 35
Accessing and using NASA data is a challenge to many researchers, due to issues such as 36
heterogeneous data formats, complex data structures, large volume data storage, special 37
programming requirements, diverse analytical software options, etc. that often require a 38
significant investment in time and resources, especially for novices. By facilitating data access 39
and evaluation, as well as promoting open access to create a level playing field for non-funded 40
scientists, NASA data can be more readily used for scientific discovery and societal benefits. To 41
advance this goal, the NASA Goddard Earth Sciences (GES) Data and Information Services 42
Center (DISC) developed the Geospatial Interactive Online Visualization ANd aNalysis 43
Infrastructure (Giovanni) [GES DISC 2016]. Giovanni has assisted researchers around the world 44
publish over 1300 peer-reviewed papers [Acker 2016] in a wide range of Earth science 45
disciplines and other areas. 46
Walstad, Ryan (GSFC-610.2)[ADNET SYSTEMS INC] Wednesday, May 31, 2017 at 10:32:37 AM Eastern Daylight Time
A Brief History 47
Giovanni [Liu et al. 2007, Acker and Leptoukh 2007, Berrick et al. 2009] was initiated 48
and developed for faster and easier access to, and evaluation of, data sets at the GES DISC after 49
collecting and analyzing feedback from user support. The first Giovanni instance was the 50
Tropical Rainfall Measuring Mission (TRMM) Online Visualization and Analysis System 51
(TOVAS). TOVAS served TRMM Multi-satellite Precipitation Analysis (TMPA) and other 52
global precipitation data sets. As TOVAS gained popularity, inclusion of more satellite data sets 53
in Giovanni was requested. To address this demand, multiple discipline- or mission-based data 54
portals were created. The current Giovanni has evolved further, featuring a new unified Web 55
interface to support interdisciplinary Earth system research, allowing synergistic use of data sets 56
from different satellite missions. 57
[Break-up text: Giovanni has helped publish over 1300 peer-reviewed papers] 58
Giovanni Data Set Summary 59
Giovanni provides access to numerous satellite data sets archived and distributed by the 60
GES DISC, concentrated primarily in the areas of atmospheric composition, atmospheric 61
dynamics, global precipitation, hydrology, and solar irradiance. The data are from NASA 62
heritage and EOS missions including Terra, Aqua, Aura, Solar Radiation and Climate 63
Experiment (SORCE), TRMM, Global Precipitation Measurement (GPM), UARS (Upper 64
Atmosphere Research Satellite), Earth Probe Total Ozone Mapping Spectrometers (TOMS), 65
AIRS (Atmospheric Infrared Sounder), MISR (Multi-angle Imaging SpectroRadiometer), 66
SeaWiFS (Sea-viewing Wide Field-of-view Sensor), and data assimilation collections (including 67
Walstad, Ryan (GSFC-610.2)[ADNET SYSTEMS INC] Wednesday, May 31, 2017 at 10:32:37 AM Eastern Daylight Time

Modern-Era Retrospective Analysis for Research and Applications (MERRA), Global Land Data 68
Assimilation System (GLDAS), North American Land Data Assimilation System (NLDAS)). 69
The Federated Giovanni partnership provides access to data sets archived at other NASA data 70
centers, thereby broadening data access opportunities. 71
[Break-up text: Giovanni offers over 1300 variables covering a wide range of Earth science 72
disciplines] 73
Over 1300 variables are currently available in Giovanni. The Web interface has both 74
Keyword and Faceted Search capabilities (Fig. 1) for locating variables of interest. For example, 75
a search for ‘precipitation’ returns over 100 related variables (Fig. 1). By using facets, one can 76
filter for variables based on satellite missions (TRMM, GPM) (Fig. 1), instruments, spatial or 77
temporal resolution, etc. 78
The operating lifetimes of low Earth orbiting (LEO) satellites are often quite limited (~5 79
years), far less than the thirty years defined by WMO (the World Meteorological Organization) 80
for developing climatology data sets. Some users, however, may still wish to conduct 81
preliminary studies with these satellite data sets to obtain information on spatial distribution and 82
inter-seasonal variation. Giovanni provides the capability to derive climatological maps and time 83
series based on user-defined time periods. 84
Analytical Features 85
[Break-up text: Commonly used analytical methods are available in Giovanni] 86
Many commonly used analytical and plotting capabilities, for capturing spatial and 87
Walstad, Ryan (GSFC-610.2)[ADNET SYSTEMS INC] Wednesday, May 31, 2017 at 10:32:37 AM Eastern Daylight Time
temporal characteristics of data sets, are available in Giovanni. Mapping options include time-88
averaging, animation, accumulation (precipitation), time-averaged overlay of two data sets, and 89
user-defined climatology. For time series, options include area-averaged, differences, seasonal, 90
and Hovmöller diagrams. Cross-sections, applicable to 3-D data sets from AIRS and MERRA, 91
include latitude-pressure, longitude-pressure, time-pressure, and vertical profile. For data 92
comparison, Giovanni has built-in processing code for data sets that require measurement unit 93
conversion and regridding. Commonly used comparison functions include map and time-series 94
differences, as well as correlation maps and X-Y scatter plots (area-averaged or time-averaged). 95
Zonal means and histogram distributions can also be plotted. Samples of the analytical and 96
plotting features are shown in Fig. 2. 97
Visualization Features 98
Visualization features include interactive map area adjustment; animation; interactive 99
scatter plots; data range adjustment; choice of color palette; contouring; and scaling (linear or 100
log). The on-the-fly area adjustment feature allows an interactive and detailed examination of a 101
result map without re-plotting data. Animations are helpful to track evolution of an event or 102
seasonal changes. Interactive scatter plots allow identification and geolocation of a point of 103
interest in a scatter plot. Adjustments of any of these plots provide customized options to users. 104
Other Features 105
To support increasing socioeconomic and GIS activities in Earth sciences, shapefiles 106
have been added for countries, states in the United States, and major watersheds around the 107
world. Available functions for shapefiles are time-averaged and accumulated maps (Fig. 2b), 108
Walstad, Ryan (GSFC-610.2)[ADNET SYSTEMS INC] Wednesday, May 31, 2017 at 10:32:37 AM Eastern Daylight Time

area-averaged time series, and histogram. Land-sea masks have been recently added. 109
[Break-up text: Data in Giovanni can be downloaded for further analysis] 110
All data files involved in Giovanni processing are listed and available in the lineage page. 111
Available image formats are PNG, GEOTIFF, and KMZ (Keyhole Markup Language) that can 112
be used for different applications and software packages; for example, KMZ files are 113
conveniently imported into Google Earth (Fig. 2b) where a rich collection of overlays are 114
available. All input and output data are available in NetCDF, which can be handled by many 115
off-the-shelf software packages. Furthermore, users can bookmark URLs generated by Giovanni 116
processing for reference, documentation, or sharing with other colleagues. 117
Conclusion and Future Plans 118
With the latest features and examples described in this overview article, we have shown 119
how Giovanni simplifies access, evaluation, and exploration of NASA satellite data sets. More 120
examples are available in the Giovanni publication list [Acker 2016]. Despite these 121
achievements, improvements in Giovanni are both in development and under consideration, to 122
accommodate increasing demand for additional analytical and plotting capabilities, more data 123
sets, and advanced information technologies to make data exploration simple and productive. 124
Potential enhancements to the system, currently being evaluated, include visualization 125
and analysis of satellite orbital data sets (Level 2 data), acquisition of complementary data sets 126
from other NASA data centers, and analysis methods specifically for multi-satellite and multi-127
sensor measurements. Currently, data sets in Giovanni consist of variables mapped on uniform 128
space-time grid scales, so non-gridded or satellite orbital data sets (commonly providing higher 129
Walstad, Ryan (GSFC-610.2)[ADNET SYSTEMS INC] Wednesday, May 31, 2017 at 10:32:37 AM Eastern Daylight Time
spatial and temporal resolution) are not currently available in the system. Adding orbital data sets 130
to Giovanni could contribute to research requiring increased data resolution and coverage. Data 131
sets from other data centers, including current and future satellite missions, would further 132
enhance Giovanni’s capabilities for analysis of the integrated Earth system. Note that barriers 133
still exist in the optimization of Giovanni for interdisciplinary studies and data intercomparison. 134
For example, terminologies in data sets can be significantly different between Earth science 135
communities, requiring coordinated efforts to reach consensus and develop standards for uniform 136
data products. 137
The NASA-wide User Registration System (URS) will be another useful feature in 138
Giovanni. It is expected to enhance the Giovanni user experience; for example, with the URS, 139
users can set frequently-used preferences in their profiles, record and retrieve their personal 140
history of data set exploration, and establish their own data collections. For data product 141
developers, their test data can be uploaded and compared with observations and other well-142
established data sets in Giovanni to identify issues in their products, a useful capability to 143
improve data quality. Giovanni developers will also be able better understand their users 144
through profiles and other statistics collected from the URS, in order to develop more user-145
friendly services. 146
Acknowledgements: 147
We would like to recognize the team effort of all past and current members at the GES 148
DISC for their contributions to the development of Giovanni. Thanks extend to data set 149
algorithm developers and many users for their feedback and suggestions. The GES DISC is 150
funded by NASA's Science Mission Directorate (SMD) 151
Walstad, Ryan (GSFC-610.2)[ADNET SYSTEMS INC] Wednesday, May 31, 2017 at 10:32:37 AM Eastern Daylight Time

References: 152
Acker, J. G., and G. Leptoukh, 2007: Online analysis enhances use of NASA earth science data. 153
Eos. Trans. Amer. Geophys. Union, 88 (2), 14–17. DOI: 10.1029/2007EO020003 154
Acker, J.G., 2016: GIOVANNI Publications by Year, available online: 155
http://disc.sci.gsfc.nasa.gov/giovanni/additional/publications 156
Berrick, S. W., G. Leptoukh, J. D. Farley, and H. Rui, 2009: Giovanni: A Web service 157
workflow-based data visualization and analysis system. IEEE Trans. Geosci. Remote Sens., 47 158
(1), 106–113. DOI: 10.1109/TGRS.2008.2003183 159
GES DISC, 2016, Giovanni, available online: http://giovanni.gsfc.nasa.gov/ 160
Liu, Z., H. Rui, W. Teng, L. Chiu, G. Leptoukh, and G. Vicente, 2007, Online visualization and 161
analysis: A new avenue to use satellite data for weather, climate and interdisciplinary research and 162
applications. Measuring Precipitation from Space - EURAINSAT and the future, Advances in 163
Global Change Research, 28, 549-558. DOI: 10.1007/978-1-4020-5835-6 164
NASA, 2016, NASA’s Earth Observing System (EOS), available online: http://eospso.nasa.gov/ 165
Walstad, Ryan (GSFC-610.2)[ADNET SYSTEMS INC] Wednesday, May 31, 2017 at 10:32:37 AM Eastern Daylight Time

166
Figure 1. The Giovanni web interface. Over 1300 variables are available for visualization and 167 analysis. Commonly used analytical methods and visualization are available. Keyword and faceted 168 search capabilities allow locating variables of interest with ease. Shapefiles are available for 169 supporting GIS data exploration. Both input and output data can be downloaded for further 170 analysis. 171
Figure 2. Examples of maps and plots generated from Giovanni: a) July 2016, the hottest month 172 ever - MODIS day surface temperatures (in Kelvin); b) Accumulated rainfall (in mm) from 173 IMERG-Late Run, imported in Google Earth as KMZ, showing a record breaking flood event in 174 Louisiana in August 2016; c) The TMPA precipitation climatology (1998-2015, in mm/day) for 175 the boreal summer (June, July, and August); d) El Niño reduces the phytoplankton (mg m-3) 176 productivity of the Pacific coastal waters off Central America during the 2015-16 winter; e) 177 Hovmöller diagram of TMPA precipitation (in mm/day) in the tropical region (5°S - 5°N) showing 178 ENSO events between 1998 - 2015; f) NASA's Aura satellite views nitrogen dioxide (NO2, 1/cm) 179 from Fort McMurray wildfires in Alberta, Canada in May 2016; and g) Quasi-Biennial Oscillation 180 (QBO) seen from AIRS daily tropical temperature (in Kelvin) time series between 2002-08 at 100 181 hPa. 182
183 184
Walstad, Ryan (GSFC-610.2)[ADNET SYSTEMS INC] Wednesday, May 31, 2017 at 10:32:37 AM Eastern Daylight Time
185
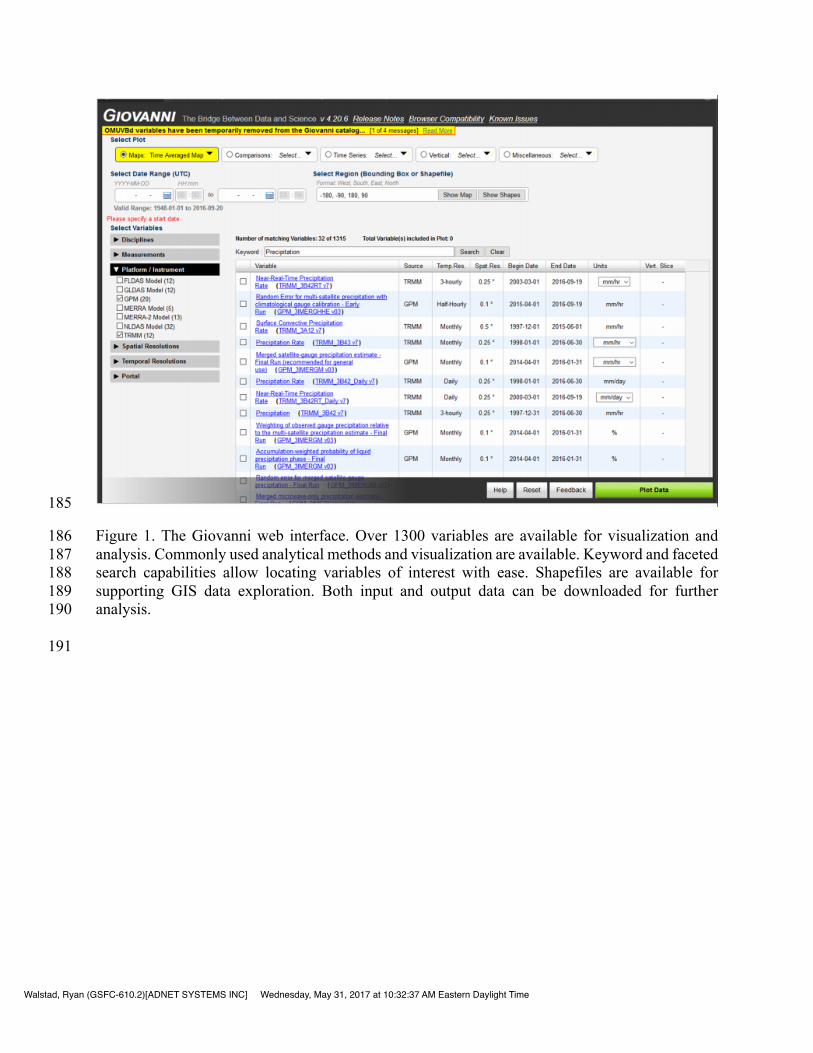
Figure 1. The Giovanni web interface. Over 1300 variables are available for visualization and 186 analysis. Commonly used analytical methods and visualization are available. Keyword and faceted 187 search capabilities allow locating variables of interest with ease. Shapefiles are available for 188 supporting GIS data exploration. Both input and output data can be downloaded for further 189 analysis. 190
191
Walstad, Ryan (GSFC-610.2)[ADNET SYSTEMS INC] Wednesday, May 31, 2017 at 10:32:37 AM Eastern Daylight Time

192
Figure 2. Examples of maps and plots generated from Giovanni: a) July 2016, the hottest month 193 ever - MODIS day surface temperatures (in Kelvin); b) Accumulated rainfall (in mm) from 194 IMERG-Late Run, imported in Google Earth as KMZ, showing a record breaking flood event in 195 Louisiana in August 2016; c) The TMPA precipitation climatology (1998-2015, in mm/day) for 196 the boreal summer (June, July, and August); d) El Niño reduces the phytoplankton (mg m-3) 197 productivity of the Pacific coastal waters off Central America during the 2015-16 winter; e) 198 Hovmöller diagram of TMPA precipitation (in mm/day) in the tropical region (5°S - 5°N) showing 199 ENSO events between 1998 - 2015; f) NASA's Aura satellite views nitrogen dioxide (NO2, 1/cm) 200 from Fort McMurray wildfires in Alberta, Canada in May 2016; and g) Quasi-Biennial Oscillation 201 (QBO) seen from AIRS daily tropical temperature (in Kelvin) time series between 2002-08 at 100 202 hPa. 203
204
Walstad, Ryan (GSFC-610.2)[ADNET SYSTEMS INC] Wednesday, May 31, 2017 at 10:32:37 AM Eastern Daylight Time


![Boccaccio] Baldelli, Giovanni Batista - Vita Di Giovanni Boccaccio](https://img.dokumen.tips/doc/110x75/557212a3497959fc0b90a2eb/boccaccio-baldelli-giovanni-batista-vita-di-giovanni-boccaccio.jpg)


