Embed Size (px)
Citation preview

1
1 Food Packaging and Shelf Life
Gordon L. RobertsonUniversity of Queensland and Food•Packaging•EnvironmentBrisbane, Australia
CONTENTS
1.1 Introduction ..............................................................................................................................11.1.1 Role of Food Packaging ................................................................................................1
1.1.1.1 Containment ...................................................................................................21.1.1.2 Protection .......................................................................................................21.1.1.3 Convenience ...................................................................................................21.1.1.4 Communication ..............................................................................................31.1.1.5 Attributes .......................................................................................................3
1.1.2 Package Environments..................................................................................................31.1.2.1 Physical Environment ....................................................................................31.1.2.2 Ambient Environment ....................................................................................31.1.2.3 Human Environment ......................................................................................4
1.2 Food Packaging Materials ........................................................................................................41.2.1 Polymer Permeability ...................................................................................................41.2.2 Transmission Rate.........................................................................................................71.2.3 Surface Area:Volume Ratio ..........................................................................................8
1.3 Shelf Life ................................................................................................................................ 101.3.1 Defi nitions................................................................................................................... 101.3.2 Factors Controlling Shelf Life .................................................................................... 11
1.3.2.1 Product Characteristics ................................................................................ 121.3.2.2 Distribution and Storage Environment ........................................................ 121.3.2.3 Package Properties ....................................................................................... 12
1.3.3 Shelf Life Determination ............................................................................................ 14
1.1 INTRODUCTION
1.1.1 ROLE OF FOOD PACKAGING
Food packaging is essential and pervasive: essential because without packaging the safety and qual-ity of food would be compromised, and pervasive because almost all food is packaged in some way. Food packaging performs a number of disparate tasks: it protects the food from contamination and spoilage; it makes it easier to transport and store foods; and it provides uniform measurement of contents. By allowing brands to be created and standardized, it makes advertising meaningful and large-scale distribution and mass merchandising possible. Food packages with dispensing caps, sprays, reclosable openings, and other features make products more usable and convenient.
A distinction is usually made between the various “levels” of packaging. A primary package is one that is in direct contact with the contained product. It provides the initial, and usually the major,
78445_C001.indd 178445_C001.indd 1 11/3/2009 5:19:56 PM11/3/2009 5:19:56 PM
© 2010 by Taylor and Francis Group, LLC

2 Food Packaging and Shelf Life
protective barrier. Examples of primary packages include metal cans, paperboard cartons, glass bottles, and plastic pouches. It is frequently only the primary package that the consumer purchases at retail outlets. This book will confi ne itself to the primary package.
A secondary package contains a number of primary packages, for example, a corrugated case. It is the physical distribution carrier and is sometimes designed so that it can be used in retail outlets for the display of primary packages. A tertiary package is made up of a number of secondary pack-ages, the most common example being a stretch-wrapped pallet of corrugated cases. In interstate and international trade, a quaternary package is frequently used to facilitate the handling of tertiary packages. This is generally a metal container up to 40 m in length that can hold many pallets and is intermodal in nature.
Four primary and interconnected functions of packaging have been identifi ed: containment, pro-tection, convenience, and communication (Robertson, 2006).
1.1.1.1 ContainmentThis function of packaging is so obvious as to be overlooked by many, but it is the most basic function of packaging. Food products must be contained before they can be moved from one place to another. The containment function of packaging makes a huge contribution to protecting the environment from the myriad of products that are moved from one place to another on numerous occasions each day.
1.1.1.2 ProtectionThis is often regarded as the primary function of the package: to protect its contents from the out-side environmental effects of water, water vapor, gases, odors, microorganisms, dust, shocks, vibra-tions, compressive forces, and so on.
For the majority of food products, the protection afforded by the package is an essential part of the preservation process. For example, aseptically packaged milk in paperboard laminate cartons remains aseptic only for as long as the package provides protection; vacuum-packaged meat will not achieve its desired shelf life if the package permits O2 to enter. In general, once the integrity of the package is breached, the product is no longer preserved.
Freedom from harmful microbial contaminants at the time of consumption can also be infl u-enced by the package. First, if the packaging material does not provide a suitable barrier around the food, microorganisms can contaminate the food and make it unsafe. Microbial contamination can also arise if the packaging material permits the transfer of, for example, moisture or O2 from the atmosphere into the package. In this situation, microorganisms present in the food but posing no risk because of the initial absence of moisture or O2 may then be able to grow and present a risk to the consumer.
Effective packaging reduces food waste, and in doing so protects or conserves much of the energy expended during the production and processing of the product. For example, to produce, transport, sell, and store 1 kg of bread requires 15.8 MJ (megajoules) of energy. This energy is required in the form of transport fuel, heat, power, refrigeration in farming and milling the wheat, baking and retailing the bread, and distributing both the raw materials and the fi nished product. To produce the polyethylene bag to package a 1 kg loaf of bread requires 1.4 MJ of energy. This means that each unit of energy in the packaging protects 11 units of energy in the product. Although elim-inating the packaging might save 1.4 MJ of energy, it would also lead to spoilage of the bread and a consequent waste of 15.8 MJ of energy (Robertson, 2006).
1.1.1.3 ConvenienceModern, industrialized societies have seen tremendous changes in lifestyle, and the packaging industry has had to respond to those changes, which have created a demand for greater convenience in household products: foods that are pre-prepared and can be cooked or reheated in a very short time, preferably without removing them from the package; condiments that can be applied simply or
78445_C001.indd 278445_C001.indd 2 11/3/2009 5:19:56 PM11/3/2009 5:19:56 PM
© 2010 by Taylor and Francis Group, LLC

Food Packaging and Shelf Life 3
by means of pump-action packages; dispensers for sauces or dressings that minimize mess; reclos-able openings on drink bottles to permit consumption on the go; and so on. Thus, packaging plays an important role in allowing products to be used conveniently.
Two other aspects of convenience are important in package design. One of these can best be described as the apportionment function of packaging. In this context, the package functions to reduce the output from industrial production to a manageable, desirable “consumer” size. An asso-ciated aspect is the shape (relative proportions) of the primary package in relation to convenience of use by consumers (e.g., easy to hold, open, and pour as appropriate) and effi ciency in building it into secondary and tertiary packages. Packaging plays a very important role in permitting primary packages to be unitized into secondary packages (e.g., placed inside a corrugated case) and then for these secondary packages to be unitized into a tertiary package (e.g., a stretch-wrapped pallet). As a consequence of this unitizing function, materials handling is optimized, as only a minimal number of discrete packages or loads need to be handled.
1.1.1.4 CommunicationThere is an old saying that “a package must protect what it sells and sell what it protects”; that is, the package functions as a “silent salesman.” The modern methods of consumer marketing would fail were it not for the messages communicated by the package through distinctive branding and labeling, enabling supermarkets to function on a self-service basis. Consumers make purchasing decisions using the numerous clues provided by the graphics and the distinctive shapes of the pack-aging. Other communication functions of the package include a Universal Product Code (UPC) that can be read accurately and rapidly using modern scanning equipment at retail checkouts, nutritional and ingredient information (including E-numbers for additives), and country of origin.
1.1.1.5 AttributesThere are also several attributes of packaging that are important (Krochta, 2007). One (related to the convenience function) is that it should be effi cient from a production or commercial viewpoint, that is, in fi lling, closing, handling, transportation, and storage. Another is that the package should have, throughout its life cycle from raw material extraction to fi nal disposal after use, minimal adverse environmental impacts. A third attribute is that the package should not impart to the food any undesirable contaminants. Although this last attribute may seem self-evident, there has been a long history of so-called food-contact substances migrating from the packaging material into the food (Grob et al., 2006). Not surprisingly, food packaging materials are highly regulated in many countries to ensure consumer safety.
1.1.2 PACKAGE ENVIRONMENTS
The packaging has to perform its functions in three different environments (Lockhart, 1997). Failure to consider all three environments during package development will result in poorly designed pack-ages, increased costs, consumer complaints, and even avoidance or rejection of the product by the consumer.
1.1.2.1 Physical EnvironmentThis is the environment in which physical damage can be caused to the product, including shocks from drops, falls, and bumps; damage from vibrations arising from transportation modes, including road, rail, sea, and air; and compression and crushing damage arising from stacking during trans-portation or storage in warehouses, retail outlets, and the home environment.
1.1.2.2 Ambient EnvironmentThis is the environment that surrounds the package. Damage to the product can be caused as a result of exposure to gases (particularly O2), water and water vapor, light (particularly UV radiation), and
78445_C001.indd 378445_C001.indd 3 11/3/2009 5:19:57 PM11/3/2009 5:19:57 PM
© 2010 by Taylor and Francis Group, LLC

4 Food Packaging and Shelf Life
the effects of heat and cold, as well as microorganisms (bacteria, fungi, molds, yeasts, and viruses) and macroorganisms (rodents, insects, mites, and birds), which are ubiquitous in many warehouses and retail outlets. Contaminants in the ambient environment such as exhaust fumes from automo-biles and dust and dirt can also fi nd their way into the product unless the package acts as an effective barrier.
1.1.2.3 Human EnvironmentThis is the environment in which the package is handled by people, and designing packages for this environment requires knowledge of the strengths and frailties of human vision, human strength and weakness, dexterity, memory, cognitive behavior, and so on (Yoxall et al., 2007). It also includes results of human activity such as liability, litigation, legislation, and regulation. Since one of the functions of the package is to communicate, it is important that the messages are received clearly by consumers. In addition, the package must contain information required by law, such as nutritional content and net weight. To maximize its convenience or utility functions, the package should be simple to hold, open, use, and (if appropriate) reclose by the consumer.
1.2 FOOD PACKAGING MATERIALS
The materials used to manufacture food packaging comprise a heterogeneous group, including glass, metals, plastics, and paper, with a corresponding range of performance characteristics. The properties of these various materials will not be described here in detail, as they have been well documented elsewhere (Lee et al., 2008; Piringer and Baner, 2008; Robertson, 2006; Yam, 2009). However, some general points will be made.
In the selection of suitable packaging materials for a particular food, the focus is typically on the bar-rier properties of the packaging material. Foods can be classifi ed according to the degree of protection required, such as the maximum moisture gain or O2 uptake. Calculations can then be made to deter-mine whether a particular packaging material would provide the necessary barrier required to give the desired product shelf life. Metal cans and glass containers can be regarded as essentially impermeable to the passage of gases, odors, and water vapor, provided that a metal end has been correctly seamed on in the case of cans or a satisfactory closure applied in the case of glass containers. Aluminum foil has excellent barrier properties, provided it is at least 25 μm thick; below this thickness the likelihood of pinholes increases. It is common to laminate plastic polymers to aluminum foil to provide mechanical support and heat sealability. Paper-based packaging materials can be regarded as permeable and for this reason are normally coated with a plastic polymer to ensure adequate barrier properties for the pack-aging of foods. This then leaves plastics-based packaging materials, which provide varying degrees of protection, depending largely on the nature of the polymers used in their manufacture.
1.2.1 POLYMER PERMEABILITY
In contrast to packaging materials made from glass or metal, packages made from thermoplastic polymers are permeable to varying degrees to small molecules such as gases, water vapor, organic vapors, and other low molecular weight compounds.
The following expression can be derived from Fick’s fi rst law (Robertson, 2006):
QDS p p At
X=
−( )1 2 (1.1)
Here Q is the quantity of gas or vapor permeating a polymer of thickness X and surface area A in time t under a pressure gradient of p1 on one side and p2 on the other, where p1 > p2. D is the diffu-sion coeffi cient and S the solubility coeffi cient of the permeant; the product DS is referred to as the
78445_C001.indd 478445_C001.indd 4 11/3/2009 5:19:57 PM11/3/2009 5:19:57 PM
© 2010 by Taylor and Francis Group, LLC

Food Packaging and Shelf Life 5
permeability coeffi cient (or constant) or permeation coeffi cient, or simply the permeability, and is represented by the symbol P. Thus:
PQX
At p p=
−( )1 2
(1.2)
or
Q
t
P
XA p− ( )� (1.3)
The term P/X is called the permeance. A plastic polymer that is a good barrier to gases and water vapor has a low permeability coeffi cient.
Four assumptions are made in this simple treatment of permeation: diffusion is at steady state; the concentration–distance relationship through the polymer is linear; diffusion takes place in one direc-tion only (i.e., through the fi lm with no net diffusion along or across it); and both D and S are indepen-dent of concentration. However, as with all simplifying assumptions, there are many instances when the assumptions are not valid, and in such cases the predictions made are not subsequently borne out in practice. Although steady state is usually attained in a few hours for small molecules such as O2, larger molecules in barrier polymers (especially glassy polymers) can take a long time to reach steady state, this time possibly exceeding the anticipated shelf life. Although D and S are independent of concentration for many gases, such as O2, N2, and, to a certain extent, CO2, this is not the case where considerable interaction between polymer and permeant takes place (e.g., water and hydrophilic fi lms such as polyamides [PA], or many solvent vapors diffusing through polymer fi lms). Typical values for the permeability coeffi cient of commercial food packaging polymers are presented in Table 1.1.
TABLE 1.1Permeability to Oxygen, Carbon Dioxide, and Water Vapor of Some Plastic Films
Permeability to O2 ×1011
mL cm cm–2 s–1 (cm Hg) –1
at 23ºC, 0% RH
CO2 ×1011
mL cm cm–2 s–1 (cm Hg)–1
at 23ºC, 0% RH
H2O ×1011
g cm cm–2 s–1
at 23ºC, 100% RHLDPE 15–30 60–160 5–10HDPE 5–17 150 1.8–3.5EVA (15%VA) 30–40 — 21–25Ethylene acid copolymer (ionomer)
20–35 — 5–11
PP 9–16 30–50 4–10PET 0.14 1.2 4–6a
PS 18–25 60–90 9–46PVC plasticized 1.7–100b 6–180 —PVC rigid 0.3–1.2b 1.2–3 14PA6 0.09–0.11 0.6–0.8 46a
PA66 0.2 — 86PVdC 0.006b — 0.7a
EVOH (32% C2H4) 0.0015 0.018 17.5a
Source: Adapted from Massey L. 2003. Permeability Properties of Plastics and Elastomers, 2nd edn. New York: Plastics Design Library.
a 40ºC, 90% RH.b 23ºC, 50% RH.
78445_C001.indd 578445_C001.indd 5 11/3/2009 5:19:57 PM11/3/2009 5:19:57 PM
© 2010 by Taylor and Francis Group, LLC
6 Food Packaging and Shelf Life
The permeability coeffi cient defi ned in the preceding text is independent of thickness, as the thickness is already accounted for in the calculation of P. However, the total amount of protection afforded per unit area of a barrier material approaches zero only asymptotically. Consequently, as polymer thickness X is increased beyond a certain value, it becomes uneconomical to increase it further to obtain lower permeability. For example, to equal the O2 barrier of a 25-µm fi lm of a high-barrier material such as poly(vinylidene chloride) copolymer (PVdC) would require 62,500 µm of polypropylene (PP), 1250 µm of poly(ethylene terephthalate) (PET), 1250 µm of poly(vinyl chloride) (PVC), or 250 µm of nylon 6.
In general, permeability of a penetrant through a polymer depends on many factors, including the nature of the polymer, thickness of the fi lm, size and shape of the penetrant, pressure, and temperature. The structural attributes that can infl uence the permeability of polymers include polarity, unsaturation, symmetry, lateral chains, steric hindrance, degree of cross-linking, hydrogen bonding, intermolecular forces, comonomers present, crystallinity, glass transition temperature, and orientation.
Literature data for gas transport coeffi cients (permeability, diffusion, and solubility coeffi cients) vary generally with parameters that are intrinsic to the polymer such as degree of crystallinity, nature of the polymer, and the thermal and mechanical histories of samples such as orientation. Sorption and diffusion phenomena take place exclusively in the amorphous phase of a semicrystal-line polymer and not in its crystalline zones.
The effect of crystallinity on the permeability coeffi cient of high density polyethylene (HDPE) to O2 was illustrated by Pauly (1999), who showed that P × 1011 decreased from 54.9 mL (STP) cm cm–2 s–1 (cm Hg)–1 at 60% crystallinity to 20.9 at 69% and 10.6 at 81% crystallinity.
The effect of orientation on the O2 permeability coeffi cient was also illustrated by Pauly (1999), who showed that P × 1011 decreased for polystyrene from 25.0 to 17.9 mL (STP) cm cm–2 s–1 (cm Hg)–1 when oriented 300%; comparable fi gures for PP were 9.0 to 4.8; for PET, P decreased from 0.60 to 0.22 when oriented 500%.
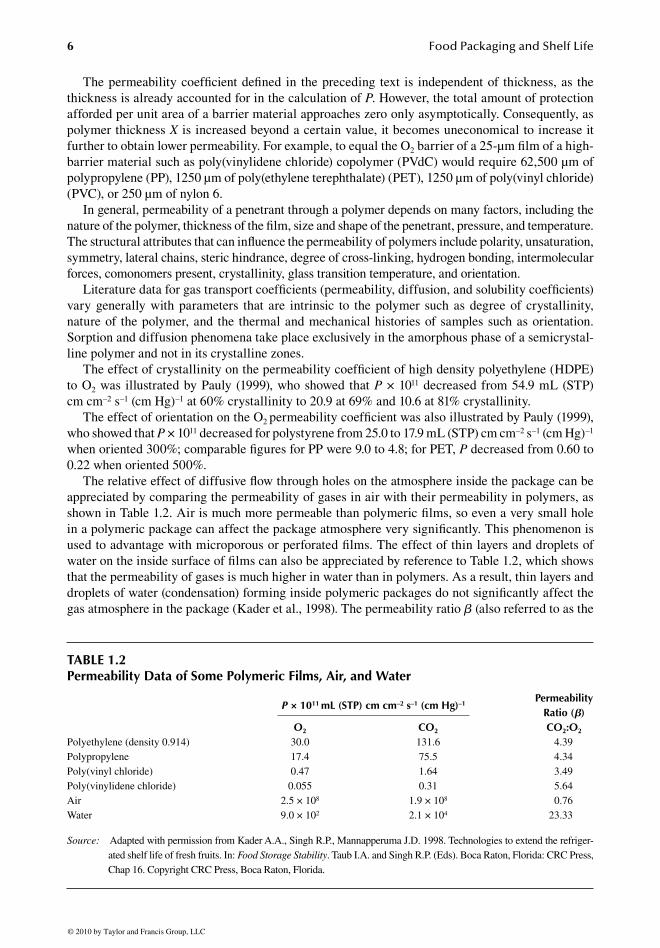
The relative effect of diffusive fl ow through holes on the atmosphere inside the package can be appreciated by comparing the permeability of gases in air with their permeability in polymers, as shown in Table 1.2. Air is much more permeable than polymeric fi lms, so even a very small hole in a polymeric package can affect the package atmosphere very signifi cantly. This phenomenon is used to advantage with microporous or perforated fi lms. The effect of thin layers and droplets of water on the inside surface of fi lms can also be appreciated by reference to Table 1.2, which shows that the permeability of gases is much higher in water than in polymers. As a result, thin layers and droplets of water (condensation) forming inside polymeric packages do not signifi cantly affect the gas atmosphere in the package (Kader et al., 1998). The permeability ratio b (also referred to as the
TABLE 1.2Permeability Data of Some Polymeric Films, Air, and Water
P × 1011 mL (STP) cm cm–2 s–1 (cm Hg)–1Permeability
Ratio (�)O2 CO2 CO2:O2
Polyethylene (density 0.914) 30.0 131.6 4.39Polypropylene 17.4 75.5 4.34Poly(vinyl chloride) 0.47 1.64 3.49Poly(vinylidene chloride) 0.055 0.31 5.64Air 2.5 × 10⁸ 1.9 × 10⁸ 0.76Water 9.0 × 10² 2.1 × 10⁴ 23.33
Source: Adapted with permission from Kader A.A., Singh R.P., Mannapperuma J.D. 1998. Technologies to extend the refriger-ated shelf life of fresh fruits. In: Food Storage Stability. Taub I.A. and Singh R.P. (Eds). Boca Raton, Florida: CRC Press, Chap 16. Copyright CRC Press, Boca Raton, Florida.
78445_C001.indd 678445_C001.indd 6 11/3/2009 5:19:57 PM11/3/2009 5:19:57 PM
© 2010 by Taylor and Francis Group, LLC

Food Packaging and Shelf Life 7
permselectivity) is the ratio of P for CO2 to that for O2 and is particularly useful information when designing modifi ed atmosphere packages.
In the published literature it is rare to fi nd many details about a particular plastic packaging material apart from its name, sometimes the name of the resin supplier, and perhaps whether it has been oriented. This makes it virtually impossible to replicate the experimental conditions described in the literature, as the range of polymers available is vast. For example, the web site www.ides.com contains data sheets on more than 77,000 commercial polymers from 694 resin manufacturers. Of course, many of these polymers are not approved or suitable for use in food packaging.
Consider PP, a polymer used increasingly in food packaging. The properties of PP have improved considerably over the past few decades as a result of a wide range of technical advances ranging from new metallocene catalysts to co-monomers. PP and its copolymers can be classifi ed into three categories (Begley et al., 2008): monophasic homopolymer (h-PP), monophasic random copolymer (r-PP), and heterophasic copolymer (heco-PP). The h-PP can be either isotactic, syndiotactic, or atactic, but the isotactic h-PP is particularly useful due to its stereoregularity and the resulting high crystallinity. Therefore, commercially produced h-PP is up to 95% isotactic. Ides lists data sheets for 19 h-PP food-grade polymers.
The linear polymer chains of r-PP contain copolymers such as ethylene and butene in a random manner, which reduces crystallinity and thus improves the optical clarity, the main commercial advantage of r-PP over h-PP. The heco-PP is a block copolymer made up of h-PP phases and, usu-ally, ethylene-propylene rubber (EPR) phases. This combination leads to superior impact strength at low temperatures. Owing to the variety of PP formulations mentioned here, along with their variety of applications in food packaging, a wide range of diffusion behavior is observed in PP; for exam-ple, diffusion coeffi cients for r-PP are at least one order of magnitude higher than those of h-PP and comparable with those for heco-PP (Begley et al., 2008).
The permeability coeffi cient of a specifi c polymer–permeant system may increase or decrease with increases in temperature, depending on the relative effect of temperature on the solubility and diffusion coeffi cients. Generally, the solubility coeffi cient increases with increasing temperature for gases and decreases for vapors, and the diffusion coeffi cient increases with temperature for both gases and vapors. For these reasons, permeability coeffi cients of different polymers determined at one temperature may not be in the same relative order at other temperatures.
1.2.2 TRANSMISSION RATE
The aforementioned treatment of steady-state diffusion assumes that both D and S are independent of concentration, but, in practice, deviations do occur. Equation 1.3 does not hold when there is inter-action such as that which occurs between hydrophilic materials [e.g., EVOH (ethylene vinyl alcohol copolymers) and some of the PAs] and water vapor, or for heterogeneous materials such as coated or laminated fi lms. The property is then defi ned as the transmission rate (TR) of the material, where:
TRQ
At= (1.4)
Here Q is the amount of permeant passing through the polymer, A is the surface area, and t is the time. Permeabilities of polymers to water and organic compounds are often presented in this way, and in the case of water and O2, the terms water vapor transmission rate (WVTR) and gas trans-mission rate (GTR), or more specifi cally oxygen transmission rate (OTR or O2TR), are in common usage. It is critical that the thickness of the fi lm or laminate, the temperature, and the partial pres-sure difference of the gas or water vapor be specifi ed for a particular TR.
The specialized instruments commonly used to determine the OTR of plastic packaging materi-als, such as those manufactured by MoCon, use pure O2 on one side and measure how much perme-ates into a carrier gas on the other side (the O2 gradient is therefore 1 atm). In real life, where there
78445_C001.indd 778445_C001.indd 7 11/3/2009 5:19:57 PM11/3/2009 5:19:57 PM
© 2010 by Taylor and Francis Group, LLC

8 Food Packaging and Shelf Life
is typically air on one side (O2 is present at 21% in air) and essentially no O2 inside the package, the O2 gradient is 0.21 atm or 16 cm Hg. Thus, to convert OTR values expressed in units of mL m–2 day–1 atm–1 to “true” OTR units of mL m–2 day–1, it is necessary to multiply by 0.21; this has been done for the OTR values quoted in this book. An exception to this convention is used in the case of CO2, where, because of its very low concentration in air (0.03%), CO2TR units are often given in mL m–2 day–1 atm–1. In modifi ed atmosphere packaging (MAP), concentrations of CO2 inside the package are typically 40–60%.
Often the units for WVTR include a thickness term, in which case the WVTR should, strictly speaking, be referred to as the thickness normalized fl ux, or TNF (Robertson, 2009). To convert a measured WVTR or OTR to P, it is necessary to multiply by the thickness of the fi lm and divide by the partial pressure difference used to make the measurement.
Example: Calculate the permeability coeffi cient of an amorphous polyethylene terephthalate (PET) fi lm to O2 at 23°C given that the OTR through a 2.54 × 10⁻³-cm-thick fi lm with air on one side and inert gas on the other is 8.8 × 10⁻⁹ mL cm–2 s–1.
O2 partial pressure difference across the fi lm is 0.21 atm = 16 cm Hg.
POTR
p= ×
= ×( ) × ×
=
− − −−
�thickness
mL cm s
cm Hgcm
8 8 10
162 54 10
9 2 13.
.
11 4 10
0 14 10
12 2 1 1
11
.
.
× ( ) ( )
= × ( )
− − − −
−
mL STP cm cm s cm Hg
mL STP ccm cm s cm Hg− − −( )
2 1 1
Therefore
P × = ( ) ( )
− − −10 0 1411 2 1 1
. mL STP cm cm s cm Hg
which is the value given in Table 1.1.The OTR of packaging materials used for MAP of chilled products varies extensively with tempera-
ture, relative humidity (RH), and material thickness after the thermoforming of packages. Gnanaraj et al. (2005) reported OTRs, together with the Arrhenius pre-exponential factor k0 and activation energy Ea, for a range of fi lms at 10°C, 15°C, 23°C, 30°C, and 35°C and 0% and 50% RH. The OTRs at 10°C were typically half those at 23°C. Jakobsen et al. (2005) studied two different polymer combinations: amor-phous PET/low density polyethylene (APET/LDPE) (tray) and PA/LDPE (lid). A temperature reduction of 8°C (in the interval 7–23°C) caused an OTR reduction of 26–48%, depending on material type, degree of thermoforming, and RH. An increased OTR was observed as a result of material thinning; however, the increase was not always directly proportional to the degree of material thinning. The changes in OTR observed emphasize the necessity of evaluating the performance of packaging materi-als under realistic storage conditions to estimate the real O2 content of a chosen package solution.
1.2.3 SURFACE AREA:VOLUME RATIO
The dimensions of the package for a given weight of food can have a signifi cant infl uence on shelf life. Although a spherical shape will minimize the surface area of the package (and thus the quantity of moisture or O2 that will permeate the package wall), it is not a practical shape for commercial use, and, in practice, most packages tend to be rectangular or cylindrical. Table 1.3 gives the surface areas for a range of different shapes with the same volume (~450 mL). Compared with the surface area of a sphere,
78445_C001.indd 878445_C001.indd 8 11/3/2009 5:19:58 PM11/3/2009 5:19:58 PM
© 2010 by Taylor and Francis Group, LLC
Food Packaging and Shelf Life 9
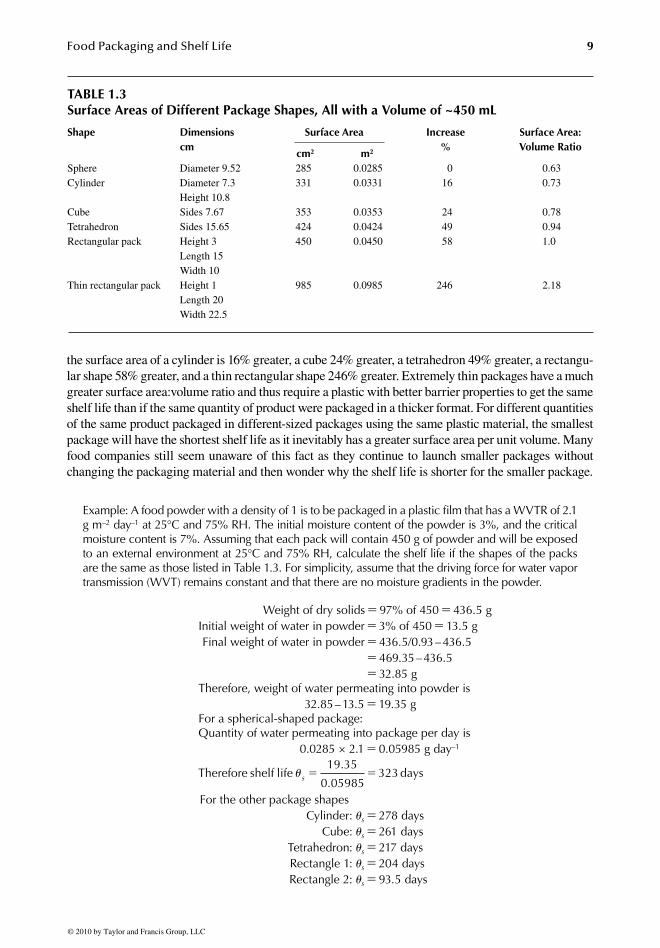
the surface area of a cylinder is 16% greater, a cube 24% greater, a tetrahedron 49% greater, a rectangu-lar shape 58% greater, and a thin rectangular shape 246% greater. Extremely thin packages have a much greater surface area:volume ratio and thus require a plastic with better barrier properties to get the same shelf life than if the same quantity of product were packaged in a thicker format. For different quantities of the same product packaged in different-sized packages using the same plastic material, the smallest package will have the shortest shelf life as it inevitably has a greater surface area per unit volume. Many food companies still seem unaware of this fact as they continue to launch smaller packages without changing the packaging material and then wonder why the shelf life is shorter for the smaller package.
Example: A food powder with a density of 1 is to be packaged in a plastic fi lm that has a WVTR of 2.1 g m–2 day–1 at 25°C and 75% RH. The initial moisture content of the powder is 3%, and the critical moisture content is 7%. Assuming that each pack will contain 450 g of powder and will be exposed to an external environment at 25°C and 75% RH, calculate the shelf life if the shapes of the packs are the same as those listed in Table 1.3. For simplicity, assume that the driving force for water vapor transmission (WVT) remains constant and that there are no moisture gradients in the powder.
Weight of dry solids = 97% of 450 = 436.5 gInitial weight of water in powder = 3% of 450 = 13.5 gFinal weight of water in powder = 436.5/0.93 – 436.5
= 469.35 – 436.5 = 32.85 g
Therefore, weight of water permeating into powder is 32.85 – 13.5 = 19.35 gFor a spherical-shaped package:Quantity of water permeating into package per day is 0.0285 × 2.1 = 0.05985 g day–1
Therefore shelf life 19.35
0.05985323 daysus � �
For the other package shapes Cylinder: us = 278 days Cube: us = 261 days Tetrahedron: us = 217 days Rectangle 1: us = 204 days Rectangle 2: us = 93.5 days
TABLE 1.3Surface Areas of Different Package Shapes, All with a Volume of ~450 mL
Shape Dimensionscm
Surface Area Increase%
Surface Area: Volume Ratio
cm2 m2
Sphere Diameter 9.52 285 0.0285 0 0.63Cylinder Diameter 7.3
Height 10.8331 0.0331 16 0.73
Cube Sides 7.67 353 0.0353 24 0.78Tetrahedron Sides 15.65 424 0.0424 49 0.94Rectangular pack Height 3
Length 15Width 10
450 0.0450 58 1.0
Thin rectangular pack Height 1Length 20Width 22.5
985 0.0985 246 2.18
78445_C001.indd 978445_C001.indd 9 11/3/2009 5:19:58 PM11/3/2009 5:19:58 PM
© 2010 by Taylor and Francis Group, LLC
10 Food Packaging and Shelf Life
1.3 SHELF LIFE
The quality of most foods and beverages decreases with storage or holding time. Exceptions include distilled spirits (particularly whiskeys and brandies) that develop desirable fl avor components during storage in wooden barrels, some wines that undergo increases in fl avor complexity during storage in glass bottles, and many cheese varieties in which enzymic degradation of proteins and carbohy-drates, together with hydrolysis of fat and secondary chemical reactions, lead to desirable fl avors and textures in aged cheeses.
For the majority of foods and beverages in which quality decreases with time, it follows that there will be a fi nite length of time before the product becomes unacceptable. This time from pro-duction to unacceptability is referred to as shelf life. Although the Wizard of Id thought that shelf life related to the time until the shelf displaying the food rotted out (see Figure 1.1), shelf life refers to the time on the retailer’s shelf as well as the consumer’s shelf. Although the shelf lives of foods vary, they are routinely determined for each particular product by the manufacturer or processor. Manufacturers generally attempt to provide the longest practicable shelf life consistent with costs and the pattern of handling and use by distributors, retailers, and consumers. Supermarkets will generally not accept the product into their distribution centers unless at least 75% of the shelf life remains. Inadequate shelf life will often lead to consumer dissatisfaction and complaints. At best, such dissatisfaction will eventually affect the acceptance and sales of brand name products, while, at worst, it can lead to malnutrition or even illness. Therefore, food processors give considerable attention to determining the shelf lives of their products.
1.3.1 DEFINITIONS
Despite its importance, there is no simple, generally accepted defi nition of shelf life in the food tech-nology literature. The Institute of Food Technologists (IFT) in the United States has defi ned shelf life as “the period between the manufacture and the retail purchase of a food product, during which time the product is in a state of satisfactory quality in terms of nutritional value, taste, texture and appear-ance” (Anon., 1974). This defi nition overlooks the fact that the consumer may store the product at home for some time before consuming it yet will still want the product to be of acceptable quality.
The Institute of Food Science and Technology (IFST) in the United Kingdom has defi ned shelf life as “the period of time during which the food product will remain safe; be certain to retain desired sensory, chemical, physical, microbiological and functional characteristics; and comply with any label declaration of nutritional data when stored under the recommended conditions” (Anon., 1993).
Another defi nition is that “shelf life is the duration of that period between the packing of a product and the end of consumer quality as determined by the percentage of consumers who are displeased by the product” (Labuza and Schmidl, 1988). This defi nition accounts for the variation in consumer
Wizard of Id By Brant Parker & Johnny Hart
FIGURE 1.1 Shelf life according to the Wizard of Id. (Used with permission of John L. Hart FLP and Creators Syndicate, Inc.)
78445_C001.indd 1078445_C001.indd 10 11/3/2009 5:19:58 PM11/3/2009 5:19:58 PM
© 2010 by Taylor and Francis Group, LLC
Food Packaging and Shelf Life 11
perception of quality (i.e., not all consumers will fi nd a product unacceptable at the same time) and has an economic element, in that, because it is not possible to please all consumers all of the time, a baseline of consumer dissatisfaction must be established. In the branch of statistics known as survival analysis, consumer dissatisfaction can be related to the survival function, defi ned as “the probability of a con-sumer accepting a product beyond a certain storage time.” Models permitting the application of survival analysis to the sensory shelf life of foods have been published and are discussed further in Chapter 3.
Simply put, shelf life is the time during which all of the primary characteristics of the food remain acceptable for consumption. Thus, shelf life refers to the time for which a food can remain on the retailer’s and then the consumer’s shelf before it becomes unacceptable.
Until recently, the EU had no defi nition of shelf life or legislation on how shelf life should be determined; the consolidated EU Directive on food labeling (2000/13/EC) required prepackaged foods to bear a date of “minimum durability” or, in the case of foods that, from a microbiological point of view, are highly perishable, the “use by” date. The date of minimum durability was defi ned as the “date until which a foodstuff retains its specifi c properties when properly stored,” and any special storage conditions (e.g., temperature not to exceed 7°C) must be specifi ed. This concept allows the processor to set the quality standard of the food, as the product will still be acceptable to many consumers after the “best before” date has passed. More recently, shelf life was defi ned for the fi rst time in EU legislation, in Commission Regulation (EC) No. 2073/2005 thus: “shelf life means either the period corresponding to the period preceding the ‘use by’ or the minimum durability date, as defi ned respectively in Articles 9 and 10 of Directive 2000/13/EC.”
According to Cheftel (2005), the date of minimum durability is defi ned as the date until which the food retains its specifi c properties when properly stored. It must be indicated by the words “Best before” followed by the date (or a reference to where the date is given on the labeling). Depending on how long the food can keep, the date can be expressed by the day and the month, the month and the year, or the year alone. A list of foods and beverages exempted from date-marking is given in article 9(5) of Directive 2000/13/EC. Foods that are highly perishable microbiologically (and there-fore likely to be dangerous for health after a short period) must be labeled with the words “Use by” followed by the date (day and month) or a reference to where the date is given on the labeling. Any distribution after this date is forbidden. The “use by” date must be followed by a description of the storage conditions that should be observed.
In many countries a “best before” date is required on the label. However, if the food is highly per-ishable from a microbiological point of view and therefore likely, after a short period, to constitute an immediate danger to human health, then the “best before” date must be replaced by a “use by” date. It is illegal to sell food after the “use by” date; food consumed after the “best before” date will still be edible, but its quality will have deteriorated to a level below what the manufacturer considers desirable. Recently, use of the hybrid term “best by” has become popular. A major US brewer now labels bottles of beer with the “born on” date, that is, the date of manufacture, leaving consumers to decide when the beer is no longer acceptable.
1.3.2 FACTORS CONTROLLING SHELF LIFE
The shelf life of a food is controlled by three factors:
1. Product characteristics, including formulation and processing parameters (intrinsic factors) 2. Environment to which the product is exposed during distribution and storage (extrinsic
factors) 3. Properties of the package
Intrinsic factors are discussed in Chapter 2 and include pH, water activity, enzymes, microorgan-isms, and concentration of reactive compounds. Many of these factors can be controlled through the selection of raw materials and ingredients, as well as the choice of processing parameters.
78445_C001.indd 1178445_C001.indd 11 11/3/2009 5:19:59 PM11/3/2009 5:19:59 PM
© 2010 by Taylor and Francis Group, LLC

12 Food Packaging and Shelf Life
Extrinsic factors include temperature, RH, light, total and partial pressures of different gases, and mechanical stresses, including consumer handling. Many of these factors can affect the rates of deteriorative reactions that occur during the shelf life of a product.
The properties of the package can have a signifi cant effect on many of the extrinsic factors and thus indirectly on the rates of the deteriorative reactions. Thus, the shelf life of a food can be altered by changing its composition and formulation, processing parameters, packaging system, or the envi-ronment to which it is exposed.
1.3.2.1 Product CharacteristicsOn the basis of the nature of the changes that can occur during storage, foods can be divided into three categories—perishable, semiperishable, and nonperishable or shelf stable—which translate into very short shelf life products, short to medium shelf life products, and medium to long shelf life products (Robertson, 2006).
Perishable foods are those that must be held at chill or freezer temperatures (i.e., 0°C to 7°C or −12°C to −18°C respectively) if they are to be kept for more than a short period. Examples of such foods are milk; fresh fl esh foods such as meat, poultry, and fi sh; minimally processed foods; and many fresh fruits and vegetables.
Semiperishable foods are those that contain natural inhibitors (e.g., some cheeses, root veg-etables and eggs) and those that have undergone some type of mild preservation treatment (e.g., pasteurization of milk, smoking of hams, and pickling of vegetables) that produces greater tolerance to environmental conditions and abuse during distribution and handling.
Shelf stable foods are considered “nonperishable” at room temperatures. Many unprocessed foods fall into this category, and are unaffected by microorganisms because of their low mois-ture content (e.g., cereal grains, nuts, and some confectionery products). Processed food prod-ucts can be shelf stable if they are preserved by heat sterilization (e.g., canned foods), contain preservatives (e.g., soft drinks), are formulated as dry mixes (e.g., cake mixes), or are processed to reduce their water content (e.g., raisins or crackers). However, shelf stable foods retain this status only if the integrity of the package that contains them remains intact. Even then, their shelf life is fi nite due to deteriorative chemical reactions that proceed at room temperature inde-pendently of the nature of the package, and the permeation of gases, odors, and water vapor through the package.
1.3.2.2 Distribution and Storage EnvironmentThe deterioration in product quality of packaged foods is often closely related to the transfer of mass and heat through the package. Packaged foods may lose or gain moisture; they will also refl ect the temperature of their environment, because very few food packages are good insulators. Thus, the climatic conditions (i.e., temperature and humidity) of the distribution and storage environment have an important infl uence on the rate of deterioration of packaged foods.
1.3.2.3 Package PropertiesFoods can be classifi ed according to the degree of protection required from the package, such as maximum moisture gain or O2 uptake. This enables calculations to be made to determine whether a particular packaging material would provide the barrier required to give the desired product shelf life. Metal cans and glass containers can be regarded as essentially impermeable to the passage of gases, odors, and water vapor, but paper-based packaging materials can be regarded as permeable. Plastics-based packaging materials provide varying degrees of protection, depending largely on the nature of the polymers used in their manufacture.
In Section 1.2.1 the permeability of thermoplastic polymers was discussed. A discussion of how this information can be used to select the most appropriate polymer for a particular product can be found elsewhere (e.g., see Robertson, 2006).
78445_C001.indd 1278445_C001.indd 12 11/3/2009 5:19:59 PM11/3/2009 5:19:59 PM
© 2010 by Taylor and Francis Group, LLC

Food Packaging and Shelf Life 13
For a product where the end of shelf life can be directly related to a gain in moisture (e.g., loss of crispness in a snack food), the end of product shelf life is reached when the moisture content m (initially mi) reaches the critical moisture content mc, and the following equation applies:
uss
o
e i
e c
=−−
X
P
W
A
b
p
m m
m mln (1.5)
where me is the equilibrium moisture content of the food if exposed to the RH outside the package; Ws is the weight of dry solids enclosed; po is the vapor pressure of pure water at the storage temper-ature (not the actual vapor pressure outside the package); and b is the slope of the moisture sorption isotherm when treated as a linear function.
Equation 1.5 and the corresponding equation for moisture loss have been extensively tested for foods and found to give excellent predictions of actual weight gain or loss. These equations are also useful when calculating the effect of changes in the external conditions (e.g., temperature and humidity), the surface area:volume ratio of the package, and variations in the initial moisture con-tent of the product.
The gas of major importance in packaged foods is O2, as it plays a crucial role in many reactions that affect the shelf life of foods, for example, microbial growth, color changes in fresh and cured meats, oxidation of lipids and consequent rancidity, and senescence of fruits and vegetables.
The transfer of gases and odors through packaging materials can be analyzed in an analogous manner to that described for water vapor transfer, provided that values are known for the permeance of the packaging material to the appropriate gas and the partial pressure of the gas inside and out-side the package. However, the simplifying assumptions made in the derivation of Equation 1.4 can lead to signifi cant errors in the calculated shelf life compared to the actual shelf life. For example, in the case of CO2 loss from carbonated beverages in PET bottles, the assumption that the gas par-titioning between the gas phase and the polymer is described by Henry’s law and that mass trans-fer inside the bottle wall is governed by Fick’s law gives rise to the underestimation of the barrier properties of the materials, and, consequently, the predicted shelf life of the carbonated beverage is much shorter than the true one (Masi and Paul, 1982).
Del Nobile et al. (1997) showed the importance of another aspect that is often neglected in pre-dicting the shelf life of carbonated beverages bottled in glassy polymer containers: the infl uence of the thermal history of the bottle during the period between fi lling and consumption. In their fi rst example, the shelf life of the beverage was estimated assuming that the storage temperature was constant and equal to room temperature for the entire storage period; the calculated shelf life was 352 days. In the second example, it was assumed that the temperature of the bottle varied during the storage period, but for the sake of simplicity in performing the calculation, the temperature was kept constant and equal to the average temperature of storage; the calculated shelf life was 206 days. In the second example, the actual temperature of the bottle of carbonated beverage under condi-tions comparable to those occurring during distribution led to an estimated shelf life of less than 2 months, signifi cantly less than that predicted by neglecting the temperature rise due to outdoor storage and sunlight exposure. By averaging the temperature and using the corresponding param-eters in the calculations, it is implicitly assumed that the diffusion and sorption parameters change linearly with temperature, and this is far from true.
Packaging can control two variables with respect to O2, and these can have different effects on the rates of oxidation reactions in foods. One variable is the total amount of O2 present. This infl uences the extent of the reaction, and in impermeable packages (e.g., hermetically sealed metal and glass containers), where the total amount of O2 available to react with the food is fi nite, the extent of the reaction cannot exceed the amount corresponding to the complete exhaustion of the O2 present inside the package at the time of sealing. This may or may not be suffi cient to result in an unacceptable product quality after a certain period, depending on the rate of the oxidation
78445_C001.indd 1378445_C001.indd 13 11/3/2009 5:19:59 PM11/3/2009 5:19:59 PM
© 2010 by Taylor and Francis Group, LLC

14 Food Packaging and Shelf Life
reaction. This rate will, of course, be temperature dependent. With permeable packages (e.g., plas-tic packages) into which ingress of O2 will occur during storage, two factors are important: there may be suffi cient O2 inside the package to cause product unacceptability when it has all reacted with the food, or there may be suffi cient transfer of O2 through the package over time to result in product unacceptability through oxidation. The other variable is the concentration of O2 in the food. In many cases, relationships between the O2 partial pressure in the space surrounding the food and the rates of oxidation reactions can be established. If the food itself is very resistant to diffusion of O2 (e.g., very dense products such as butter), then it will probably be very diffi cult to establish a relationship between the O2 partial pressure in the space surrounding the food and the concentration of O2 in the food.
With certain products packaged with certain materials, the end of shelf life comes when an unac-ceptable degree of interaction between the package and the product has occurred. Two examples will be given to illustrate the nature of the problem.
The fi rst example is that of a tomato product processed under typical conditions and packaged in a three-piece can with a plain tinplate body and enameled electrolytically chromium-coated steel (ECCS) ends. Over a storage period of 24 months at ambient temperature, several degradative reac-tions occur. The concentration of tin ions in the product increases rapidly during the fi rst 3 months, from approximately 20 to 160 ppm, reaching 280 ppm after 24 months. Iron also dissolves, increas-ing slowly from 8 ppm initially to 10 ppm after 18 months, to reach 14 ppm after 24 months. The fl avor score declines as a result of the increasing quantities of dissolved tin and iron; the color value shows a decrease owing to an increase in brown pigments, but remains acceptable. The limiting fac-tor for this product is the deterioration in fl avor resulting from the dissolution of tin and iron from the package into the product, giving an acceptable shelf life of 24–30 months. If a longer shelf life were required, it would be necessary to use a full enamel-lined can. Alternatively, the product could be stored at chill temperatures to reduce the rate of the degradative reactions.
A second example involves the migration of plasticizers from packaging materials into food such that the legal limit for the migrant in the food is exceeded. For example, gaskets in the lids for glass jars can release epoxidized soy bean oil (ESBO) into meat-containing infant food, and plasticized PVC cling-fi lms have released di-(2-ethylhexyl) adipate (DEHA) into cheese (Grob et al., 2006).
1.3.3 SHELF LIFE DETERMINATION
Methods to determine the shelf life of packaged foods have been published elsewhere (Robertson, 2006) and will not be repeated here. One challenge with shelf life testing is to develop experimen-tal designs that minimize the number of samples required (thus minimizing the cost of the testing) while still providing reliable and statistically valid answers; this is discussed further in Chapter 3. Accelerated shelf life testing (ASLT) applies the principles of chemical kinetics to quantify the effects that extrinsic factors such as temperature, humidity, gas atmosphere, and light have on the rate of deteriorative reactions. By subjecting the food to controlled environments in which one or more of the extrinsic factors is maintained at a higher-than-normal level, the rates of deterioration are speeded up or accelerated, resulting in a shorter-than-normal time to product failure. Because the effects of extrinsic factors on deterioration can be quantifi ed, the magnitude of the acceleration can be calculated and also the “true” shelf life of the product under normal conditions.
The reason behind the need for ASLT of shelf stable food products is simple: as these foods typically have shelf lives of at least one year, evaluating the effect on shelf life of a change in the product (e.g., a new antioxidant or thickener), the process (e.g., a different time/temperature sterili-zation regime), or the packaging (e.g., a new polymeric fi lm) would require shelf life trials lasting at least as long as the required shelf life of the product. Companies cannot afford to wait for such long periods to know whether the new product, process, or packaging will give an adequate shelf life, and therefore ASLT is used. However, the use of ASLT in the food industry is not as widespread as it might be, due in part to the lack of basic data on the effect of extrinsic factors on the rates of
78445_C001.indd 1478445_C001.indd 14 11/3/2009 5:19:59 PM11/3/2009 5:19:59 PM
© 2010 by Taylor and Francis Group, LLC

Food Packaging and Shelf Life 15
deteriorative reactions, in part to ignorance of the methodology required, and in part to a skepticism about the advantages to be gained from using ASLT procedures. Of course, in tropical countries, the ambient temperatures and humidities experienced during distribution and in warehouses and homes are in the upper range used for ASLT in temperate climates (45°C and 95% RH); therefore, ASLT is not applicable in such situations, as temperature cannot be accelerated beyond 45°C without the risk of introducing deteriorative reactions that are unrepresentative of what may occur under real circumstances. Although high O2 pressures can be used to accelerate reactions involving oxidation, this method is not used very often, as oxidation reactions typically become independent of the O2 concentration above a certain level, which varies with temperature and other conditions. However, Cardelli and Labuza (2001) reported that increasing O2 concentrations from 0.5 to 21.3 kPa accel-erated deterioration of roast and ground coffee 20-fold. If both temperature and O2 concentration accelerated, then the decreased solubility of O2 at higher temperatures must be factored into any calculations of shelf life.
In shelf life testing there can be one or more criteria that constitute sample failure. One criterion is an increase or decrease by a specifi ed amount in the mean sensory panel score. Another crite-rion is microbial deterioration of the sample to an extent that it is rendered unsuitable or unsafe for human consumption. Finally, changes in odor, color, texture, fl avor, and so on that render the sample unacceptable to either the panel or the consumer are criteria for product failure. Thus, sample failure can be defi ned as the condition in which the product exhibits either physical, chemical, microbio-logical, or sensory characteristics that are unacceptable to the consumer, and the time required for the product to exhibit such conditions is the shelf life of the product.
However, a fundamental requirement in the analysis of data is knowledge of the statistical dis-tribution of the observations, so that the mean time to failure and its standard deviation can be accurately estimated, and the probability of future failures predicted. The shelf life for food prod-ucts is usually obtained from simple averages of time to failure, on the assumption that the failure distribution is symmetrical. If the distribution is skewed, estimates of the mean time to failure and its standard deviation will be biased. Furthermore, when the experiment is terminated before all the samples have failed, the mean time to failure based on simple averages will be biased because of the inclusion of unfailed data. To improve the methodology for estimating shelf life, knowledge of the statistical distribution of shelf life failures is required, together with an appropriate model for data analysis. This important aspect is discussed further in Chapter 3.
Microbial spoilage of foods is an economically signifi cant problem for food manufacturers, retailers, and consumers. Depending on the product, process, and storage conditions, the microbio-logical end of shelf life can be determined by either the growth of spoilage or pathogenic micro-organisms. Over recent years the development and commercialization of predictive models have become relatively widespread. Predictive models have been used to determine the likely shelf life of perishable foods such as meat, fi sh, and milk. Despite their increasing sophistication and wide-spread availability, models should not be relied on completely but should rather be used as a tool to assist decision making. Models do not completely negate the need for microbial testing, nor do they replace the judgment of trained and experienced food microbiologists. The use of such models can reduce the need for shelf life trials, challenge tests, product reformulations, and process modifi ca-tions, thus saving both time and money. The ultimate test for predictive models is whether they can be used to predict outcomes reliably in real situations. For a detailed discussion the reader is referred to Chapter 4.
REFERENCES
Anonymous. 1974. Shelf Life of Foods. Report by the Institute of Food Technologists’ Expert Panel on Food Safety and Nutrition and the Committee on Public Information, Institute of Food Technologists, Chicago, Illinois. Journal of Food Science 39: 861–865.
Anonymous. 1993. Shelf Life of Foods: Guidelines for Its Determination and Prediction. London, England: Institute of Food Science and Technology, Inc.
78445_C001.indd 1578445_C001.indd 15 11/3/2009 5:19:59 PM11/3/2009 5:19:59 PM
© 2010 by Taylor and Francis Group, LLC

16 Food Packaging and Shelf Life
Begley T.H., Brandsch J., Limma W., Siebert H., Piringer O. 2008. Diffusion behaviour of additives in polypro-pylene in correlation with polymer properties. Food Additives Contaminants 11: 1409–1415.
Cardelli C., Labuza T.P. 2001. Application of Weibull Hazard Analysis to the determination of the shelf life of roasted and ground coffee. LWT—Food Science & Technology 34: 273–278.
Cheftel J.C. 2005. Food and nutrition labelling in the European Union. Food Chemistry 93: 531–550.Del Nobile M.A., Mensitieri G., Nicolais L., Masi P. 1997. The infl uence of the thermal history on the shelf life
of carbonated beverages bottled in plastic containers. Journal of Food Engineering 34: 1–13.Gnanaraj J., Welt, B.A., Otwell W.S., Kristinsson H.G. 2005. Infl uence of oxygen transmission rate of packag-
ing fi lm on outgrowth of anaerobic bacterial spores. Journal of Aquatic Food Product Technology 14(4): 51–69.
Grob K., Biedermann M., Scherbaum E., Roth M., Rieger K. 2006. Food contamination with organic materials in perspective: packaging materials as the largest and least controlled source? A view focusing on the European situation. Critical Reviews in Food Science and Nutrition 46: 529–535.
Jakobsen M., Jespersen L., Juncher D., Miquel Becker E., Risbo J. 2005. Oxygen and light barrier properties of packaging materials used for modifi ed atmosphere packaging. Evaluation of performance under realistic storage conditions. Packaging Technology and Science 18: 265–272.
Krochta J.M. 2007. Food packaging. In: Handbook of Food Engineering, 2nd edn. Heldman D.R. & Lund D.B. (Eds). Boca Raton, Florida: CRC Press, pp. 847–927.
Labuza T. P., Schmidl M.K. 1988. Use of sensory data in the shelf life testing of foods: principles and graphical methods for evaluation. Cereal Foods World 33: 193–205.
Lee D.S., Yam K.L., Piergiovanni L. 2008. Food Packaging Science and Technology. Boca Raton, Florida: CRC Press.
Lockhart H.E. 1997. A paradigm for packaging. Packaging Technology and Science 10: 237–252.Masi P., Paul D.R. 1982. Modelling gas transport in packaging applications. Journal of Membrane Science 12:
137–151.Massey L. 2003. Permeability Properties of Plastics and Elastomers, 2nd edn. New York: Plastics Design
Library.Pauly A.S. 1999. Permeability and diffusion data. In: Polymer Handbook, 4th edn. Brandrup J., Immergut E.H.
& Grulke E.A. (Eds). New York: Wiley, Section VI/543.Piringer O.-G., Baner A.L. (Eds). 2008. Plastic Packaging Interactions with Food and Pharmaceuticals, 2nd
edn. Weinheim, Germany: Wiley-VCH.Robertson G.L. 2006. Food Packaging Principles and Practice, 2nd edn. Boca Raton, Florida: CRC Press.Robertson G.L. 2009. Food packaging. In: Textbook of Food Science and Technology, Campbell-Platt G. (Ed).
Oxford, England: Wiley-Blackwell, pp. 279–298.Yam K.L. (Ed). 2009. The Wiley Encyclopedia of Packaging Technology, 3rd edn. New York: John Wiley &
Sons Inc.Yoxall A., Luxmoore J., Rowson J., Langley J., Janson R. 2007. Size does matter: further studies in hand-pack
interaction using computer simulation. Packaging Technology and Science 21: 61–72.
78445_C001.indd 1678445_C001.indd 16 11/3/2009 5:19:59 PM11/3/2009 5:19:59 PM
© 2010 by Taylor and Francis Group, LLC


![Latest Technology for Waterless Flower Packaging with Extended Shelf Life [Company Update]](https://img.dokumen.tips/doc/110x75/577c7a971a28abe054958ca5/latest-technology-for-waterless-flower-packaging-with-extended-shelf-life-company.jpg)