Embed Size (px)
Citation preview

1
Fairfax County Fiscal Outlook
Mount Vernon Town Meeting Mount Vernon Town Meeting February 3, 2007February 3, 2007
Edward L. LongEdward L. LongDeputy County ExecutiveDeputy County Executive
www.fairfaxcounty.gov/dmb

2
FY 2007 General Fund Receipts(“Where It Comes From”)
(subcategories in millions)
FY 2007 GENERAL FUND RECEIPTS = $3,212,069,060 For presentation purposes, Personal Property Taxes of $211,313,944 that are reimbursed by the Commonwealth as a result of the Personal Property Tax Relief Act of 1998 are included in the Personal Property Taxes category.
REVENUE FROM THE FEDERAL GOVERNMENT
$44,050,780 Social Services Aid $42.7 Other $1.4
REVENUE FROM THE COMMONWEALTH*
$85,003,220 VA Public Assistance $29.2 Law Enforcement $17.9 Other $37.9
FINES AND FORFEITURES $15,241,666
District Court Fines $8.1 Parking Violations $3.2 Other $3.9
1.0%
PERMITS, FEES & REGULATORY LICENSES
$33,546,014 Building Permits/ Inspection Fees $26.6 Other $6.9
2.6%
1.7%
LOCAL TAXES $488,866,064
Local Sales Tax $166.1 B.P.O.L. $131.3 Utility Tax $86.3 Other $105.2
15.2%
RECOVERED COSTS/ OTHER REVENUE
$7,209,208
0.2%
REVENUE FROM THE USE OF MONEY AND PROPERTY
$74,366,689
2.3% 0.5%
CHARGES FOR SERVICES $55,878,477
SACC Fees $25.9 Clerk Fees $11.1 EMS $8.0 Recreation Fees $3.2 Other $7.7
PERSONAL PROPERTY TAXES * $515,667,824
Current $503.7 Delinquent $12.0
16.1%%
REAL ESTATE TAXES $1,892,239,118
Current $1,883.9 Delinquent $8.3
58.9%
1.4%

3
General Fund Receipts
County continues to be overly dependent on real estate taxes – 60% of total revenues
Personal Property Taxes (16.1%) and Local Taxes (15.2%), such as sales, BPOL, and utilities, reflect very moderate increases
County cannot tax income

4
Local Contribution to State Individual Income Tax Revenue
% of Income Tax Liability % of State Population
Fairfax County 24.4% 13.5%
Northern Virginia* 43.4% 27.0%
*Planning District 8 localities: Arlington, Alexandria, Fairfax City, Fairfax County, Falls Church, Loudoun, Manassas, Manassas Park, and Prince William County

5
(subcategories in millions)
FY 2007 GENERAL FUND DISBURSEMENTS = $3,213,678,996
FY 2007 General Fund Disbursements (“Where It Goes”)
COUNTY DEBT $110,691,161
JUDICIAL ADMINISTRATION
$31,499,936 Sheriff $16.8 Circuit Court $10.3 Other $4.4
TRANSFERS $159,848,862
Capital $33.6 Information Technology $12.5 County Transit $30.7 Metro $20.3 Other $62.7
PUBLIC SAFETY $409,460,671
Police $166.3 Fire $162.4 Sheriff $38.6 E911 $8.9 Other $33.3
PARKS/REC/LIBRARIES $76,578,930
Library $30.4 Parks $25.8 Recreation $20.4
LEGISLATIVE-EXECUTIVE FUNCTIONS $26,447,644
County Executive $7.9 County Attorney $6.0 Board of Supervisors $4.7 Other $7.8
CENTRAL SERVICES $72,363,771
Information Technology $26.8 Tax Administration $23.2 Finance $8.8 Other $13.6
NONDEPARTMENTAL $194,032,161
Employee Benefits $194.0
COMMUNITY DEVELOPMENT $48,064,233
Land Development Services $14.9 Planning & Zoning $10.5 Economic Development Authority $ 6.6 Other $16.1
HEALTH AND WELFARE $353,465,667
Family Services $194.2 Community Services Board $97.5 Health $45.2 Other $16.6
PUBLIC WORKS $63,738,503
Facilities Mgt. $42.9 Other $20.8
0.8%
2.3%
6.0%
1.5%
2.4%
12.7% 5.0%
51.9%
2.0%
1.0%
11.0%
3.4%
SCHOOLS $1,667,487,457
Transfer $1,525.2 Debt Service $142.3

6
General Fund Disbursements
Schools represent 51.9% of disbursements: Includes annual bond sales of $155 million Board of Supervisors’ FY 2008 Budget
Guideline of 3.5% Other General Fund services provided --$57.6 million
School Crossing Guards, School Resource Officers, Clinic Room Aides, etc.
Growing pressure to address public safety staffing requirements (12.7%)
Health and Welfare requirements to address childcare and elderly service issues (11.0%)
Dedicated Pennies on Real Estate Tax: Affordable Housing Stormwater Management

7
General Fund Revenue Growth
9.50%
5.07%
2.50%
7.59%
6.61%
7.32%7.42%7.48%7.34%
3.83%
12.22%
0%
2%
4%
6%
8%
10%
12%
14%
16%
1980-1991
Average
1992-1999
Average
2000 2001 2002 2003 2004 2005 2006 2007 2008
Growth rate without tax cut: 8.3% 9.3% 9.3% 17.7% 11.0% Real estate tax cut 2¢ 5¢ 3¢ 13¢ 11¢
(Preliminary)

8
Changing Economic Factors Job Growth
Last year: Expected 25,000 new jobs in 2005 and 22,000 in 2006
Now: 2005 job rose 22,000 & expect 16,000 in 2006
Federal Procurement Spending Last year: 2004 area spending rose $8.0 billion (18%
increase) and 2005 forecast to increase 15% Now: 2005 estimates revised to increase $1.3 billion
(2.5% growth)
Real Estate Market Last year: Robust market with anticipation of at
least double digit increases in assessments Now: Residential market contracting, no growth
anticipated for residential assessments

9
Annual Changes in Residential Equalization FY 1989 – FY 2008
13.06%
5.13%
11.26%
16.27%
14.55%
11.29%
23.09%
0.00%0.02%
19.01%
0.49%0.04%
0.77%
-1.90%
-3.74%
-0.23% -0.50%-0.52%
15.53%
20.57%
-5%
0%
5%
10%
15%
20%
25%
1989 1990 1991 1992 1993 1994 1995 1996 1997 1998 1999 2000 2001 2002 2003 2004 2005 2006 2007 2008(est)

10
Real Estate Tax Base
* Preliminary
FY 1989 FY 1990 FY 1991 FY 1992 FY 1993 FY 1994 FY 1995 FY 1996 FY 1997 FY 1998
Equalization 15.04% 18.27% 11.51% (2.75%) (6.48%) (2.46%) (1.29%) 0.36% 0.57% 0.80%
- Residential 15.53% 19.01% 13.06% (1.90%) (3.74%) (0.52%) 0.01% 0.49% 0.23% (0.50%)
- Nonresidential 13.81% 16.54% 7.85% (4.80%) (13.22%) (7.86%) (5.28%) (0.09%) 3.27% 5.05%
Growth 9.54% 7.61% 5.26% 1.79% 0.40% 1.08% 1.97% 2.16% 2.13% 1.93%
TOTAL 24.58% 25.88% 16.77% (0.96%) (6.08%) (1.38%) 0.68% 2.52% 2.70% 2.73%
FY 1999 FY 2000 FY 2001 FY 2002 FY 2003 FY 2004 FY 2005 FY 2006 FY 2007 FY 2008*
Equalization 1.77% 2.96% 5.13% 9.70% 11.72% 9.94% 9.54% 20.80% 19.76% 2.00%
- Residential 0.04% 0.77% 5.13% 11.26% 16.27% 14.55% 11.29% 23.09% 20.57% 0.00%
-Nonresidential 7.12% 9.24% 5.15% 5.92% 0.52% (2.94%) 3.74% 12.74% 16.64% 10.00%
Growth 2.19% 3.37% 3.81% 3.94% 3.42% 2.54% 2.50% 2.69% 2.94% 1.30%
TOTAL 3.96% 6.33% 8.94% 13.64% 15.14% 12.48% 12.04% 23.49% 22.70% 3.30%
Estimated value of one penny in FY 2008 = $22.6 million

11
Housing Market has Cooled
Real estate market is cyclical
o Pattern of housing market cooling is similar to 1990 (FY 1992 assessments)
• Number of home sales has declined • Inventory of homes for sale is up • Homes are remaining on the market longer• Sales Prices have weakened
o From FY 1992 to FY 2000 residential assessments were negative or flat

12
Listings and Sales
Number of Homes Sold - Fairfax County 2005 2006 % Change
March 1,675 1,386 (17.3%) June 2,737 1,680 (38.6%)
Sept 1,422 1,072 (24.6%) Dec 1,621 1,223 (24.5%)
Active Listings - Fairfax County
2005 2006 % ChangeMarch 1,534 6,542 326.5%
June 3,181 9,153 187.7%Sept 5,165 8,455 63.7%
Dec 4,218 5,420 28.5%

13
15 16 1722
26
36 36
48
57
6259
55
51 50
59
67
77
84
91
97
5
15
25
35
45
55
65
75
85
95
105
May Jul Sept Nov Jan Mar May Jul Sep Nov
Average Days to Sell a Home in Fairfax County
2005 2006
Dec

14
Changes in Home Sales Price in Fairfax County
Average Sales Price Change
2005 2006
March 21.5% 6.2%
June 20.9% 2.3%
Sept 22.9% (6.0%)
Dec 15.7% (3.9%)
Average Sales Price to List Price
2005 2006
March 100.9% 97.3%
June 100.4% 96.0%
Sept 98.0% 93.8%
Dec 96.7% 93.5%
Source: Metropolitan Regional Information Systems (MRIS)

15
Differences in the Economy Job Creation in Fairfax County
Then
1990 1991
Employment 371,492 366,704
Change in jobs (2,711) (4,788)
Percent Change (0.7%) (1.3%)
Now
2005 2006 est.
Employment 580,129 596,129
Change in jobs 22,559 16,000
Percent Change 4.0% 2.8%
Source: Stephen Fuller, GMU Center for Regional Analysis

16
Causes of Declining Market
FY 1992 Real Estate market declined due to a loss of jobs – decline in the demand for housing
Current decline is the result of unsustainable price appreciation over several years Profit lead speculation especially in the condo market
contributed to this rise
Homes are less affordable Since 2001, values have increased 160%
Incomes have not kept up with house prices Since 2001, income has risen 9%

17
% of Houses Sold by Price Range in Fairfax County
51.0
6.0
16.027.0 27.0
6.5
19.5
47.0 46.043.0
10.0
1.00
20
40
60
< $200K $200K - $300K $300K - $500K > $500K
1999 2004 2005
Source: Metropolitan Regional Information Systems (MRIS)
PercentAll Units

18
Fairfax County Residential Real Estate
Mean assessed value of residential property rose from $208,126 in FY 2001 to $540,746 in FY 2007: A 160% increase, or an average of 17.3% per year
Tax rate reduced from $1.23/$100 of assessed value in FY 2002 to $0.89/$100 in FY 2007
Tax increase even with tax rate reduction:• Typical household will pay $4,813 in real estate taxes in
FY 2007, an increase of $328, or 7.3% over FY 2006 and $1,925, or 66.7%, over FY 2002
• Without tax cuts, typical household would have paid an additional $3,512 in real estate taxes since FY 2002

19
Expectations for FY 2008 Residential Assessments
o No growth in residential assessments expected in FY 2008
o Cautiously optimistic that values will not decline in FY 2008 because the economy is stronger Job growth versus job losses Low mortgage interest rates Home appreciation continued for a portion of the year
o Market rebalance Unsustainable price appreciation Investor speculation
20
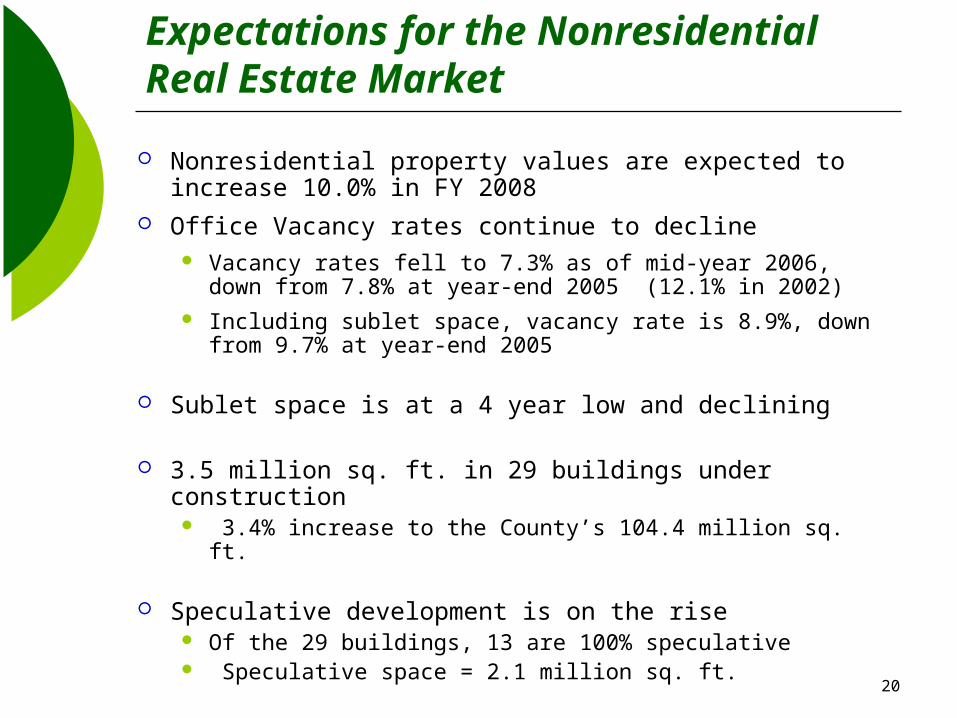
Expectations for the Nonresidential Real Estate Market
Nonresidential property values are expected to increase 10.0% in FY 2008
Office Vacancy rates continue to decline Vacancy rates fell to 7.3% as of mid-year 2006, down
from 7.8% at year-end 2005 (12.1% in 2002) Including sublet space, vacancy rate is 8.9%, down
from 9.7% at year-end 2005
Sublet space is at a 4 year low and declining
3.5 million sq. ft. in 29 buildings under construction 3.4% increase to the County’s 104.4 million sq. ft.
Speculative development is on the rise Of the 29 buildings, 13 are 100% speculative Speculative space = 2.1 million sq. ft.

21
Nonresidential Real Estate Commercial / Industrial Percentage
Commercial/Industrial percentage of total real estate assessment base:
FY 1990 = 26.76% (highest rate in over a decade) FY 1996 = 19.04% FY 2001 = 25.37% FY 2002 = 24.84% FY 2003 = 21.97% FY 2004 = 19.14% FY 2005 = 18.20% FY 2006 = 17.36% FY 2007 = 17.22% FY 2008 (est) = 18.50%
Will gradually rise as residential values stabilize and nonresidential values increase moderately

22
Looking Ahead to FY 2009 and Beyond Nonresidential Market
Speculative building may lead to an excess supply
Slowdown in Federal procurement spending will impact the demand for office space
Values will continue to rise into FY 2009 but at a more moderate rate than FY 2007 and FY 2008
23
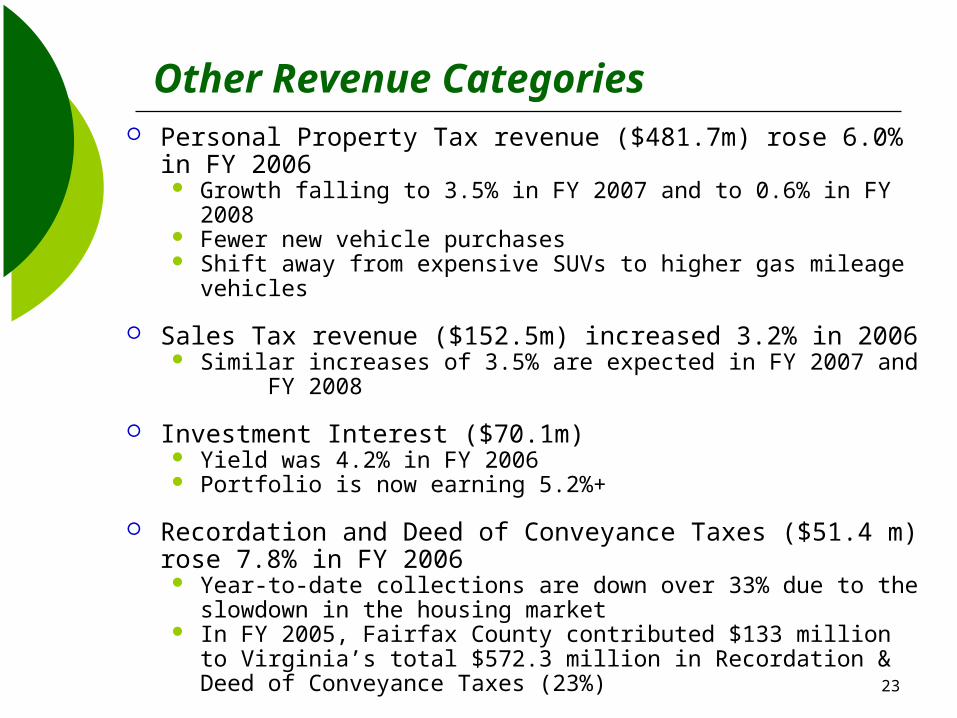
Other Revenue Categories Personal Property Tax revenue ($481.7m) rose 6.0% in FY 2006
Growth falling to 3.5% in FY 2007 and to 0.6% in FY 2008 Fewer new vehicle purchases Shift away from expensive SUVs to higher gas mileage vehicles
Sales Tax revenue ($152.5m) increased 3.2% in 2006 Similar increases of 3.5% are expected in FY 2007 and FY 2008
Investment Interest ($70.1m) Yield was 4.2% in FY 2006 Portfolio is now earning 5.2%+
Recordation and Deed of Conveyance Taxes ($51.4 m) rose 7.8% in FY 2006 Year-to-date collections are down over 33% due to the slowdown in
the housing market In FY 2005, Fairfax County contributed $133 million to Virginia’s
total $572.3 million in Recordation & Deed of Conveyance Taxes (23%)

24
FY 2008 Budget Schedule
County Executive Releases Budget February 26, 2007
Budget Public Hearings April 9 - 11, 2007
Budget Mark-Up April 23, 2007
Budget Adoption April 30, 2007
Budgets are available on the web at:
www.fairfaxcounty.gov/dmb