Embed Size (px)
Citation preview

11
Externality Analysis of the Flue Gas Desulphuriza Externality Analysis of the Flue Gas Desulphuriza tion System tion System
-at Mae Moh Lignite -at Mae Moh Lignite ff ired Power Plant ired Power Plant ii n Thailand n Thailand -from LCA -from LCA NETSNETS Point of View Point of View
Sate Sampattagul, Prof. Seizo KatoProf. Tanongkiat Kiatsiriroat, Anugerah Widiyanto
Energy System Design Laboratory, Mechanical Engineering Department, Faculty of Engineering, Mie University

22
Underlying CausesUnderlying Causes Energy, Environment and EconomicEnergy, Environment and Economic
Energy
Economic
Environment
3E3E tri-lemma tri-lemma3E3E tri-lemma tri-lemma““Top-runner" approach Top-runner" approach ““Top-runner" approach Top-runner" approach
Green procurement policyGreen procurement policyGreen procurement policyGreen procurement policy
Eco labeling and green taxationEco labeling and green taxationEco labeling and green taxationEco labeling and green taxation
SolutionSolution
LCA and LCC LCA and LCC LCA and LCC LCA and LCC

33
Overview of Mae Moh Power PlantOverview of Mae Moh Power Plant
Overall capacity 2,625 MW of 13 unitsOverall capacity 2,625 MW of 13 units Largest open mining of Lignite site Largest open mining of Lignite site
nearby the power plantnearby the power plant Lignite proved reserve approximately aboLignite proved reserve approximately abo
ut 1,332 [Million-ton] could be use more 1ut 1,332 [Million-ton] could be use more 118 years18 years
High sulphur content of lignite 2-3% and High sulphur content of lignite 2-3% and low calorific heating value 2,750 low calorific heating value 2,750 kcal/kgCoalkcal/kgCoal
There were serious impacts to the There were serious impacts to the villagers due to SOvillagers due to SO22 over emission in over emission in
1992 and more than 1,000 people were 1992 and more than 1,000 people were suffered from the respiratory symptomsuffered from the respiratory symptom
FGD systems have been installed to FGD systems have been installed to solve the problem since 1993solve the problem since 1993

44
FGD: Flue Gas Desulphurization SystemFGD: Flue Gas Desulphurization System
Limestone wet scrubbing systems have Limestone wet scrubbing systems have been installed for the power generating been installed for the power generating stations unit 4 to unit 13stations unit 4 to unit 13
The efficiency of SOThe efficiency of SO22 demolition are demolition are
approximately 92 – 97%approximately 92 – 97% SO2 produced = 0.68 [Mton/year]SO2 produced = 0.68 [Mton/year] Limestone consumption = 1.20 [Mton/year]Limestone consumption = 1.20 [Mton/year] SO2 Emission = 0.03 [Mton/year]SO2 Emission = 0.03 [Mton/year] Byproduct Gypsum = 1.92 [Mton/year]Byproduct Gypsum = 1.92 [Mton/year]

55
SULFUR DIOXIDE FROMMAE-MOH POWER PLANT FISCAL YEAR 1988 - 2001
0
100,000
200,000
300,000
400,000
500,000
600,000
700,000
800,000
1988 1989 1990 1991 1992 1993 1994 1995 1996 1997 1998 1999 2000 2001
SULF
UR D
IOXI
DE (T
ONS/Y
EAR)
$0
$5,000
$10,000
$15,000
$20,000
GENE
RATI
ON (G
Wh/Y
EAR)
SO2 PRODUCED SO2 EMISSION GENERATION GWh

66
NETS NETS (NNumerical EEco-load TTotal SStandardization)
Environmental Environmental
load factorsload factorsNo.No.
Consolidated Consolidated
standardization valuesstandardization values
GlobalGlobal
ScaleScale
Depletion of fossil fuelDepletion of fossil fuel 44 Proven ReserveProven Reserve
Global warmingGlobal warming 4343 GHG emissions, GWPGHG emissions, GWP
Ozone layer depletionOzone layer depletion 2424 Emission of CFCs, ODPEmission of CFCs, ODP
Air and Water pollutionAir and Water pollution ManyMany WHO regulation valuesWHO regulation values
DistrictDistrict
ScaleScale
Acid rainAcid rain 77 [H+] Concentration in rain[H+] Concentration in rain
Waste problemWaste problem 22Amount of residuals in Amount of residuals in disposaldisposal
[NETS]kWh,...kg,
NETSkWh,...]kg,[ iii MEVELMP
Loader: Giving allowable environmental load
Receiver: Received allowable environmental load
Pi [kg, kWh,m3, …, etc.] MEVi [NETS]
L-R Tolerance Balance TheoryL-R Tolerance Balance TheoryL-R Tolerance Balance TheoryL-R Tolerance Balance Theory

77
Maximum sufferable load of the biological capacity; e.g., for one person
100 [NETS]100[NETS/person] x (6.0×10⁹) persons
= 6.0×10¹¹ [NETS]
(World population in 1999 = 6.0×10⁹ persons )
MEVMEVGG

88
Example: Fossil fuel depletion (Oil)
[NETS/ton] 4.11
reserves) (Proved
capacity) carrying searth' (the
OilELM
Consumption 1 [ton] Give impact 4.11 [NETS]
MEVG = 6.0×10¹¹ [NETS]
Poil = 1.46 x 10¹¹ton

99
Process Tree of FGD.Process Tree of FGD.
FGD systemsLimestone extraction
Transportation to FGD
Construction of transportation
equipment
Construction of
FGD
Construction of mining
equipment
Material Energy
Emission to Air Emission to Water
Waste

1010
0.00E+00 2.00E-05 4.00E-05 6.00E-05 8.00E-05 1.00E-04 1.20E-04 1.40E-04 1.60E-04
Limestone Extraction
Transportation
FGD Construction
Operation
Eco-Load of FGD System at LCA step
Fossil Fuel Depletion
Resources Depletion
Global Warming
Air Pollution
Acidification
NETS/kWh
3.33E-5
3.39E-5
2.30E-5
1.46E-4

1111
LCC AnalysisLCC Analysis
Unit lifetime [Years]Unit lifetime [Years] Up to 30Up to 30
Investment CostInvestment Cost (8 (8 units)units)
218.42 Million dollars/year218.42 Million dollars/year
Maintenance CostMaintenance Cost 2.70 Million dollars/year2.70 Million dollars/year
Operating CostOperating Cost 18.13 Million dollars/year18.13 Million dollars/year
Limestone CostLimestone Cost 1.86 Million dollars/year1.86 Million dollars/year
Others CostOthers Cost 22.80 Million dollars/year22.80 Million dollars/year
Interest rateInterest rate 8%8%
Rate of growthRate of growth 5%5%
n
n
ii
iLCCFGDNPV
1
11)(
NPVFGD (i=8%, 30 years) = 513.25 Million dollars (467.63 Million Euro)

1212
LCA-NETS & LCCLCA-NETS & LCC
Investment Cost
FGDInput Output
Fuel + Maintenance + Others Cost
30 Years
LCA-NETS Value
LCC Value
LCC/LCA [/NETS] = Total Cost [Euro]
Total Emission [ton SO2]*Impacts per unit [NETS/ton SO2]
FGD environmental impact costing = 0.72 Euro/[NETS]

1313
Calculating Externality CostsCalculating Externality Costs
Externality costs = Size of Insult x VEDExternality costs = Size of Insult x VED
• Externality costs = total external cost to society Externality costs = total external cost to society [Euro, dollars, yen, baht,…][Euro, dollars, yen, baht,…]
• Size of insult = [NETS]Size of insult = [NETS]• VED = Value of environmental damage VED = Value of environmental damage [Euro/NETS, dollars/NETS,…][Euro/NETS, dollars/NETS,…]
Pollution problems contribute to the externality costs because of it can ruin Pollution problems contribute to the externality costs because of it can ruin the society and sometime without any reflection in market system.the society and sometime without any reflection in market system.
Pollution has occurred since the first step of the energy exploration until the Pollution has occurred since the first step of the energy exploration until the end user. The externality cost should be add up in each step.end user. The externality cost should be add up in each step.
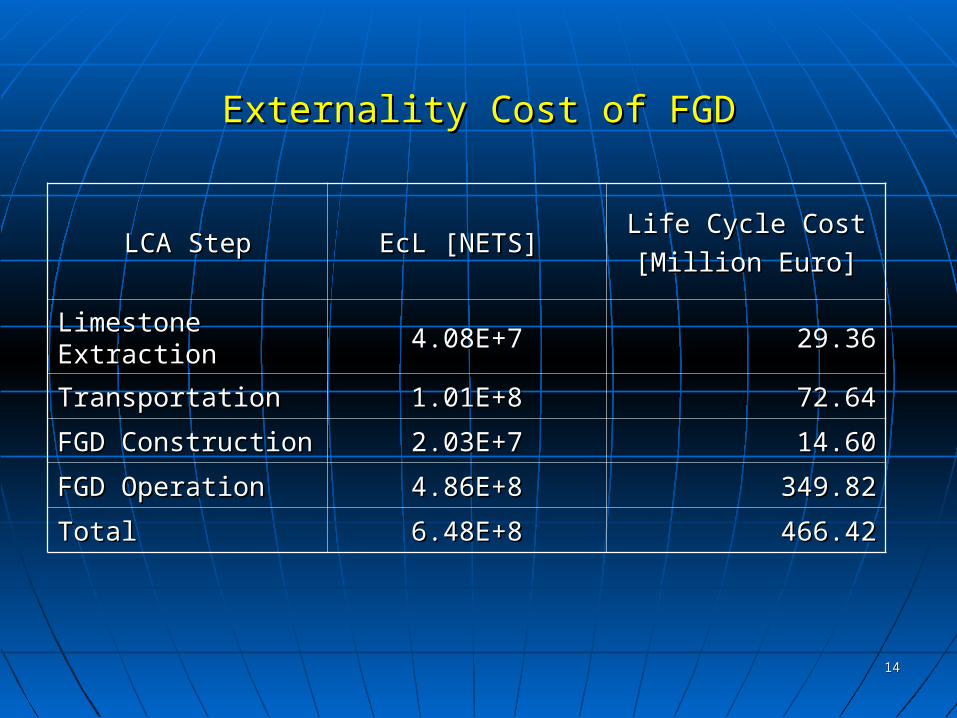
1414
Externality Cost of FGDExternality Cost of FGD
LCA StepLCA Step EcL [NETS] EcL [NETS] Life Cycle CostLife Cycle Cost
[Million Euro][Million Euro]
Limestone ExtractionLimestone Extraction 4.08E+74.08E+7 29.3629.36
TransportationTransportation 1.01E+81.01E+8 72.6472.64
FGD ConstructionFGD Construction 2.03E+72.03E+7 14.6014.60
FGD OperationFGD Operation 4.86E+84.86E+8 349.82349.82
Total Total 6.48E+86.48E+8 466.42466.42

1515
Benefit & Cost AnalysisBenefit & Cost Analysis
B/C ratio = 4.88
B-C = 1,822.44 Million. Euro
BENEFITBENEFIT COSTCOST
Taxation of SOTaxation of SO22
3.50 [Euro/kgSO3.50 [Euro/kgSO22]]
Cost of SOCost of SO22 Reduction Reduction
0.69 [Euro/kgSO2]0.69 [Euro/kgSO2]
SOSO22 demolition demolition
654,929.88 [ton]654,929.88 [ton]
SOSO22 Production Production
680,877.67 [ton]680,877.67 [ton]
Saving from taxSaving from tax
2,292.25 [Million. Euro]2,292.25 [Million. Euro]
SOSO22 Reduction Cost Reduction Cost
469.81 [Million. Euro]469.81 [Million. Euro]

1616
ConclusionConclusion
2. LCA-NETS results indicated that the most serious problem of FGD has occurred when operating than others LCA step.
5. For further development, the high efficiency of SO2 control equipment or new technology of FGD system should be emphasized to minimize the emission and to maximize the efficiency of FGD.
1. LCA-NETS has high potential to diagnose the environmental problems and find the suitable method to improve the power plant system
3. Externality analysis could support to convert the impacts value in [NETS] to be the monetary value [Euro, Dollars, Baht,…]
4. Mae Moh FGD has potential to get the benefit from taxation, this mean that the taxation should be the tool to encourage the power plant and Industries to think more about environmental improvement.

1717
ThAnK yOu FoR yOuR aTtEnTiOnThAnK yOu FoR yOuR aTtEnTiOn