Embed Size (px)
Citation preview
1
Efficient Subgraph Search over Large Uncertain Graphs
Ye Yuan1, Guoren Wang1, Haixun Wang2, Lei Chen3
1. Northeastern University, China
2. Microsoft Resarch Asia
3. HKUST
Problem Definition
Query Processing Framework
Solutions
BackgroundⅠ
Ⅱ
Ⅲ
Ⅳ
OutlineOutline
ConclusionsV
Background
3
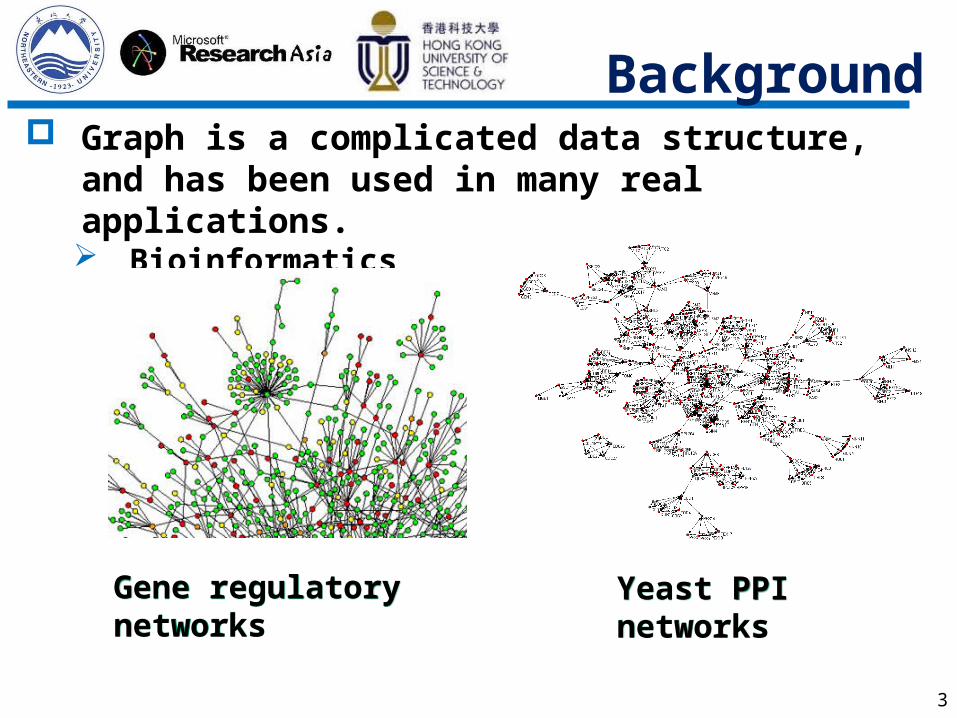
Graph is a complicated data structure, and has been used in many real applications. Bioinformatics
Yeast PPI networksYeast PPI networksGene regulatory networksGene regulatory networks
Background
4
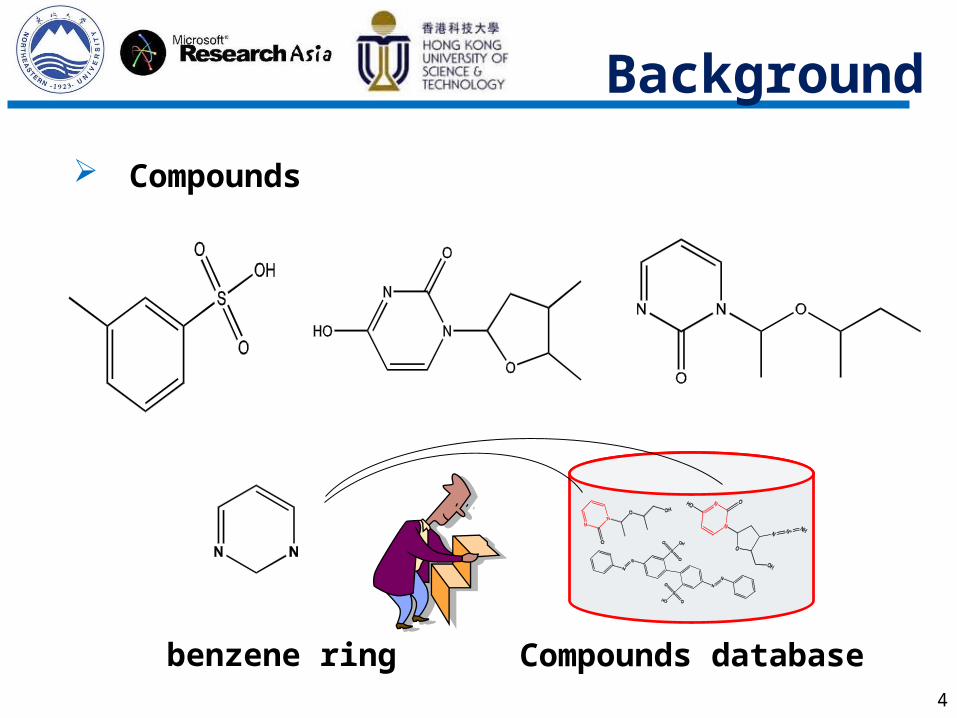
Compounds
benzene ring Compounds database
Background
5
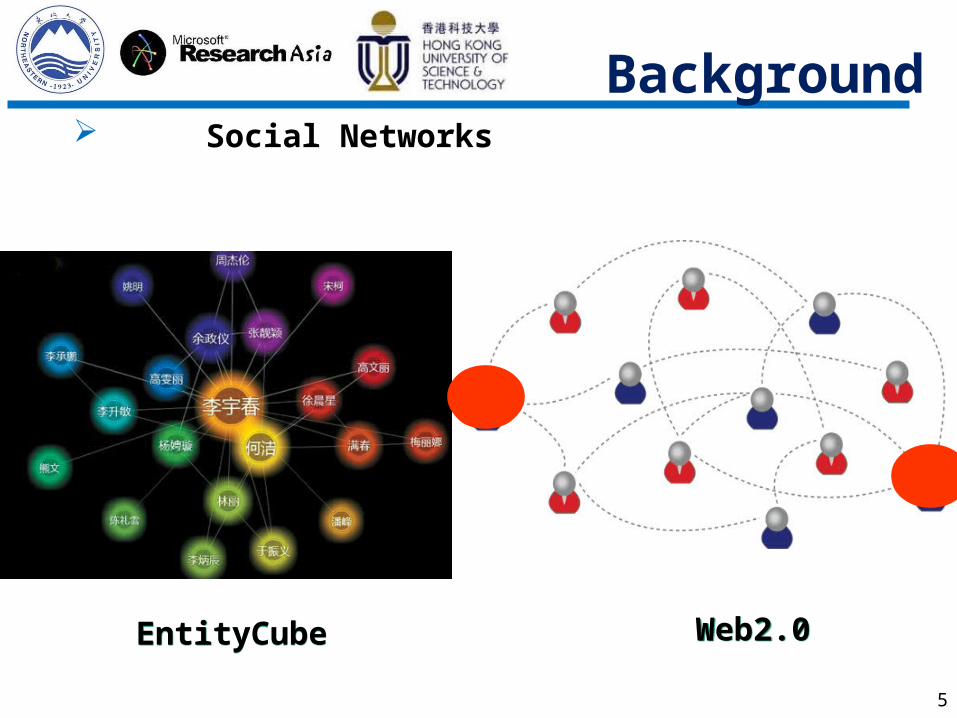
Social Networks
EntityCubeEntityCube Web2.0 Web2.0
Background
6
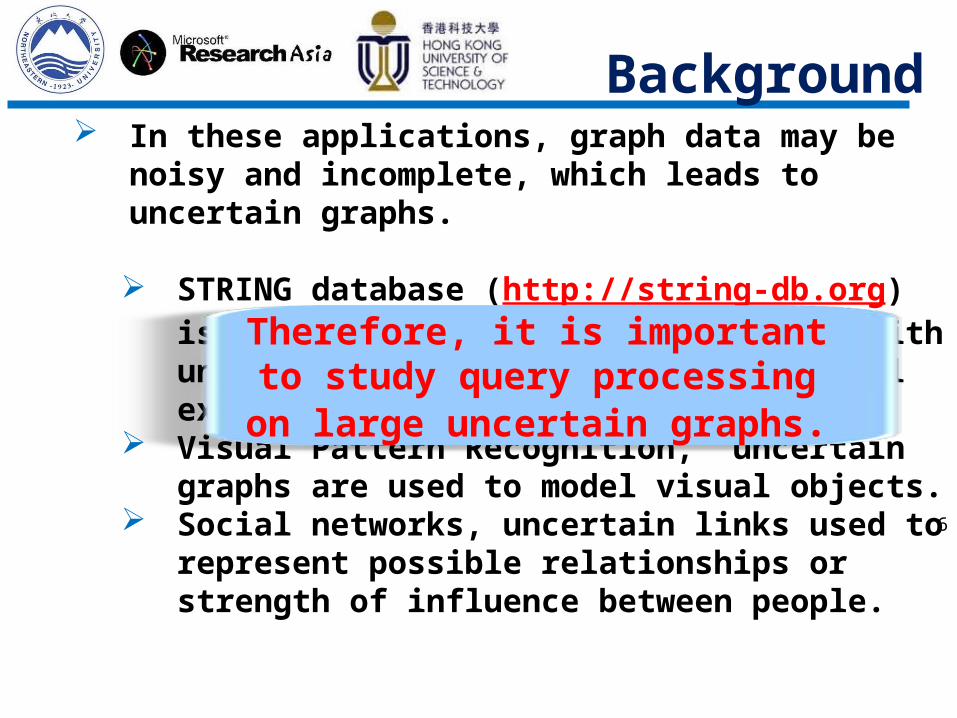
In these applications, graph data may be noisy and incomplete, which leads to uncertain graphs.
STRING database (http://string-db.org) is a data source that contains PPIs with uncertain edges provided by biological experiments.
Visual Pattern Recognition, uncertain graphs are used to model visual objects.
Social networks, uncertain links used to represent possible relationships or strength of influence between people.
Therefore, it is important to study query processing
on large uncertain graphs.
ConclusionsV
OutlineOutline
Problem Definition
Query Processing Framework
Solutions
BackgroundⅠ
Ⅱ
Ⅲ
Ⅳ
Problem DefinitionProblem Definition
8
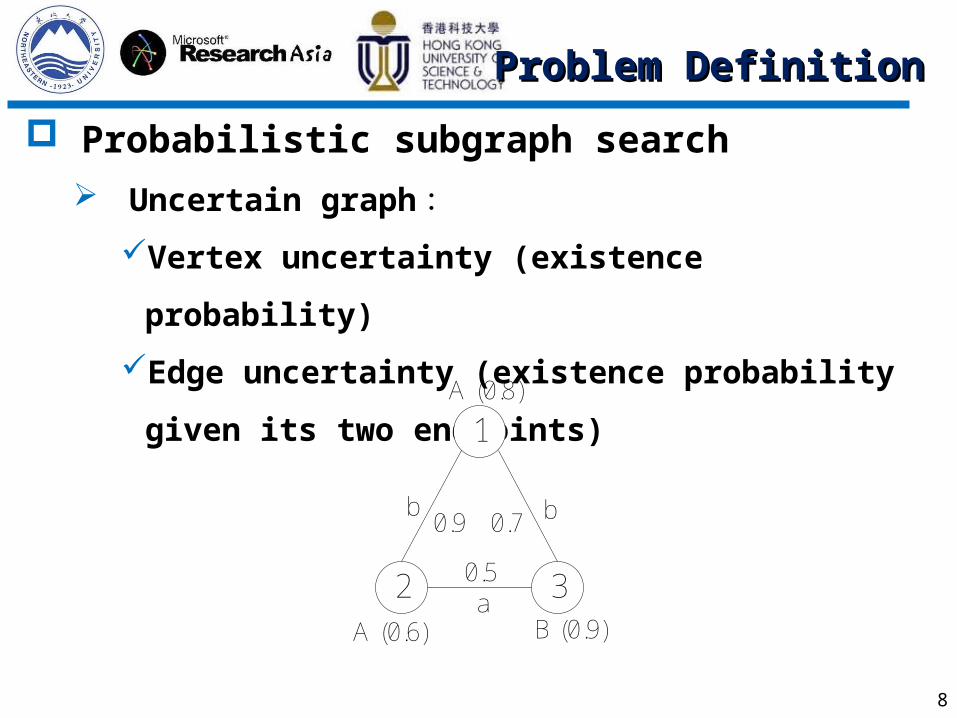
Probabilistic subgraph search
Uncertain graph :Vertex uncertainty (existence probability)
Edge uncertainty (existence probability given its two
endpoints)
A (0.6)
A (0.8)
B (0.9)
b
1
2 3a
b0.9 0.7
0.5
Problem DefinitionProblem Definition
9
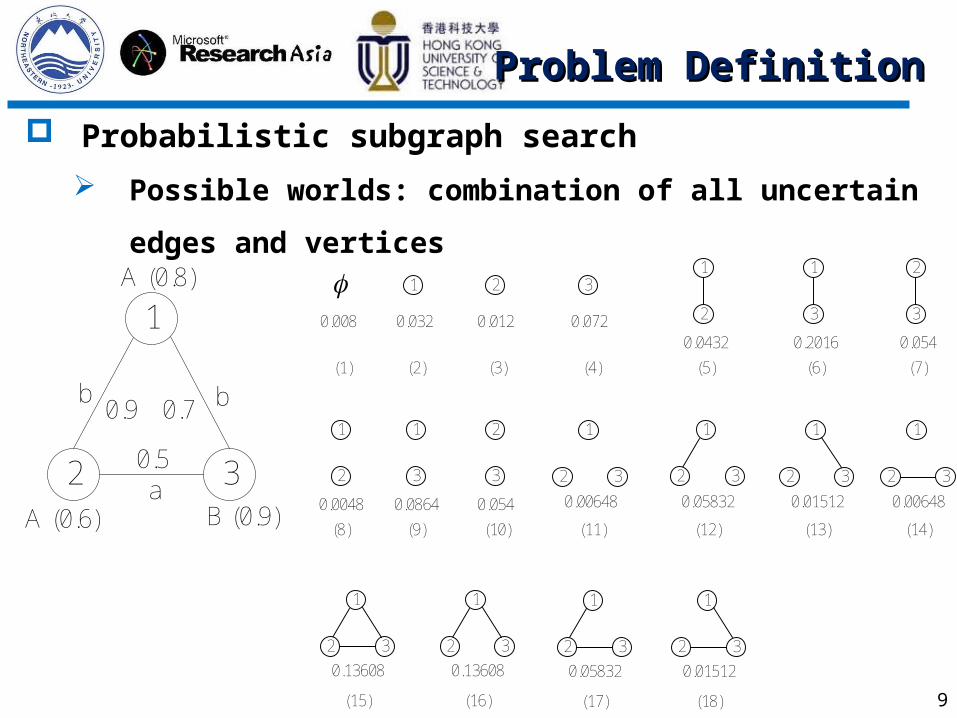
Probabilistic subgraph search
Possible worlds: combination of all uncertain edges and vertices
A (0.6)
A (0.8)
B (0.9)
b
1
2 3a
b0.9 0.7
0.5
(1)
1
(2) (3) (4) (5) (6)
2 3
0.008 0.032 0.012 0.0720.0432 0.2016
1
2
1
3
1
2 3
(7)
2
3
0.054
(8)
0.0048
1
2
(9)
0.0864
1
3
(10)
0.054
2
3
1
2 3
(11)
0.00648
(15)
0.13608
1
2 3
(12)
0.05832
1
2 3
(13)
0.01512
1
2 3
(14)
0.00648
1
2 3
(16)
0.13608
1
2 3
(17)
0.05832
1
2 3
(18)
0.01512
Problem DefinitionProblem Definition
10
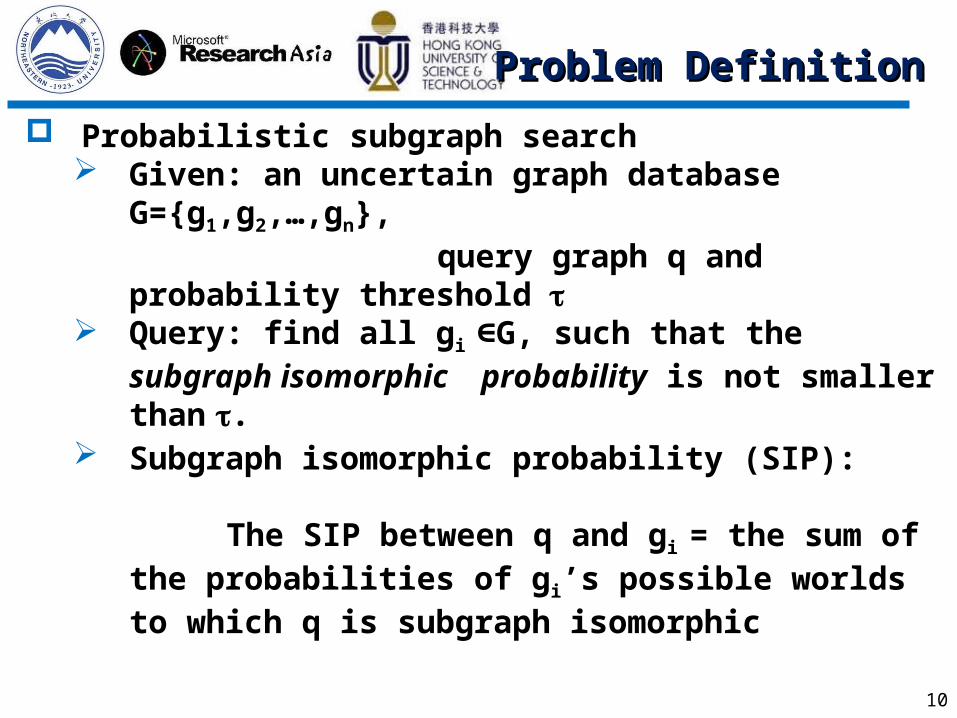
Probabilistic subgraph search Given: an uncertain graph database G={g1,g2,…,gn}, query graph q and probability threshold Query: find all gi G, such that the ∈ subgraph isomorphic
probability is not smaller than . Subgraph isomorphic probability (SIP): The SIP between q and gi = the sum of the probabilities of
gi’s possible worlds to which q is subgraph isomorphic
Problem DefinitionProblem Definition
11
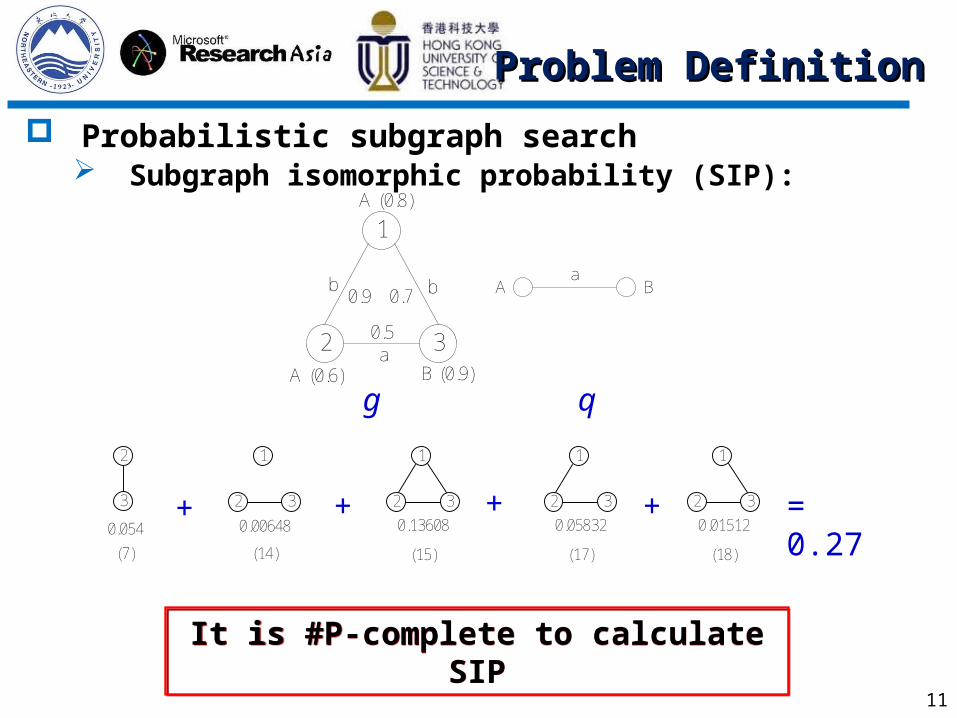
Probabilistic subgraph search Subgraph isomorphic probability (SIP):
A (0.6)
A (0.8)
B (0.9)
b
1
2 3a
b0.9 0.7
0.5
aA B
g q
1
2 3
(14)
0.00648
(7)
2
3
0.054
1
2 3
(15)
0.13608
1
2 3
(17)
0.05832
1
2 3
(18)
0.01512+ + + + = 0.27
It is #P-complete to calculate SIPIt is #P-complete to calculate SIP
ConclusionsV
OutlineOutline
Problem Definition
Query Processing Framework
Solutions
BackgroundⅠ
Ⅱ
Ⅲ
Ⅳ
Query Processing Framework
13
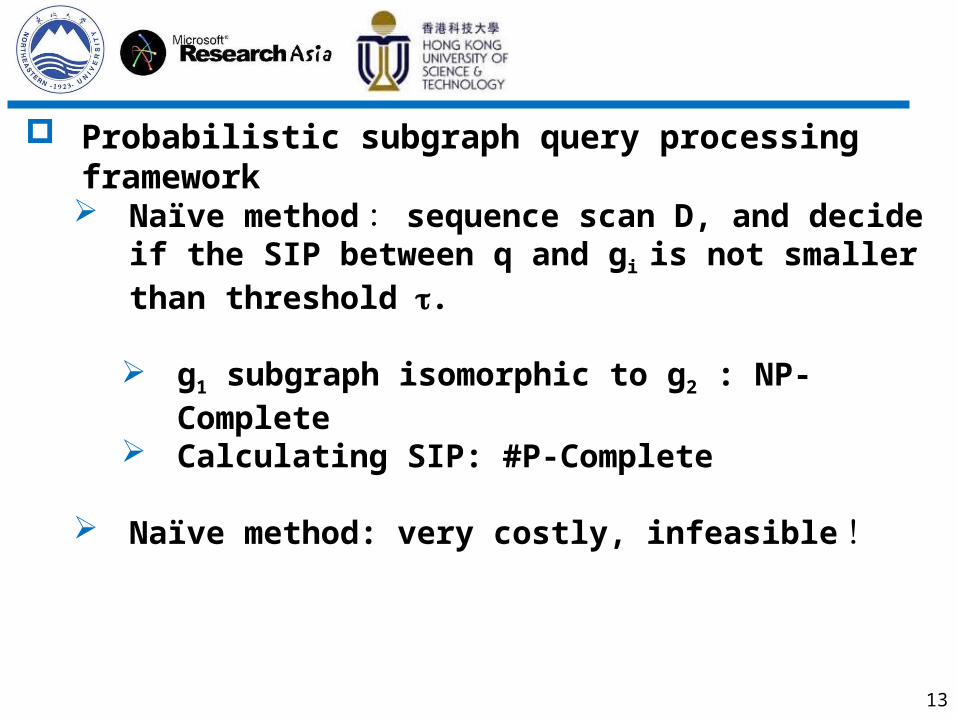
Probabilistic subgraph query processing framework Naïve method : sequence scan D, and decide if the SIP
between q and gi is not smaller than threshold .
g1 subgraph isomorphic to g2 : NP-Complete Calculating SIP: #P-Complete
Naïve method: very costly, infeasible !
Query Processing Framework
14
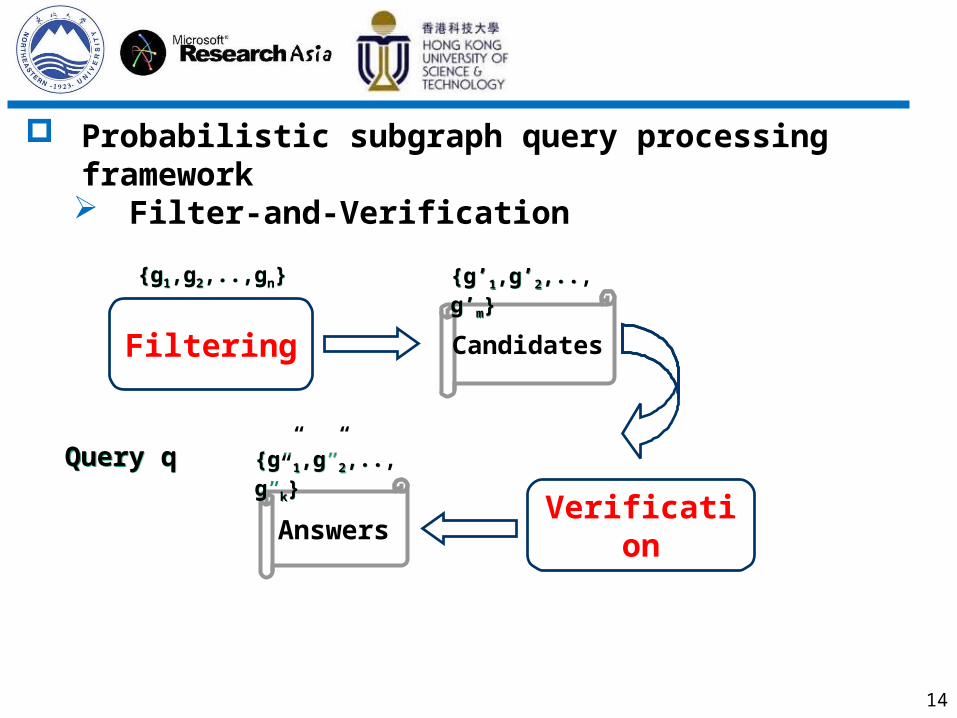
Probabilistic subgraph query processing framework Filter-and-Verification
Filtering
Verification
Candidates
Answers
{g1,g2,..,gn}{g1,g2,..,gn} {g’1,g’2,..,g’
m}{g’1,g’2,..,g’
m}
{g”1,g”2,..,g”k}{g”1,g”2,..,g”k}
Query qQuery q

ConclusionsV
OutlineOutline
Problem Definition
Query Processing Framework
Solutions
BackgroundⅠ
Ⅱ
Ⅲ
Ⅳ
SolutionsSolutions
16
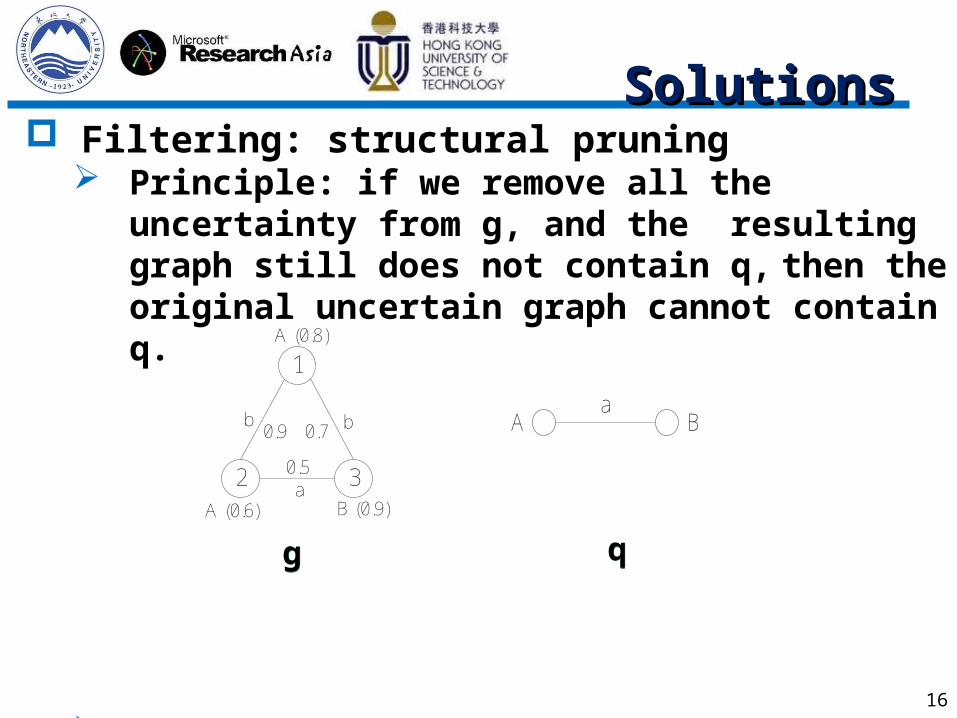
Filtering: structural pruning Principle: if we remove all the uncertainty from g, and
the resulting graph still does not contain q, then the original uncertain graph cannot contain q.
Theorem: if qgc , then Pr(qg)=0
A (0.6)
A (0.8)
B (0.9)
b
1
2 3a
b0.9 0.7
0.5
gg
aA B
SolutionsSolutions
17
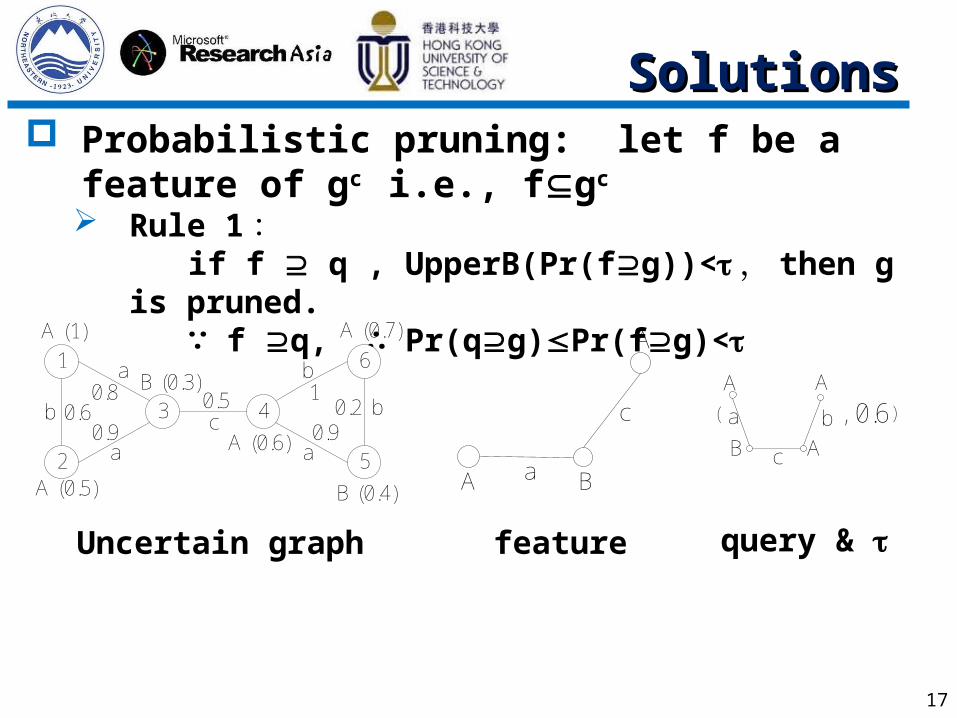
Probabilistic pruning: let f be a feature of gc i.e., fgc
Rule 1 : if f q , UpperB(Pr(fg))< , then g is pruned. ∵ f q, ∴ Pr(qg)Pr(fg)<
Uncertain graph feature query &
1
2
3 4
6
5A (0.5)
A (1)
B (0.3)
A (0.6)
A (0.7)
B (0.4)
b b
b
a
a
a
c0.60.8
0.9
0.5 1
0.90.2
A
A Ba
c a
c
b
A
B A
, 0.6 )(
A
SolutionsSolutions
18
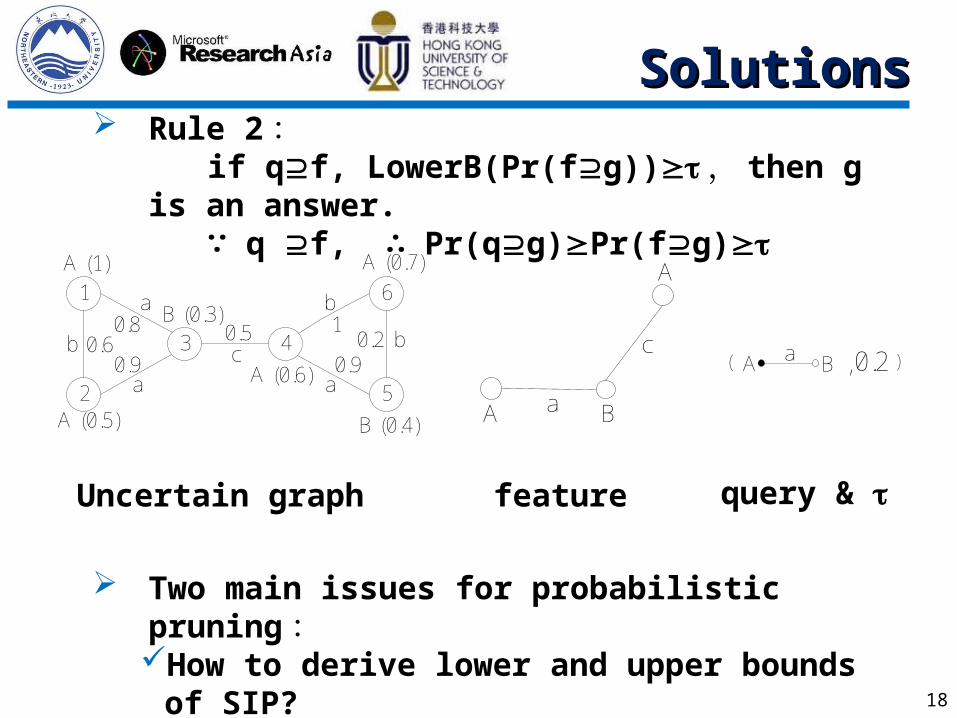
Rule 2 : if qf, LowerB(Pr(fg)) , then g is an answer. ∵ q f, ∴ Pr(qg)Pr(fg)
Two main issues for probabilistic pruning :How to derive lower and upper bounds of SIP?How to select features with great pruning power?
Uncertain graph feature query &
1
2
3 4
6
5A (0.5)
A (1)
B (0.3)
A (0.6)
A (0.7)
B (0.4)
b b
b
a
a
a
c0.60.8
0.9
0.5 1
0.90.2
A
A Ba
c a BA , 0.2 )(
SolutionsSolutions
19
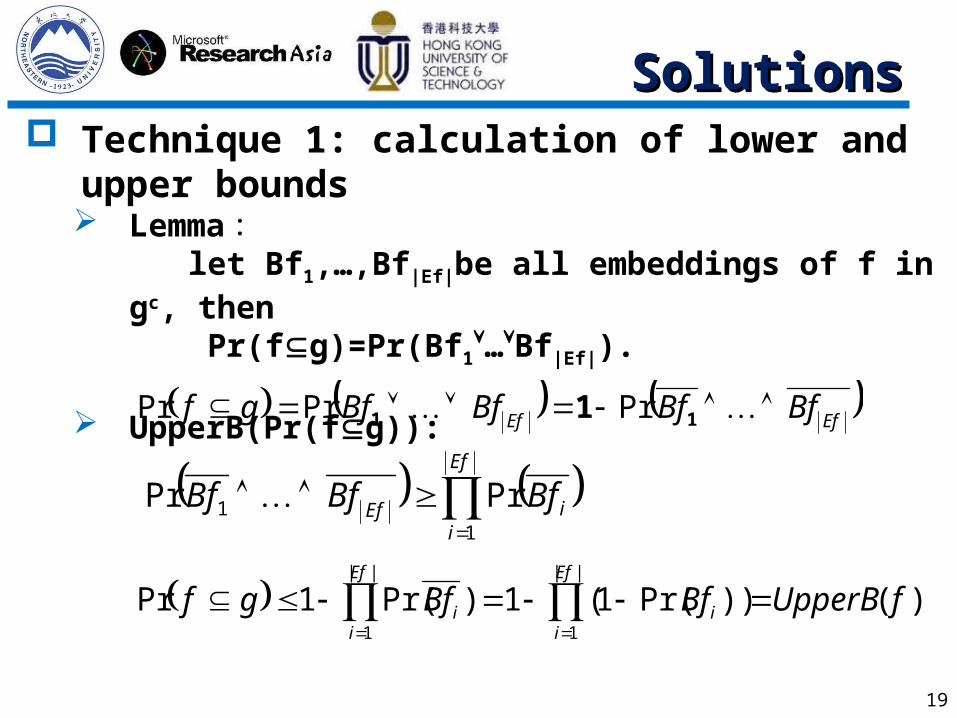
Technique 1: calculation of lower and upper bounds Lemma : let Bf1,…,Bf|Ef|be all embeddings of f in gc, then Pr(fg)=Pr(Bf1…Bf|Ef|).
UpperB(Pr(fg)):
EfEf BfBfBfBfgf 11 1 PrPrPr
Ef
iiEf BfBfBf
11 PrPr
)())Pr(1(1)Pr(1Pr||
1
||
1
fUpperBBfBfgfEf
ii
Ef
ii
SolutionsSolutions
20
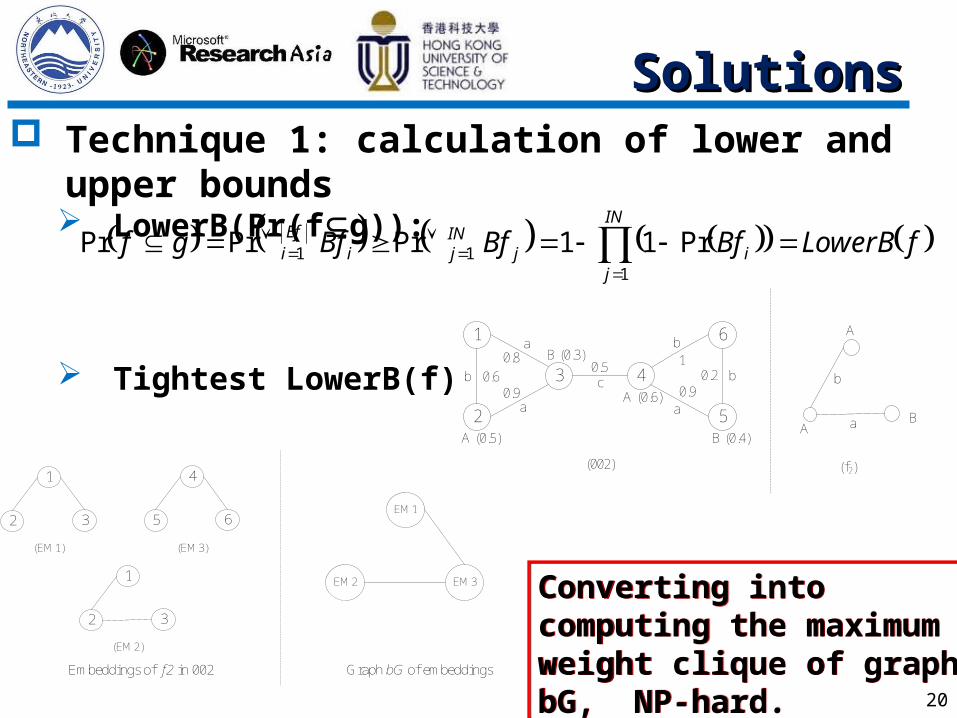
Technique 1: calculation of lower and upper bounds LowerB(Pr(fg)):
Tightest LowerB(f)
IN
jij
INji
Efi fLowerBBfBfBfgf
111 Pr11PrPrPr
1
2
3 4
6
5A (0.5)
B (0.3)
A (0.6)
B (0.4)
b b
b
a
a
a
c0.6
0.8
0.9
0.5 1
0.90.2
(002) (f2)
A
a
b
A B
1
2 3
4
5 6
(EM1) (EM3)
1
2 3
(EM2)
EM1
EM2 EM3
Embeddings of f2 in 002 Graph bG of embeddings
Converting into computing the maximum weight clique of graph bG, NP-hard.
Converting into computing the maximum weight clique of graph bG, NP-hard.
SolutionsSolutions
21
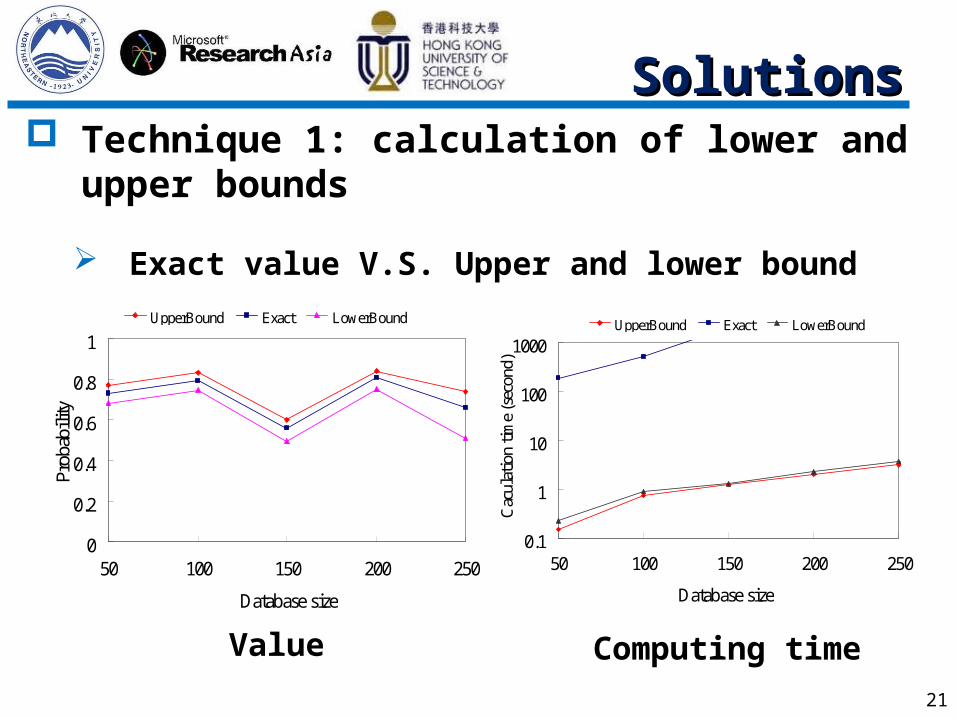
Technique 1: calculation of lower and upper bounds
Exact value V.S. Upper and lower bound
0
0.2
0.4
0.6
0.8
1
50 100 150 200 250
Database size
Prob
abili
ty
UpperBound Exact LowerBound
0.1
1
10
100
1000
50 100 150 200 250
Database size
Cac
ulat
ion
tim
e (s
econ
d)
UpperBound Exact LowerBound
Value Computing time
SolutionsSolutions
22
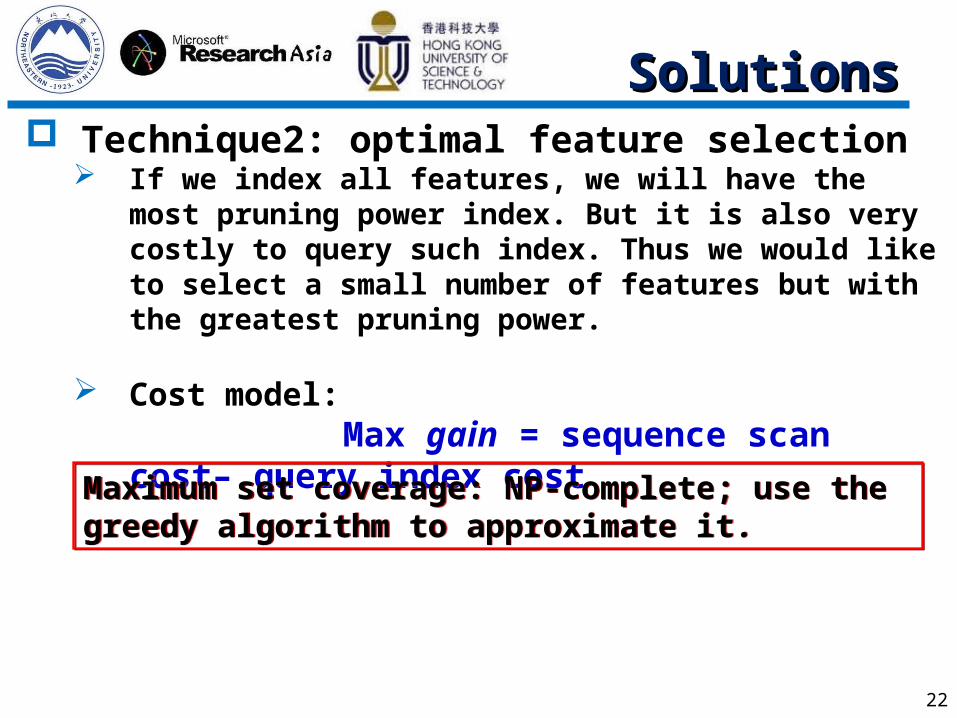
Technique2: optimal feature selection If we index all features, we will have the most pruning power
index. But it is also very costly to query such index. Thus we would like to select a small number of features but with the greatest pruning power.
Cost model: Max gain = sequence scan cost– query index cost
Maximum set coverage: NP-complete; use the greedy algorithm to approximate it.Maximum set coverage: NP-complete; use the greedy algorithm to approximate it.
SolutionsSolutions
23
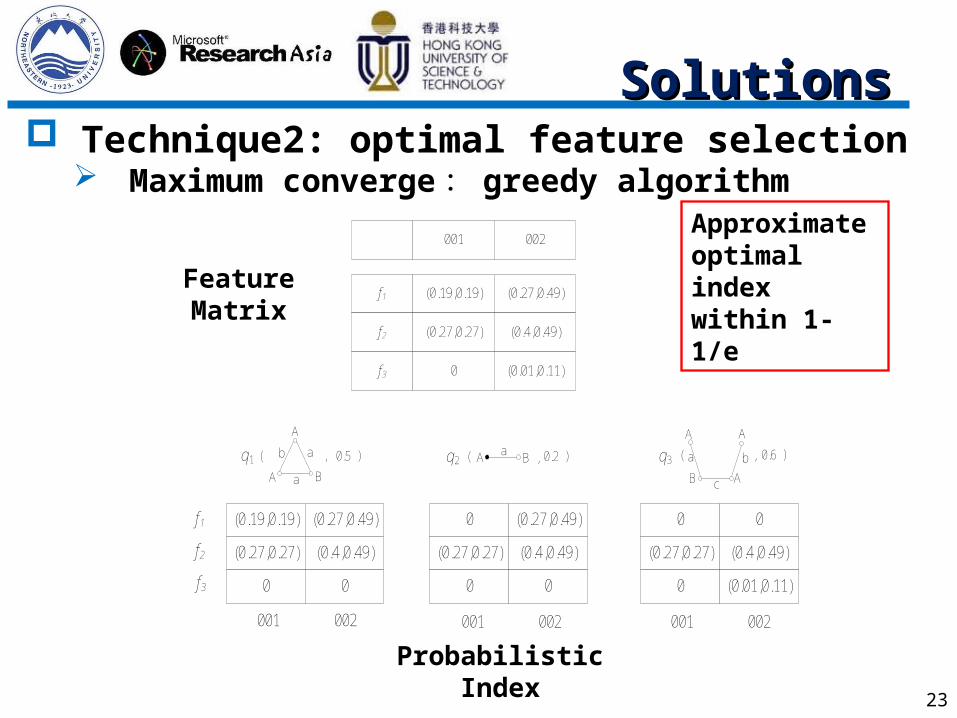
Technique2: optimal feature selection Maximum converge : greedy algorithm
001 002
f1 (0.19,0.19) (0.27,0.49)
f2 (0.27,0.27) (0.4,0.49)
f3 0 (0.01,0.11)
(0.19,0.19) (0.27,0.49)
(0.27,0.27) (0.4,0.49)
0 0
0 (0.27,0.49)
(0.27,0.27) (0.4,0.49)
0 0
0 0
(0.27,0.27) (0.4,0.49)
0 (0.01,0.11)
f1
f2
f3
001 002 001 002 001 002
a
a
b
A
BA
, 0.5q1 )( a BA , 0.2q2 )( a
c
b
A
B A
, 0.6q3 )(
A
Feature Matrix
Probabilistic Index
Approximate optimal index within 1-1/e
SolutionsSolutions
24
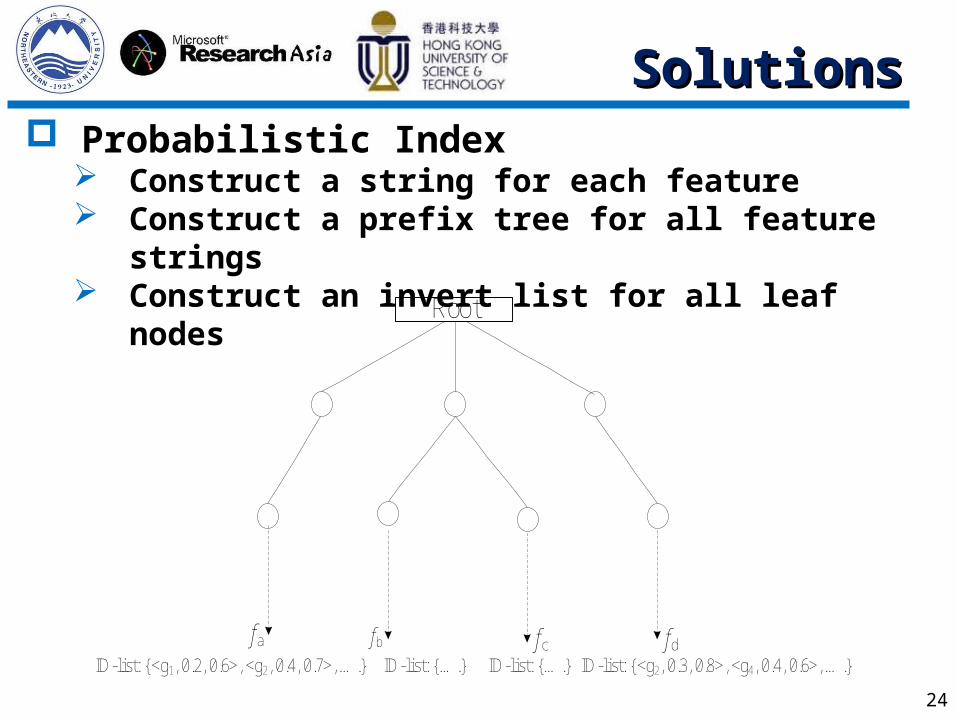
Probabilistic Index Construct a string for each feature Construct a prefix tree for all feature strings Construct an invert list for all leaf nodes
Root
faID-list: {<g1, 0.2, 0.6>, <g2, 0.4, 0.7>, ….}
fbID-list: {….}
fcID-list: {….}
fdID-list: {<g2, 0.3, 0.8>, <g4, 0.4, 0.6>, ….}
SolutionsSolutions
25
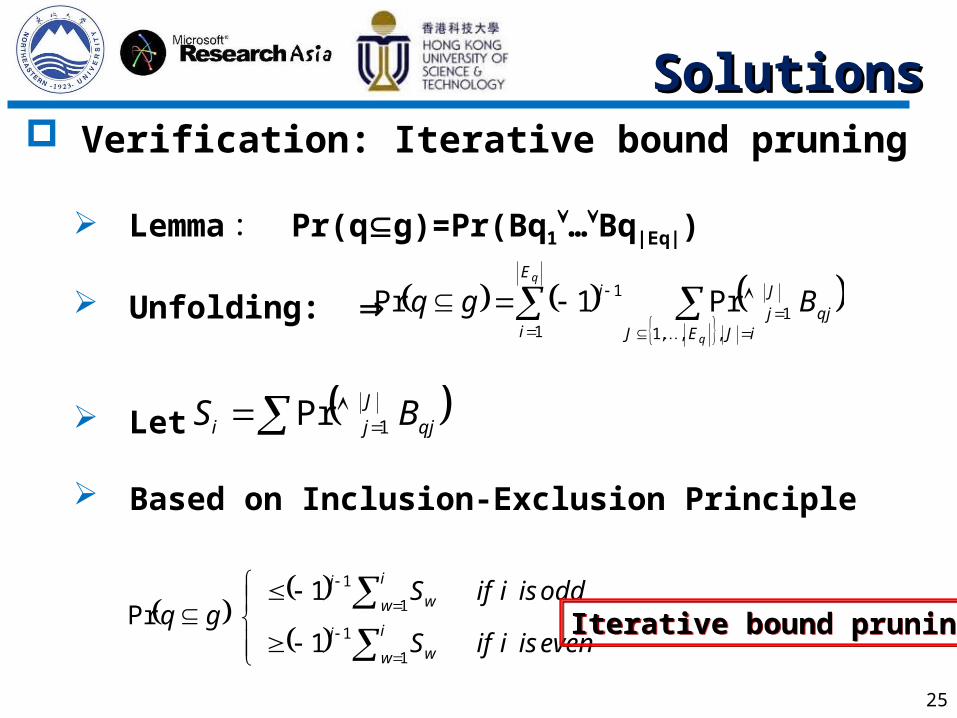
Verification: Iterative bound pruning
Lemma : Pr(qg)=Pr(Bq1…Bq|Eq|) Unfolding:
Let
Based on Inclusion-Exclusion Principle
iJEJ
qj
J
j
E
i
i
q
q
Bgq,,,1
11
1 Pr1Pr
qj
J
ji BS 1Pr
evenisiifS
oddisiifSgq
i
w wi
i
w wi
1
1 Pr
1
1
1
1
Iterative bound pruningIterative bound pruning
SolutionsSolutions
26
Performance Evaluation Real dataset: uncertain PPI
1500 uncertain graphsAverage 332 vertices and 584 edgesAverage probability: 0.367
Synthetic dataset : AIDS datasetGenerate probabilities using Gaussian
distribution10k uncertain graphsAverage 24.3 vertices and 26.5 edges
SolutionsSolutions
27
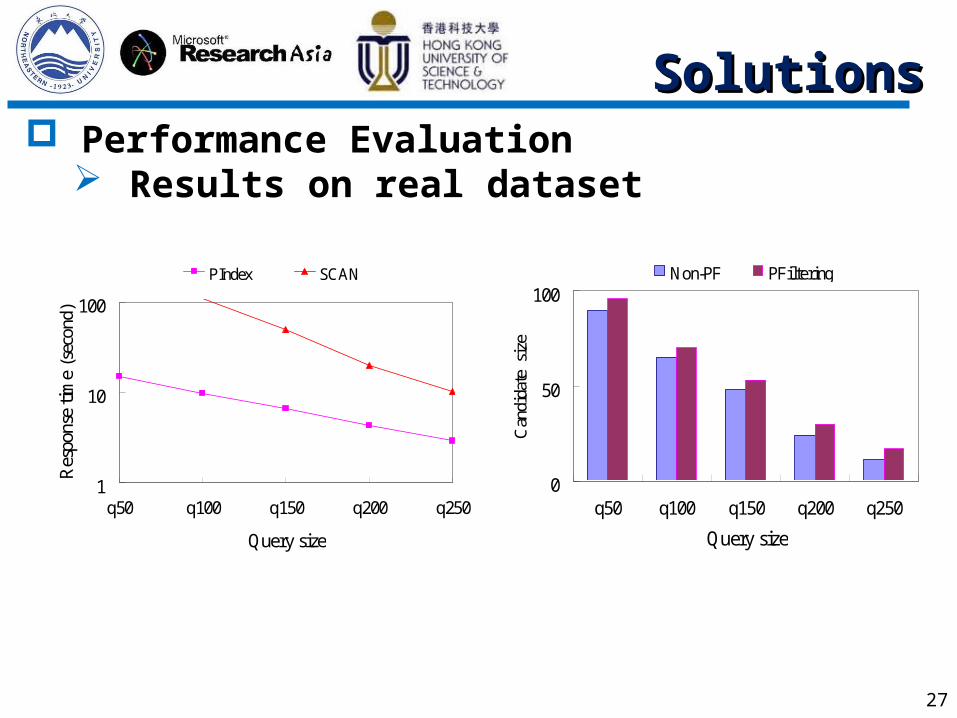
Performance Evaluation Results on real dataset
1
10
100
q50 q100 q150 q200 q250
Query size
Res
pons
e ti
me
(sec
ond)
PIndex SCAN
0
50
100
q50 q100 q150 q200 q250
Query sizeC
andi
date
siz
e
Non-PF PFiltering
SolutionsSolutions
28
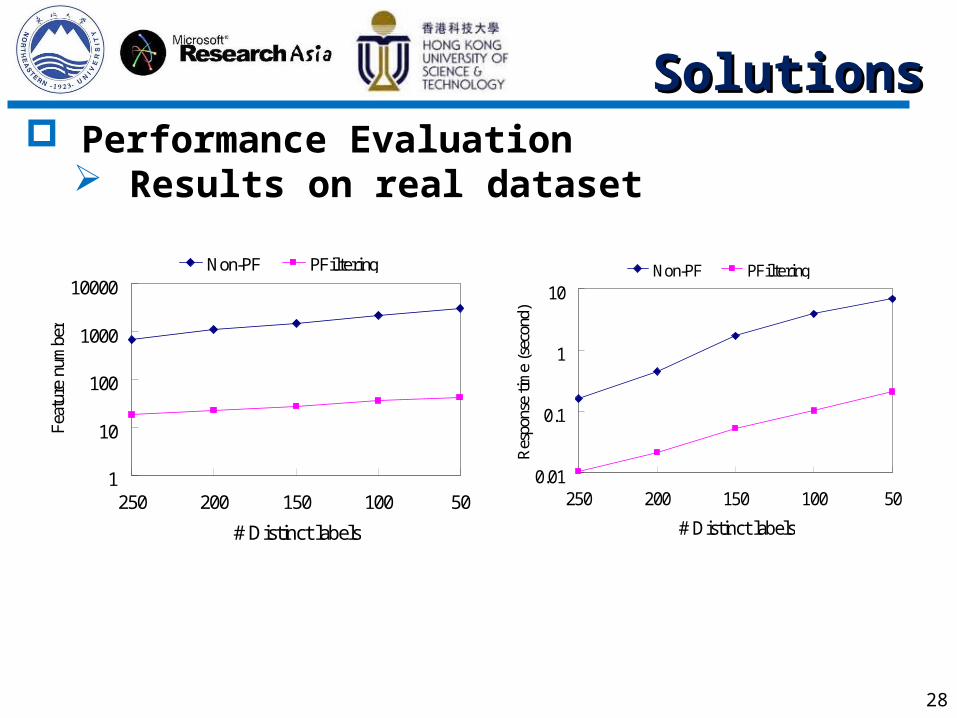
Performance Evaluation Results on real dataset
1
10
100
1000
10000
250 200 150 100 50
# Distinct labels
Feat
ure
num
ber
Non-PF PFiltering
0.01
0.1
1
10
250 200 150 100 50
# Distinct labelsR
espo
nse
time
(sec
ond)
Non-PF PFiltering
SolutionsSolutions
29
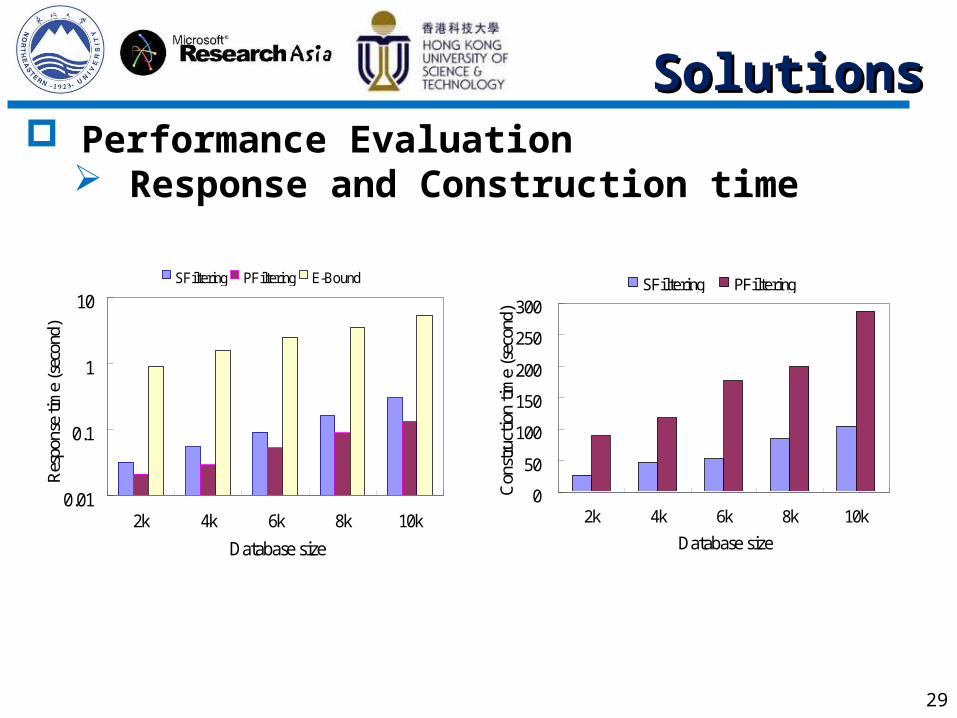
Performance Evaluation Response and Construction time
0.01
0.1
1
10
2k 4k 6k 8k 10k
Database size
Res
pons
e tim
e (s
econ
d)
SFiltering PFiltering E-Bound
0
50
100
150
200
250
300
2k 4k 6k 8k 10k
Database size
Con
stru
ctio
n ti
me
(sec
ond)
SFiltering PFiltering
SolutionsSolutions
30
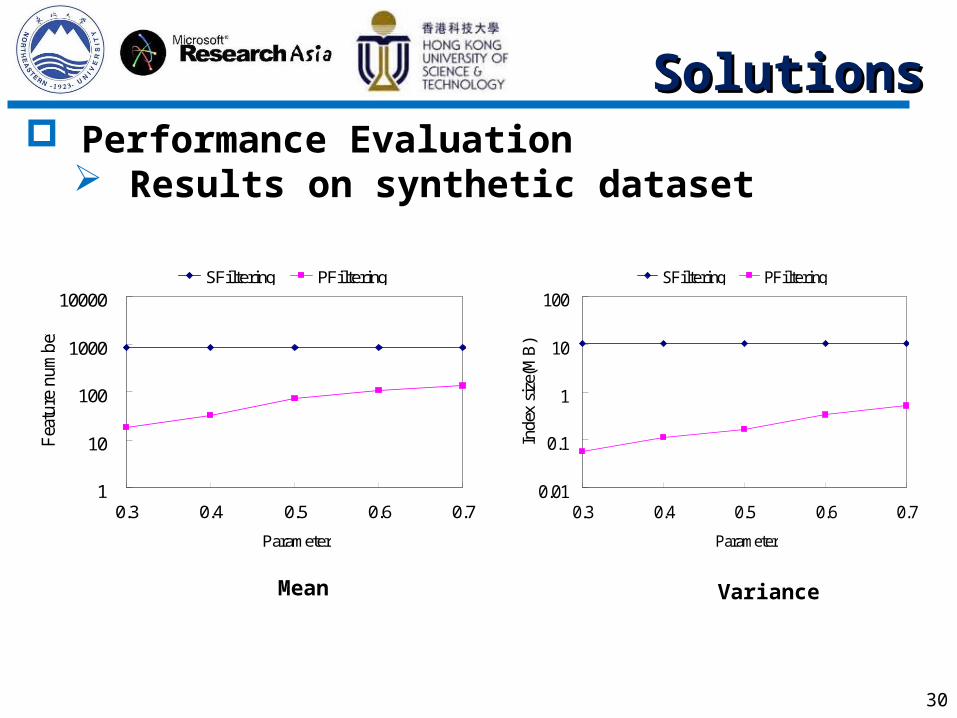
Performance Evaluation Results on synthetic dataset
1
10
100
1000
10000
0.3 0.4 0.5 0.6 0.7
Parameter
Fea
ture
nu
mb
er
SFiltering PFiltering
0.01
0.1
1
10
100
0.3 0.4 0.5 0.6 0.7
ParameterIn
dex
size
(MB
)
SFiltering PFiltering
Mean Variance

ConclusionsV
OutlineOutline
Problem Definition
Query Processing Framework
Solutions
BackgroundⅠ
Ⅱ
Ⅲ
Ⅳ
ConclusionConclusion
32
We propose the first efficient solution to answer threshold-based probabilistic sub-graph search over uncertain graph databases.
We employ a filter and verification framework, and develop probability bounds for filtering.
We design a cost model to select minimum number of features with the largest pruning ability.
We demonstrate the effectiveness of our solution through experiments on real and synthetic data sets.

33
Thanks!