Embed Size (px)
Citation preview

June 2017 \ Banco Central do Brasil \ Inflation Report \ 9
1 Economic scenario
The recent trajectory of the main economic indicators corroborates the scenario of stabilization and perspective of a gradual resumption of economic activity. GDP growth in the first quarter of the year, after eight-period contraction, endorses this perspective. It should be noted, however, that the long-term maintenance of high levels of uncertainty on the evolution of the process of reforms and adjustments in the economy may have a negative impact on economic activity.
The labor market has recorded a relatively more favorable performance in recent months. The drop in inflation favors the improvement of real income and contributes to the gradual recovery of consumption. However, the economy continues to operate with high level of slack in production factors, reflected in the low level of industrial capacity utilization and especially in the unemployment rate.
The external scenario has been favorable, emphasizing that the better performance of the global economic activity has mitigated the effects of possible changes in economic policy in the central countries.
Inflation continues to be favorable, with widespread disinflation in its various components. It should be noted that the disinflation of food prices and industrial prices may have secondary effects on price behavior, favoring additional retreat of inflation expectations and inflation in other sectors of the economy.
1.1 External scenario
The acceleration of global economic activity in 2017 consolidated in the quarter ended in May, with economic indicators suggesting greater
10 \ Inflation Report \ Banco Central do Brasil \ June 2017
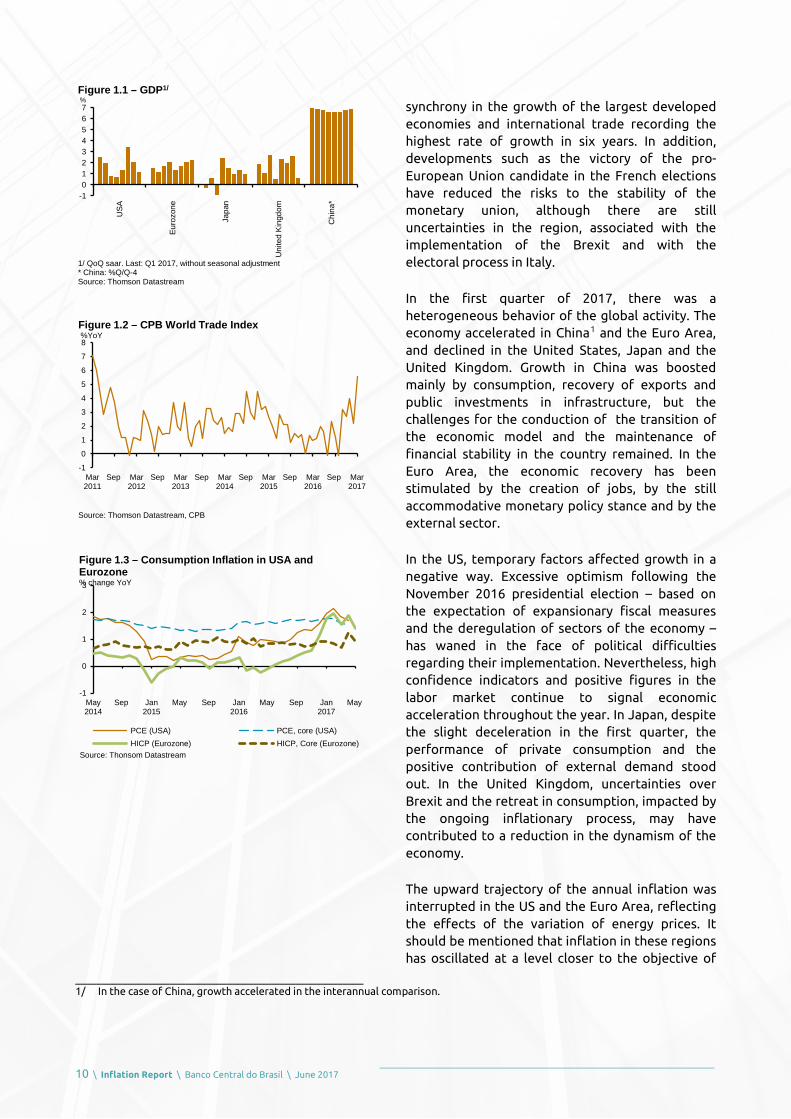
synchrony in the growth of the largest developed economies and international trade recording the highest rate of growth in six years. In addition, developments such as the victory of the pro-European Union candidate in the French elections have reduced the risks to the stability of the monetary union, although there are still uncertainties in the region, associated with the implementation of the Brexit and with the electoral process in Italy.
In the first quarter of 2017, there was a heterogeneous behavior of the global activity. The economy accelerated in China1 and the Euro Area, and declined in the United States, Japan and the United Kingdom. Growth in China was boosted mainly by consumption, recovery of exports and public investments in infrastructure, but the challenges for the conduction of the transition of the economic model and the maintenance of financial stability in the country remained. In the Euro Area, the economic recovery has been stimulated by the creation of jobs, by the still accommodative monetary policy stance and by the external sector.
In the US, temporary factors affected growth in a negative way. Excessive optimism following the November 2016 presidential election – based on the expectation of expansionary fiscal measures and the deregulation of sectors of the economy – has waned in the face of political difficulties regarding their implementation. Nevertheless, high confidence indicators and positive figures in the labor market continue to signal economic acceleration throughout the year. In Japan, despite the slight deceleration in the first quarter, the performance of private consumption and the positive contribution of external demand stood out. In the United Kingdom, uncertainties over Brexit and the retreat in consumption, impacted by the ongoing inflationary process, may have contributed to a reduction in the dynamism of the economy.
The upward trajectory of the annual inflation was interrupted in the US and the Euro Area, reflecting the effects of the variation of energy prices. It should be mentioned that inflation in these regions has oscillated at a level closer to the objective of
_______________________________________________________ 1/ In the case of China, growth accelerated in the interannual comparison.
-101234567
USA
Euro
zone
Japa
n
Uni
ted
King
dom
Chi
na*
Figure 1.1 – GDP1/%
1/ QoQ saar. Last: Q1 2017, without seasonal adjustment* China: %Q/Q-4 Source: Thomson Datastream
-1
0
1
2
3
4
5
6
7
8
Mar2011
Sep Mar2012
Sep Mar2013
Sep Mar2014
Sep Mar2015
Sep Mar2016
Sep Mar2017
Figure 1.2 – CPB World Trade Index%YoY
Source: Thomson Datastream, CPB
-1
0
1
2
3
May2014
Sep Jan2015
May Sep Jan2016
May Sep Jan2017
May
PCE (USA) PCE, core (USA)HICP (Eurozone) HICP, Core (Eurozone)
Figure 1.3 – Consumption Inflation in USA and Eurozone% change YoY
Source: Thonsom Datastream

June 2017 \ Banco Central do Brasil \ Inflation Report \ 11
the monetary authorities than in recent years. The underlying inflation measures in the US and the Euro Area remained contained. In the United Kingdom, inflation continued to rise, reflecting the devaluation of the pound since the referendum that decided on the Brexit. In Latin America, consumer inflation remained on a declining trend in the main economies, with the exception of Mexico.
The US Federal Open Market Committee (FOMC) decided to hike the Fed Funds target at the June meeting, in a context of labor market around full employment and expected convergence of inflation to the 2.0% target. At the same meeting, the Committee reaffirmed its intention to begin reducing the balance sheet of the Federal Reserve (Fed) in 2017, detailing the process that should begin at a pace of up to US$10 billion per month, which should be increased every three months, until the monthly maximum volume of US$50 billion is reached. The strategy will be in place until the Fed's balance sheet reaches an "adequate" level, which is higher than the one prevailing before the 2008-2009 crisis. The European Central Bank, while maintaining the Asset Purchasing Program (APP) and the basic interest rates unchanged, removed the expansionist bias in monetary policy at the June meeting, judging that risks to growth are already balanced and that there are no more risks of deflation. In the same direction, the Bank of Japan (BoJ) has reduced the rate of purchase of securities2.
The discussion over the Fed's balance sheet adjustment gained momentum at the May FOMC meeting under the assumption that a gradual and predictable reduction would diminish possible negative effects on the markets. To date, this initiative has had limited impact on global financial markets.
The more balanced growth environment and the narrower divergence between the monetary policies of the main economies favored the accommodation of the spreads among the sovereign bonds of these economies and the continuation of the fall of the dollar index3, which returned to the level close to the one recorded
_______________________________________________________ 2/ The reduction (from ¥ 80 trillion to around ¥ 60 trillion annualized during 2017) was not formally announced at the monetary
policy meeting, but in May BoJ president Haruhiko Kuroda confirmed strategy to the Japanese parliament. 3/ The dollar index, released by ICE, is calculated from the bilateral exchange rates of the dollar against six other currencies: euro,
yen, pound sterling, Canadian dollar, Swedish kroon and Swiss franc.
0.6
0.9
1.2
1.5
1.8
2.1
2.4
6.72016
7.18 8.26 10.6 11.16 12.27 2.62017
3.17 4.27 6.7
Germany Japan
Figure 1.4 – Spreads over U.S. Treasury Notes (2 yrs) p.p.
Source: Thomson Datastream
90
93
96
99
102
105
6.72016
7.18 8.26 10.6 11.16 12.27 2.62017
3.17 4.27 6.7
Figure 1.5 – Dollar Index
Source: Thomson Datastream

12 \ Inflation Report \ Banco Central do Brasil \ June 2017
before the American elections. In the same direction, risk appetite has increased and equity markets have appreciated in the major advanced economies4.
Emerging economies also benefited from the improved economic scenario, although some commodity prices declined over the period. Stock markets followed upward movement in the more developed markets, albeit with some important exceptions5. The Emerging Markets Bond Index Plus (EMBI+)6 risk indicator declined slightly. The currencies of the emerging economies presented different behavior against the US dollar.
In summary, since the last Inflation Report, the most favorable perception of global economic activity has strengthened and the dissipation of some risks has favored an increase in risk appetite, benefiting emerging economies. However, there are challenges to the global economic policies, including the normalization of monetary policy in central economies and the transition of the Chinese economy.
1.2 Domestic scenario
Economic activity and labor market
The set of indicators of economic activity released since the last Inflation Report remains compatible with the scenario of stabilization in the Brazilian economy in the short term and its gradual recovery in the coming quarters. In this context, the GDP growth7 at the margin in the first quarter of 2017 reflected the significant performance of the grain harvest, the moderate recovery of industrial activity and stability in the services sector. Indicators for the second quarter of the year are consistent with the scenario of a gradual recovery of activity, in spite of the risks arising from the increase in uncertainties regarding the speed of
_______________________________________________________ 4/ S&P500 (USA), DAX (Germany) and FTSE100 (UK) reached new records. 5/ Among them are the stock exchanges of China, Russia and Brazil. 6/ Emerging Markets Bond Index Plus Composite, prepared by JP Morgan. 7/ See box "Revision of GDP growth projections for 2017."
Figure 1.7 – GDP1/
Quarter over previous quarter% change
Source: IBGE1/ Seasonally ajusted data.
-3
-2
-1
0
1
2
I2013
III I2014
III I2015
III I2016
III I2017
100
220
340
460
580
6.72016
7.18 8.26 10.6 11.16 12.27 2.62017
3.17 4.27 6.7
EMBI+ Russia TurkeyBrazil Mexico Argentina
Figure 1.6 – Emerging Markets Bond Index Plus (Embi+) b.p.
Source:Thomson Reuters
June 2017 \ Banco Central do Brasil \ Inflation Report \ 13
approval of the reforms necessary for the continuity of the adjustments in the economy.
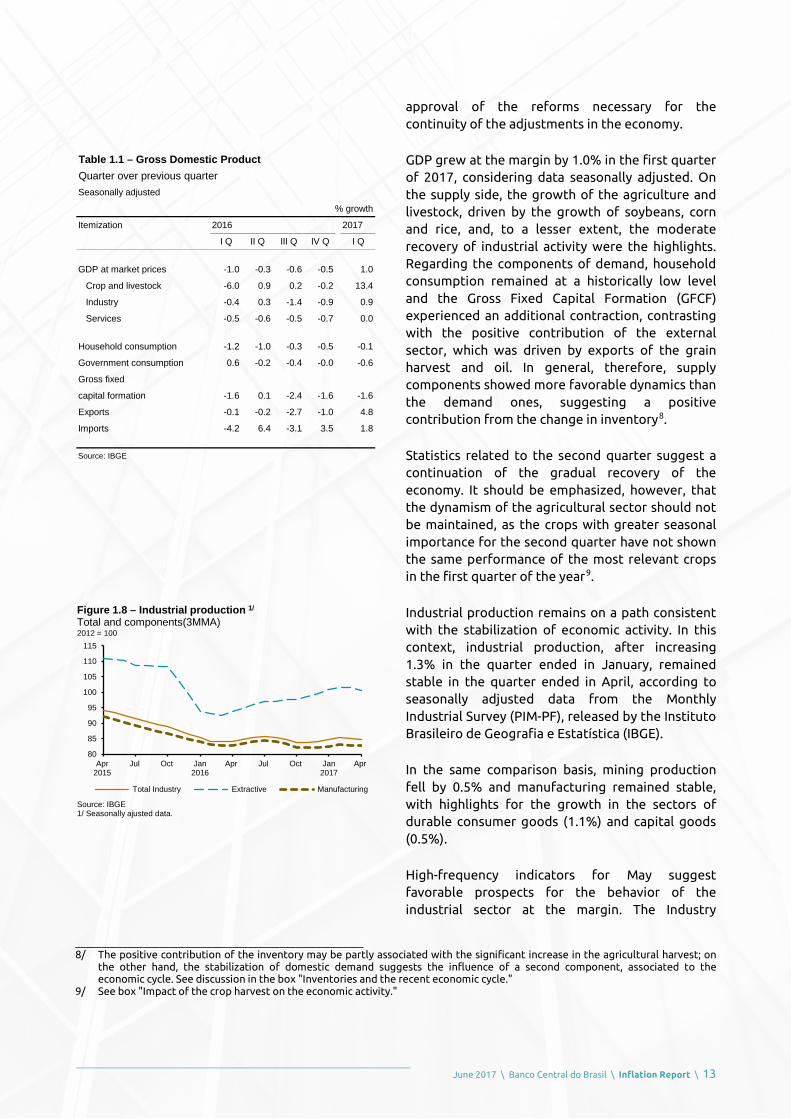
GDP grew at the margin by 1.0% in the first quarter of 2017, considering data seasonally adjusted. On the supply side, the growth of the agriculture and livestock, driven by the growth of soybeans, corn and rice, and, to a lesser extent, the moderate recovery of industrial activity were the highlights. Regarding the components of demand, household consumption remained at a historically low level and the Gross Fixed Capital Formation (GFCF) experienced an additional contraction, contrasting with the positive contribution of the external sector, which was driven by exports of the grain harvest and oil. In general, therefore, supply components showed more favorable dynamics than the demand ones, suggesting a positive contribution from the change in inventory8.
Statistics related to the second quarter suggest a continuation of the gradual recovery of the economy. It should be emphasized, however, that the dynamism of the agricultural sector should not be maintained, as the crops with greater seasonal importance for the second quarter have not shown the same performance of the most relevant crops in the first quarter of the year9.
Industrial production remains on a path consistent with the stabilization of economic activity. In this context, industrial production, after increasing 1.3% in the quarter ended in January, remained stable in the quarter ended in April, according to seasonally adjusted data from the Monthly Industrial Survey (PIM-PF), released by the Instituto Brasileiro de Geografia e Estatística (IBGE).
In the same comparison basis, mining production fell by 0.5% and manufacturing remained stable, with highlights for the growth in the sectors of durable consumer goods (1.1%) and capital goods (0.5%).
High-frequency indicators for May suggest favorable prospects for the behavior of the industrial sector at the margin. The Industry
_______________________________________________________ 8/ The positive contribution of the inventory may be partly associated with the significant increase in the agricultural harvest; on
the other hand, the stabilization of domestic demand suggests the influence of a second component, associated to the economic cycle. See discussion in the box "Inventories and the recent economic cycle."
9/ See box "Impact of the crop harvest on the economic activity."
Table 1.1 – Gross Domestic ProductQuarter over previous quarterSeasonally adjusted
% growth
Itemization 2016 2017
I Q II Q III Q IV Q I Q
GDP at market prices -1.0 -0.3 -0.6 -0.5 1.0
Crop and livestock -6.0 0.9 0.2 -0.2 13.4
Industry -0.4 0.3 -1.4 -0.9 0.9
Services -0.5 -0.6 -0.5 -0.7 0.0
Household consumption -1.2 -1.0 -0.3 -0.5 -0.1
Government consumption 0.6 -0.2 -0.4 -0.0 -0.6
Gross fixed
capital formation -1.6 0.1 -2.4 -1.6 -1.6
Exports -0.1 -0.2 -2.7 -1.0 4.8
Imports -4.2 6.4 -3.1 3.5 1.8
Source: IBGE
Figure 1.8 – Industrial production 1/
Total and components(3MMA)2012 = 100
Source: IBGE1/ Seasonally ajusted data.
80
85
90
95
100
105
110
115
Apr2015
Jul Oct Jan2016
Apr Jul Oct Jan2017
Apr
Total Industry Extractive Manufacturing

14 \ Inflation Report \ Banco Central do Brasil \ June 2017
Confidence Index10 (ICI) recorded an average of 91.4 points in the quarter ended in May, compared to 87.2 points in February, according to seasonally adjusted data from the FGV’s Industry Survey. In the same period, the index of manufacture inventories fell by 3.3 points, showing that the sector, in general, continued in a process of adjustment of inventories.
It should be noted that the results of the confidence surveys presented in this report have not yet fully incorporated the increase in the uncertainty observed in May, as the data collection periods are distributed throughout the month. In this sense, it is important to observe the evolution of the FGV's Economic Uncertainty Indicator (IIE-Br), with a longer collection period, which increased by 9.3 points in May to 128.1 points.
The service sector maintains a trend consistent with stabilization in the medium term, albeit with significant fluctuations at the margin11. After recording a 5.0% drop in 2016, the volume of services fell by 0.9% in the quarter ended in April 2017, compared to January, according to seasonally adjusted data from the Monthly Service Survey (PMS). The segments of professional, administrative and complementary services (-5.6%) and information and communication services (1.5%) were the highlights.
As emphasized in other inflation reports, the consistent recovery in services production depends to some extent on the resumption of industrial activity, which has significant influence on the trade, transportation, and professional and administrative services sectors, as well as on improving market conditions, which favors the consumption of services in general.
On the demand side, recent GDP data show a scenario of stabilization of household consumption, after sharp declines in the last two years. At the margin, retail indicators, in general, show a recovery path in activity in the second quarter, in line with the prospect of an improvement in the financial condition of households, driven by the recent evolution of real
_______________________________________________________ 10/ Readings above 100 points indicate an optimistic sentiment. 11/ It should be noted that the PMS has undergone a recent methodological review. Among other changes, the revision implied a change of the base year, the weight of the segments and the sample of the research.
Figure 1.9 – Confidence and inventories 1/
Manufacturing industry (3MMA)Points
Source: FGV1/ Seasonally ajusted data.
Inventories index calculated as 200 – released inventories index.
100
105
110
115
120
125
130
135
70
75
80
85
90
95
Jan2015
Apr Jul Oct Jan2016
Apr Jul Oct Jan2017
Apr
Confidence Inventories (left)
Figure 1.10 – Economy Uncertainty Index3MMA
Source: FGV
90
100
110
120
130
140
150
May2011
May2012
May2013
May2014
May2015
May2016
May2017
Table 1.2 – Volume of services Quarter over previous quarter (% change)1/
Itemization 2016 2017
Oct Jan Apr
Total -1.9 -1.1 -0.9
Services rendered to families 0.5 1.3 -1.2
Information and communication services -1.0 -2.1 1.5
Professional, administrative and -0.3 -3.3 -5.6
complementary services
Transportation, support activities for -1.7 1.9 0.2
transportation and mailing activities
Other services -2.6 -1.0 -7.3
Source: IBGE
1/ Seasonally adjusted data.
June 2017 \ Banco Central do Brasil \ Inflation Report \ 15
income, the release of withdrawals from the Lenth-of-Service Guarantee Fund (Fundo de Garantia do Tempo de Serviço - FGTS) and the gradual reduction inf the level of indebtedness.
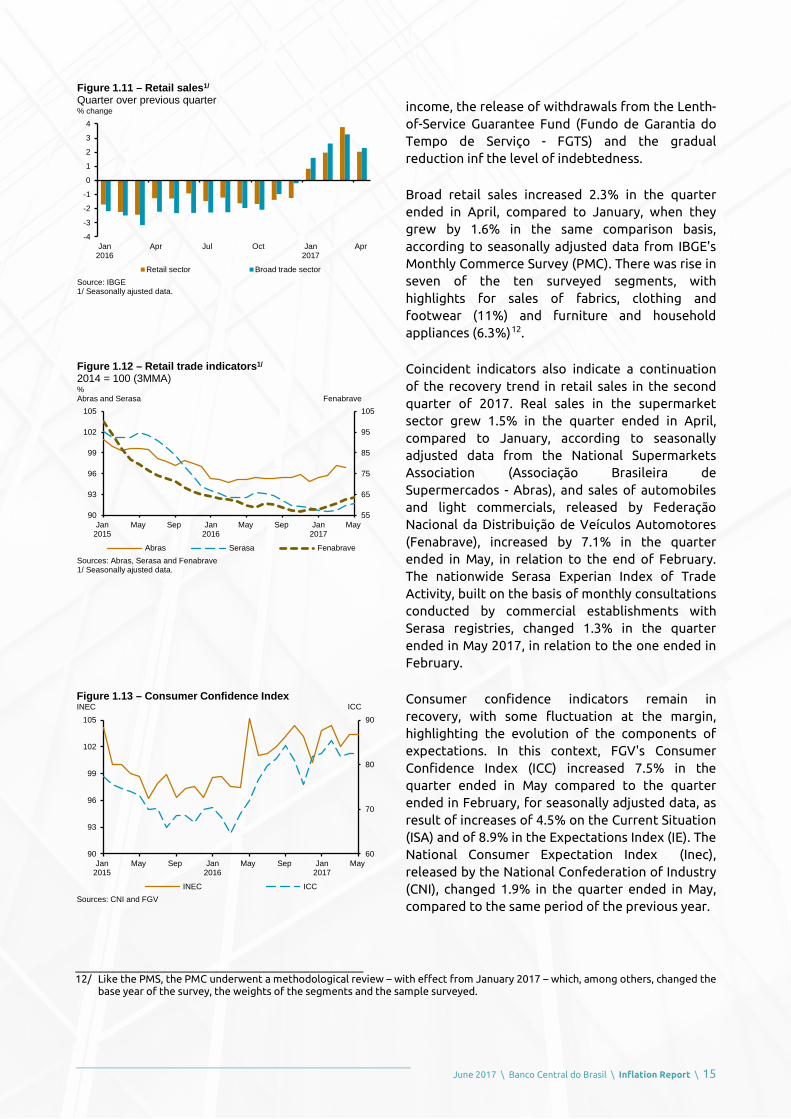
Broad retail sales increased 2.3% in the quarter ended in April, compared to January, when they grew by 1.6% in the same comparison basis, according to seasonally adjusted data from IBGE's Monthly Commerce Survey (PMC). There was rise in seven of the ten surveyed segments, with highlights for sales of fabrics, clothing and footwear (11%) and furniture and household appliances (6.3%)12.
Coincident indicators also indicate a continuation of the recovery trend in retail sales in the second quarter of 2017. Real sales in the supermarket sector grew 1.5% in the quarter ended in April, compared to January, according to seasonally adjusted data from the National Supermarkets Association (Associação Brasileira de Supermercados - Abras), and sales of automobiles and light commercials, released by Federação Nacional da Distribuição de Veículos Automotores (Fenabrave), increased by 7.1% in the quarter ended in May, in relation to the end of February. The nationwide Serasa Experian Index of Trade Activity, built on the basis of monthly consultations conducted by commercial establishments with Serasa registries, changed 1.3% in the quarter ended in May 2017, in relation to the one ended in February.
Consumer confidence indicators remain in recovery, with some fluctuation at the margin, highlighting the evolution of the components of expectations. In this context, FGV's Consumer Confidence Index (ICC) increased 7.5% in the quarter ended in May compared to the quarter ended in February, for seasonally adjusted data, as result of increases of 4.5% on the Current Situation (ISA) and of 8.9% in the Expectations Index (IE). The National Consumer Expectation Index (Inec), released by the National Confederation of Industry (CNI), changed 1.9% in the quarter ended in May, compared to the same period of the previous year.
_______________________________________________________ 12/ Like the PMS, the PMC underwent a methodological review – with effect from January 2017 – which, among others, changed the
base year of the survey, the weights of the segments and the sample surveyed.
Figure 1.11 – Retail sales1/
Quarter over previous quarter% change
Source: IBGE1/ Seasonally ajusted data.
-4
-3
-2
-1
0
1
2
3
4
Jan2016
Apr Jul Oct Jan2017
Apr
Retail sector Broad trade sector
Figure 1.13 – Consumer Confidence IndexINEC ICC
Sources: CNI and FGV
60
70
80
90
90
93
96
99
102
105
Jan2015
May Sep Jan2016
May Sep Jan2017
May
INEC ICC
Figure 1.12 – Retail trade indicators1/
2014 = 100 (3MMA)%Abras and Serasa Fenabrave
Sources: Abras, Serasa and Fenabrave1/ Seasonally ajusted data.
55
65
75
85
95
105
90
93
96
99
102
105
Jan2015
May Sep Jan2016
May Sep Jan2017
May
Abras Serasa Fenabrave

16 \ Inflation Report \ Banco Central do Brasil \ June 2017
It should be noted that, despite the improvement, the indicators of consumer confidence remain at historically low levels, compatible with the scenario of slow recovery of consumption. On the other hand, the disinflationary and deleveraging processes of the families, both in progress, favor the recovery of real income and the resumption of credit in a moderate pace, contribute to the gradual recovery of consumption in the medium term.
GFCF fell by 1.6% in the first quarter of 2017, compared to the last quarter of 2016, considering data seasonally adjusted, accumulating a 29.8% decrease since the third quarter of 2013.
The downward trajectory of the GFCF reflects the retraction in the absorption of capital goods, in a scenario of import drops, together with contraction in the production of typical civil construction inputs. On the other hand, it should be mentioned the expansion in the production of capital goods, at the margin.
As mentioned in other reports, the effective recovery of investment is conditioned, in part, by the reduction in leverage and by the financial burden on the income of non-financial corporations. In addition, it should be noted that the increase in the degree of uncertainty in the economy, evidenced by the behavior of financial indicators, would delay the resumption of investments.
The economy continues to operate with a high level of slack production factors, reflected in the low indices of capacity utilization in the industry and in the unemployment rate. In this sense, the average level of the Capacity Utilization Index (NUCI) in the manufacturing industry averaged 74.6% in the quarter ended May – 78.6% for the average of the last five years –, presenting modest growth in relation to the previous quarter, 0.7 p.p., seasonally adjusted data. This increase reflected Nuci growth in non-durable consumer goods (2.1 p.p.) and capital goods (1.9 p.p.) and declines in the indices of intermediate goods (0.7 p.p.) and durable consumption goods (0.2 p.p.).
The labor market easing process continues to impact the evolution of the unemployment rate, which, according to the IBGE's Continuous National
Figure 1.15 – EMBI+ Brazil and IbovespaPointsEMBI+ Ibovespa
Sources: Thompson Reuters and BM&F
61,000
62,000
63,000
64,000
65,000
66,000
67,000
68,000
69,000
240
250
260
270
280
290
300
310
3Apr
2017
10Apr
18Apr
26Apr
4May
11May
18May
25May
1Jun
EMBI+ Ibovespa
Figure 1.14 – Gross Fixed Capital Formation components1/
2014 = 100 (3MMA)
Sources: IBGE-PIM and Funcex1/ Seasonally ajusted data.
50
60
70
80
90
100
Jan2015
Apr Jul Oct Jan2016
Apr Jul Oct Jan2017
Apr
Production of capital goods Imports of capital goods
Construction inputs
Figure 1.16 – Unemployment rate%
Source: IBGE (Continuous National Household Survey)
6
7
8
9
10
11
12
13
14
Jan2015
Apr Jul Oct Jan2016
Apr Jul Oct Jan2017
Apr
Figure 1.17 – Employed population and labour forceQuarter over same quarter of previous year (% change)
Source: IBGE (Continuous National Household Survey)
-2.0
-1.5
-1.0
-0.5
0.0
0.5
1.0
1.5
Jan2015
Apr Jul Oct Jan2016
Apr Jul Oct Jan2017
Apr
Occupation Labour force

June 2017 \ Banco Central do Brasil \ Inflation Report \ 17
Household Sample Survey (PNAD Contínua), reached 13.6% in the quarter ended in April 2017, compared to 11.2% in April 2016. The year-on-year evolution reflected a 1.5% drop in employment and a 1.2% increase in the labor force.
At the margin, however, there are signs of improvement in the labor market, especially in the formal segment. According to the Employed and Unemployed Individuals General Registry (Caged), from the Labor and Social Security Ministry (MTPS), 59.9 thousand jobs were created in April (a cut of 62.8 thousand in the same month of 2016), resulting in the creation of 31.8 thousand jobs in the quarter (-286.2 thousand in the same period of 2016). Generations of jobs in the service sector (58.2 thousand), agriculture and livestock (17.4 thousand) and manufacturing (14.1 thousand) were particularly noteworthy. The improvement in the net balance of formal jobs is more related to the reduction movement in the pace of dismissals than to the increase of admissions.
The ongoing disinflation process has allowed favorable evolution of real earnings, even in an environment of increasing unemployment rate. The real average earnings increased by 2.7% in the quarter ended in April, in relation to the same period of 2016, according to the continuous PNAD survey, confirming the perspective that the adjustment in the market has been occurring mainly through the number of jobs. At the margin, real income increased by 0.7% in the quarter ended in April, compared to January, contributing to increase of 0.3% in real total wages in the period.
The labor market reacts with lags to economic activity. Improvements in employment indicators should occur more consistently after the consolidation of economic activity recovery.
Credit
Credit operations, in a deceleration trajectory, decreased 0.1% in the quarter ended in April, influenced by the contraction of 0.9% in the corporate portfolio. On the other hand, the portfolio of individuals increased by 0.7% in the period, with highlights for the performance of the modalities payroll-deducted loans, rural and real estate credit operations. In this context, the credit
Figure 1.20 – Interest rates – Credit to householdsNonearmarked resourses (%) Earmarked resources (%)
8
9
10
11
12
13
14
15
50
55
60
65
70
75
80
Apr2016
Jun Aug Oct Dec Feb2017
Apr
Nonearmarked resources Earmarked resources
Figure 1.18 – Admissions and Dismissals1/
Thousands of jobs
Source: Caged (Ministry of Labour)1/ Seasonally ajusted data.
1,000
1,200
1,400
1,600
1,800
2,000
Jan2015
Apr Jul Oct Jan2016
Apr Jul Oct Jan2017
Apr
Admissions Dismissals
Figure 1.19 – Real and nominal earningsQuarter/Same quarter of previous year% change
Source: IBGE (Continuous National Household Survey)
-6-4-202468
1012
Jan2015
Apr Jul Oct Jan2016
Apr Jul Oct Jan2017
Apr
Real average earnings Nominal average earnings
Table 1.3 – Formal employment New jobs (thousands)
Itemization 2016 2017
Quarter2/ Year3/ Quarter2/ Year3/
Total -286.2 -385.9 31.8 -9.0
Manufacturing industry -67.0 -83.6 14.1 31.6
Commerce -128.0 -197.8 -49.8 -109.9
Services -37.8 -54.9 58.2 48.7
Building -57.4 -60.0 -23.7 -24.5
Crop and livestock -7.7 1.0 17.4 28.0
Public utilities -1.8 -2.7 1.1 1.8
Others1/ 13.5 12.1 14.5 15.1
Source: Ministry of Labour
1/ Includes mining, public administration and others.2/ Quarter ended in April 2017.3/ Accumulated in the year until April 2017.

18 \ Inflation Report \ Banco Central do Brasil \ June 2017
to GDP ratio reached 48.4% in April, compared to 51.8% in the same month of 2016.
Interest rates fell by 2.7 p.p. in the quarter, mainly driven by the reduction in non-earmarked bank loans, reflecting the monetary policy cycle and the changes in the revolving credit card loans, according to Resolution 4,54913. The interest rate changed -3.5 p.p. in the segment of individuals and 1.9 p.p. in the corporate portfolio.
The delinquency rate of the financial system remains relatively well behaved, given the scenario of unemployment expansion and low level of economic activity. Considering credit in arrears for more than ninety days, it increased by 0.2 p.p. in the quarter to 3.9%. The indicator remained stable at 4.0% in the individuals segment and increased 0.3 p.p. to 3.8% in the corporate segment, with highlight for the arrears related to working capital operations.
Fiscal
The consolidated public sector recorded a primary surplus of R$15.1 billion in the first four months of 2017, compared to a surplus of R$4.4 billion in the same period of 2016. On a twelve-month basis, there was a primary deficit of R$145.1 billion (2.29% of GDP). The Annual Budgetary Law (LOA) established a primary deficit of R$143.1 billion as the target for the fiscal result of 2017, indicating a gradual recovery in the balance of the public accounts in subsequent years.
External demand and Balance of Payments
The country's external transactions have contributed to the stabilization of economic activity, as evidenced by GDP in the first quarter of the year. Recent balance of payments data corroborate this view. The current account showed a surplus in March and April, implying a significant reduction in the deficit accumulated in the first four months of this year, compared to the same period of 2016, a 51.3% drop. This movement
_______________________________________________________ 13/ Resolution No. 4,549, from 2017, established that as of April 3, 2017, financial institutions may only finance in revolving credit
card lines until the subsequent invoice matures.
Figure 1.21 – Interest rates – Credit to non-financial corporationsNonearmarked resourses (%) Earmarked resources (%)
10.5
11.0
11.5
12.0
12.5
13.0
25
26
27
28
29
30
31
32
Apr2016
Jun Aug Oct Dec Feb2017
Apr
Nonearmarked resources Earmarked resources
Figure 1.22 – Deliquency rates1/
%
1/ Credit operations overdue for more than 90 days.
1.5
2.5
3.5
4.5
Apr2016
Jun Aug Oct Dec Feb2017
Apr
Total Corporations Individuals
Table 1.4 – Public sector borrowing requirements –Primary result Twelve-month accumulated
Segment 2015 2016 Apr 2017
R$ % R$ % R$ %
billion GDP billion GDP billion GDP
Central Government 116.7 1.9 159.5 2.5 156.4 2.5
Sub-national governments -9.7 -0.2 -4.7 -0.1 -11.1 -0.2
State companies 4.3 0.1 1.0 0.0 -0.2 -0.0
Total 111.2 1.9 155.8 2.5 145.1 2.3

June 2017 \ Banco Central do Brasil \ Inflation Report \ 19
reflected, above all, the significant increase in the trade surplus, driven mainly by the favorable evolution of commodity export prices and the start of the shipment of the record soybean crop. The above than expected results for the trade balance have outpaced the moderate growth of the service account deficit, as well as the expansion of net primary income expenses, which has responded to the improvement in the pace of domestic activity expansion. In this way, the forecast of current account deficit for the year was reassessed, to 1.2% of GDP14, according to the box presented in this Report.
In the financial account, net incurrence of liabilities exceeded net acquisition of financial assets by US$1.2 billion in the first four months of 2017, indicating maintenance of net capital inflows, albeit at a lower magnitude than in the same period of last year (US$4.8 billion). This reduction in net funding reflected mainly the significant increase in Brazilian assets abroad, specifically commercial credit, and occurred in spite of the increase in the inflow of foreign capital in the period. Considering the inflow of foreign capital, the increase in net inflows of direct investment in the country was US$29.5 billion (US$23.8 billion in the same period of 2016), accumulating US$84.7 billion in the twelve- month period ended in April, compared to a current account deficit of US$19.8 billion in the same period. Net inflows in portfolio investment liabilities amounted to US$811 million (net outflows of US$5.0 billion in the first four months of 2016), influenced by the account of fixed income securities traded in the domestic market, which has presented relative recovery, after significant net outflows observed in 2016.
In the first four months of the year, there were also improvements in the access conditions of companies domiciled in Brazil to resources offered by the international market, compared to the same period of 2016. The total rollover rate, considering long-term securities operations and direct loans in the international market, reached 86% in the first four months of 2017 (45% in the period from January to April 2016), reflecting, in part, the reduction of funding costs. At the same time, there were higher intercompany loans inflows, to a great extent due to the internalization of revenues from
_______________________________________________________ 14/ See box "Balance of Payments projections for 2017."
Table 1.5 - Balance of PaymentsUS$ billion
Itemization 2016 2017
Apr Jan- Year Apr Jan-
Apr Apr
Current account 0.4 -7.2 -23.5 1.2 -3.5
Trade balance 4.6 12.4 45.0 6.7 20.6
Exports 15.3 55.7 184.5 17.6 68.0
Imports 10.7 43.3 139.4 10.9 47.4
Services -2.5 -8.7 -30.4 -2.5 -9.9
Primary income -1.9 -11.8 -41.1 -3.2 -14.8
Secondary income 0.2 1.0 3.0 0.2 0.7
Financial account -0.0 -4.8 -16.5 1.7 -1.2
Direct investments -5.6 -21.1 -71.1 -5.5 -28.8
Abroad 1.2 2.7 7.8 0.1 0.8
In Brazil 6.8 23.8 78.9 5.6 29.5
Portfolio investments -1.0 5.4 19.2 -3.7 2.3
Derivatives -0.3 -0.3 -1.0 -0.1 -0.1
Other investments 3.5 11.8 27.2 6.6 17.6
Reserve assets 3.4 -0.6 9.2 4.4 7.8
Memo:
Current account / GDP -1.2 -1.3 -0.5

20 \ Inflation Report \ Banco Central do Brasil \ June 2017
the issuance by subsidiaries abroad and remitted to headquarters in Brazil.
The stock of foreign debt has declined since the third quarter of 2016, contributing to increase the degree of coverage of international reserves over external debt maturities on a twelve-month horizon, which reached 383% in April 2017 (302% in September 2016). The level of international reserves in April was equivalent to 20.0% of GDP and to 31 months of imports of goods.
1.3 Inflation and market expectations
Consumer inflation continued at a lower-than-expected level in the quarter through May, in a scenario of favorable trajectory of food, industrial goods and regulated prices. It should be also mentioned the consolidation of disinflation in the components that are most sensitive to the business cycle and to monetary policy.
In this context, IPCA projections according to the Focus survey dropped to 3.9% in 2017 and 4.4% in 2018, remaining at 4.25% for longer horizons. It should be highlighted that the benign consumer inflation trajectory over the last months may continue to contribute for the reduction of the effects of inertial mechanisms on the price formation, attenuating the potential impact of the recent exchange devaluation and the likely occurrence of the climatic phenomenon El Niño as of the second half of 2017.
Price indexes
The Wholesale Price Index (IPA), after increasing 1.32% in the quarter ended in February, fell by -3.79% in the quarter ended in May, mainly reflecting the trajectory of industrial prices (from 3.34% to -2.71%), with highlight for the lower prices of oil derivatives and iron ore. Agriculture and livestock prices continued on a downward trend, especially manioc, sugarcane, orange, corn and hog. The favorable trajectory of producer prices over the last monthss, especially with regard to the most relevant food items, tends to
-6
-4
-2
0
2
4
6
Nov2015
Jan2016
Mar May Jul Sep Nov Jan2017
Mar May
Agricultural IndustrialSource: FGV
Figure 1.23 – IPA-10, IPA-M and IPA-DI Monthly % change

June 2017 \ Banco Central do Brasil \ Inflation Report \ 21
contribute for the maintenance of a favorable behavior in consumer inflation.
The IPCA, released by the IBGE, changed 0.70% in the quarter through May (1.01% in the quarter ended in February), as a result of deceleration of market prices (from 0.90% to 0.47%) and acceleration of regulated prices (from 1.37% to 1.44%). IPCA change in the period remained below the historical median (1.22%) consistent with the mid-point of the inflation target15. Considering 12-month periods, the IPCA change dropped from 4.76%, in February, to 3.60% in May, due to decelerations in both market prices (from 4.78% to 3.36%) and regulated prices (from 4.72% to 4.41%).
The trajectory of market prices in the period reflected decelerations in the prices of services (from 1.86% to 0.88%) and industrial goods (from 0.56% to -0.13%), which were partially offset by the acceleration of prices in the food at home subgroup (from -0.63% to 0.43%).
Price variations of the food at home subgroup continued well below the seasonal pattern, reflecting favorable supply conditions coupled with the effects of the economic cycle on demand. In 12-months, food inflation dropped from 4.33%, in February, to 1.08% in May.
The deceleration of services inflation in the quarter ended in May partly reflected seasonal factors, such as the end of the period of annual readjustment of educational prices. The underlying inflation of the services sector16 slowed down in the quarter, reflecting price declines in the segment of food away from home, car insurance, leisure and personal services. In 12 months, declines were observed in both the sector’s general inflation (from 5.94% in February to 5.62% in May) and in the underlying inflation measure (from 5.44% to 4.62%).
It should be observed that, on a quarterly basis, the services sector’s seasonally adjusted underlying inflation accelerated in comparison to the previous quarter, even though remaining at a low level.
_______________________________________________________ 15/ Seasonal pattern obtained on the basis of monthly medians for the period from 2007 to 2015, adjusted so as to accumulate 4.5%
in the year. 16/ Further details are available in the Box “Services sector inflation”, released at the September 2016 Inflation Report.
0.0
0.2
0.4
0.6
0.8
1.0
1.2
1.4
Jan Feb Mar Apr May Jun Jul Aug Sep Oct Nov DecTarget-adjusted median from 2007 to 201520162017
Figure 1.24 – CPI - Seasonal patternMonthly % change
Sources: IBGE and BCB
-2-1012345678
Nov2014
Feb2015
May Aug Nov Feb2016
May Aug Nov Feb2017
May
Household food Services Industrialized goods
Figure 1.25 – Market prices trajectory% change in 3 months
Sources: IBGE and BCB
2
4
6
8
10
12
14
16
18
Nov2014
Feb2015
May Aug Nov Feb2016
May Aug Nov Feb2017
May
Household food Services Industrialized goods
Figure 1.26 – Market prices trajectory% change in 12 months
Sources: IBGE and BCB
-0.5
0.0
0.5
1.0
1.5
2.0
2.5
3.0
3.5
4.0
Nov2014
Feb2015
May Aug Nov Feb2016
May Aug Nov Feb2017
May
Underlying services Services ex-underlyingServices
Figure 1.27 – Services inflation% change in 3 months
Sources: IBGE and BCB

22 \ Inflation Report \ Banco Central do Brasil \ June 2017
Among industrial goods, it should be highlighted the deceleration ethanol prices, in the midst of the sugarcane harvest, and cigarettes. In 12-months, inflation in this segment remained on a downward trend, dropping from 3.36%, in February, to 1.62% in May.
Notwithstanding the decline of gasoline prices, regulated prices accelerated in the quarter ended in May, reflecting the tariff hike of residential electricity according to the system of tariff flags17. It should be mentioned that, although the review of costs related to the Angra III power plant led to sharp oscillation of monthly rates, the rate accumulated in the quarter through May was not significantly affected. In 12 months, regulated prices inflation continued on a downward trend, highlighting the lower changes of water and sewage tariffs18 and gasoline prices.
Diffusion index and core inflation measures
The diffusion index, which measures the proportion of IPCA components with positive price changes, reached an average of 56.0% in the quarter ended in May (58.0% through February and 66.4% in the same period of the previous year). The trajectories of the 12-month moving average and the seasonally adjusted series highlight the dissemination of the disinflationary process among IPCA components, consistent with the reduction of inflation persistence.
Core inflation measures according to distinct criteria slowed down both in quarterly and 12-month calculations.
The core IPCA excluding ten items of the food at home and fuels subgroups increased by 1.08% in the quarter through May (1.30% in the quarter through February 2017). In the 12-month period through May, the index reached 4.50% (5.31% in the quarter through February).
_______________________________________________________ 17/ The green flag was replaced by the yellow flag in March, which was replaced by the red flag in April. 18/ In May 2016 the incentive program for the reduction in water consumption was cancelled by the São Paulo water and sewage
company (Sabesp)
2
3
4
5
6
7
8
9
10
11
Nov2014
Feb2015
May Aug Nov Feb2016
May Aug Nov Feb2017
May
12 months 3-month-annualized (s.a.)
Figure 1.28 – Underlying services inflation% change
Sources: IBGE and BCB
50
55
60
65
70
75
Nov2014
Feb2015
May Aug Nov Feb2016
May Aug Nov Feb2017
May
12-month moving average 3-month moving average (s.a.)
Figure 1.29 – IPCA diffusion indexPercentage of subitens with monthly price increases (%)
Sources: IBGE e BCB
3
4
5
6
7
8
9
10
11
Nov2014
Feb2015
May Aug Nov Feb2016
May Aug Nov Feb2017
May
IPCA ExclusionSmoothed trimmed means Double weighting
Figure 1.30 – Core inflation12-month % change
Sources: IBGE and BCB

June 2017 \ Banco Central do Brasil \ Inflation Report \ 23
The smoothed trimmed means19 core inflation index increased by 0.85%, compared to 1.01% in the quarter through February, while the non-smoothed index rose by 0.66% and 1.06%, respectively, in the same periods. In the 12-month period through May, these indexes changed by 4.74% and 3.77%, respectively (5.96% and 4.79%, in the order, until February).
The double-weight core inflation20 rose by 0.74% in the quarter up through May, against 1.16% in the quarter through February. The index totaled a change of 4.58% in the 12-month period ended in May, compared to 5.98% in the 12-month period through February.
Market expectations
According to the Focus survey, the median of the projections for the annual IPCA change in 2017 fell from 4.10%, at the end of March, to 3.68%, on June 14. The median projections for 2018 dropped from 4.50% to 4.36%, in the same period, and for 2019 from 4.28% to 4.25%; for 2020, the median remained at 4.25%. The median of the 12-month-ahead smoothed inflation expectations fell from 4.57% to 4.49%, in the same period.
The median of the estimates for the changes in the IGP-M in 2017 and 2018 reached, respectively, 1.14% and 4.50%, on June 14 (4.36% and 4.60%, at the end of March) while both medians related to the change in 2019 and 2020 remained at 4.50%, in the same period.
The median of the estimates for the changes of the IPA-DI in 2017 and in 2018 reached, -0.20% and 5.00% (4.35% and 5.00%, at the end of March). The median of the projections for 2019 and 2020 remained at 4.50%, in the same period.
The median expectations for increases of regulated prices in 2017 and 2018 reached, in the order, 5.50% and 4.74% on June 14 (5.50% and 4.60%, respectively, at the end of March). The median
_______________________________________________________ 19/ The criterion used to calculate this indicator excludes items whose monthly change is situated above the 80th percentile or
below the 20th percentile in the distribution, besides smoothing over twelve months the fluctuation of items whose variations are concentrated in a few periods of the year.
20/ The criterion used to calculate this indicator consists of reweighting the original weights – based on the importance of each item to the IPCA basket – by their respective degrees of relative volatility, a procedure that reduces the importance of more volatile components.
Table 1.6 – Summary of market expectations
2017 2018 2017 2018 2017 2018
In percentage
IPCA 4.87 4.50 4.10 4.50 3.68 4.36IGP-M 5.08 4.84 4.36 4.60 1.14 4.50IPA-DI 5.30 5.00 4.35 5.00 -0.20 5.00Regulated Prices 5.54 4.80 5.50 4.60 5.50 4.74Selic (end-of-period) 10.25 9.75 8.75 8.50 8.50 8.50Selic (average) 11.56 10.00 10.38 8.75 10.28 8.50GDP growth 0.50 2.30 0.47 2.50 0.50 2.40In BRL/US$
Exchange rate (end-of-period) 3.48 3.50 3.25 3.40 3.30 3.40Exchange rate (average) 3.40 3.48 3.18 3.35 3.24 3.38
(continues)
12.30.2016 3.31.2017 6.14.2017
Table 1.6 – Summary of market expectations(concluded)
2019 2020 2019 2020 2019 2020
In percentage
IPCA 4.50 4.50 4.28 4.25 4.25 4.25IGP-M 4.60 4.50 4.50 4.50 4.50 4.50IPA-DI 4.70 4.50 4.50 4.50 4.50 4.50Regulated Prices 4.50 4.50 4.50 4.50 4.50 4.25Selic (end-of-period) 9.50 9.00 8.75 8.50 8.50 8.50Selic (average) 9.50 9.25 8.75 8.65 8.75 8.50GDP growth 2.50 2.50 2.50 2.50 2.50 2.50In BRL/US$
Exchange rate (end-of-period) 3.60 3.70 3.50 3.50 3.50 3.55Exchange rate (average) 3.55 3.65 3.41 3.49 3.40 3.50
12.30.2016 3.31.2017 6.14.2017

24 \ Inflation Report \ Banco Central do Brasil \ June 2017
projection for 2019 remained at 4.50%, while, for 2020, it dropped from 4.50% to 4.25% in the period under analysis.
The median of the exchange rates projected by the market for the end of 2017 and 2018 reached, respectively, R$3.30/US$ and R$3.40/US$, on June 14 (R$3.25/US$ and R$3.40/US$, at the end of March). For 2019, the median remained at R$3.50/US$, while, for 2020, it rose from R$3.50/US$ to R$3.55/US$.
The median projections for the average exchange rate in 2017 and 2018 reached, respectively, R$3.24/US$ and R$3.38/US$ (R$3.18/US$ and R$3.35/US$, on March 31), while the average exchange rate for 2019 and 2020 reached R$3.40/US$ and R$3.50/US$ (R$3.41/US$ and R$3.49/US$, on March 31).
June 2017 \ Banco Central do Brasil \ Inflation Report \ 25
Impact of the crop harvest on the economic activity
The production of the farming sector – the sum of agriculture, forestry, and fishing – increased 13.4% in the first quarter of 2017, relative to the fourth quarter of last year, according to seasonally adjusted data by the Brazilian Institute of Geography and Statistics (IBGE), driving the economic recovery after eight consecutive quarters of negative change of the GDP, according to this comparison basis.
This box analyses the effects of the signifcant growth in crop harvest on the economic activity, considering both the characteristics of the farm sector measurement in the Quarterly National Accounts (IBGE) and the effects of it shocks on other economic sectors.
The crop production is the main component of the farm activity, accounting for 63.7% of the value added by the sector, according to data from the 2014 Supply and Use Table, followed by the livestock production (26.9%) and forestry, fishing, and aquaculture (9.4%).
According to the Quarterly National Accounts methodology released by the IBGE, the volume index of the value added by the crop activity is estimated using forecasts for the annual growth, which is updated monthly in the Systematic Agricultural Production Survey (LSPA), from IBGE. The production is seasonally distributed within the year, according to the harvest periods, compiled based on the 2006 Farm Survey. The aggregation of the agriculture products is performed using data from the gross value of production from the Municipal Agriculture Survey (PAM, from IBGE) and from the added value from the Supply and Use Tables1.
_______________________________________________________ 1/ The volume index of other components of the farm sector, such as the livestock production and forestry, are calculated using
data from the Quarterly Slaughter Survey and the Monthly Industrial Survey, respectively, both published by IBGE.

26 \ Inflation Report \ Banco Central do Brasil \ June 2017
The weight of the major crops in each quarter (Table 1) is estimated according to the PAM 2015 and the 2006 Farm Census. It bears noticing that corn and soybean cultures account, together, for the major part of the crop production of the first two quarters, although the relevance of soy decreases in the second quarter.
The growth of the crop production in 2017 reflects, primarily, the good performance of tobacco, soybean, corn and rice, with the production of the last three being assigned mainly to the first quarter. Since these crops will lose their relevance in the GDP calculation through the remainder of the year and will be replaced by cultures with weaker outcomes (for example, decreases of 8.4% and 0.3% for the coffee and sugar cane crops are projected), it is likely that the great part of the positive direct contribution of the crop production for the economic activity in 2017 has already taken place on the first quarter.
Besides the direct effects on the added value of the farming sector, the growth of the crop output generates positive effects on the productive chain. Among the indirect effects, it is possible to emphasize the impact of the distribution and trade of the crop on the demand for retail and transport services; the positive effects on the industrial chains associated with crop products; and the impulse that the agriculture income generates on the demand for other goods and services.
(%)
Quarter Cassava Coffee Corn Cotton Rice Soybean Sugar Cane Tobacco Wheat Total
I 2.0 0.1 11.6 0.3 5.6 63.6 2.7 3.5 0.1 89.5
II 2.3 12.4 12.8 3.5 4.2 42.5 10.6 0.1 0.1 88.5
III 4.2 10.2 14.0 7.8 0.4 1.5 37.1 0.5 1.8 77.4
IV 7.3 0.3 4.3 0.1 0.9 3.6 35.9 8.1 6.2 66.6
Ano 3.2 6.2 11.7 3.0 3.4 35.4 17.1 2.3 1.2 83.6
2017 production growth (%)
-13.0 -8.4 52.3 7.3 14.7 18.5 -0.3 29.3 -9.5 -
Source: 2015 PAM, 2006 Farm Census, and 2017 LSPA (IBGE)
Table 1 – Quarterly weights of the major crop products and 2017 production growth

June 2017 \ Banco Central do Brasil \ Inflation Report \ 27
In order to estimate the sum of these effects, a model2 relating the production of the farm sector with the nonfarm GDP – sum of the production of all sectors, except farm, plus taxes – was estimated. Figure 1 shows the impulse-response function of a shock in the farm production on the non-farm GDP.
A shock of 1 percentage point in the farm production generates, in average, a statistically significant impact of 0.05 percentage point on the production of the rest of economy in the current quarter. However, there are no evidences that this same shock has impact in the following quarters.
In order to identify which economic sectors are affected by shocks in the crop production, several bivariate models were estimated relating the crop production with the other economic activities. The results suggest that the manufacturing, transportation and retail sectors are affected, in the current quarter, by agricultural shocks (Figure 2). There was no evidence of a statistically significant effect on other economic activities stemming from a shock on the production of the farm sector.
In short, the positive shock on the production of the farm sector in 2017 has impacted significantly the economic activity in the first quarter of this year. Considering the farm sector estimate methodology considered in the Quarterly National Accounts and the econometric exercise presented in this box, the greater part of the effect of record crop production in 2017 should be limited to the first quarter of the year.
References
IBGE 2016 – Série Relatórios Metodológicos, Volume 28, Contas Nacionais Trimestrais – Referência 2010 (3ª edição).
_______________________________________________________ 2/ A vector autoregressive model (VAR) was estimated in the first difference of the logarithmic transformation of the seasonally
adjusted series, where the nonfarm GDP was adjusted with the same process adopted by IBGE in the Quarterly National Accounts (see IBGE 2016, p. 44). The estimation was controlled for the business cycle including the following exogenous variables: Sistema Especial de Liquidação e de Custódia (Selic) interest rate, Emerging Markets Bond Index (Embi) Brazil, exchange rate US dollar / The lag length was chosen according to Schwarz and Akaike information criteria. In order to identify the shocks, the assumption that the farm production does not respond contemporaneously to the nonfarm production was used. The results found were robust, with similar order of magnitude in other specifications of the model, both changing the lag length and using seasonally adjusted series in level or in year-over-year differences.
Figure 2 – Response of selected sectors to shocks in farming outputShock of 1 percentage point in farming. QuartersPercentage points
-0.08
-0.04
0.00
0.04
0.08
0.12
0.16
0.20
0 1 2 3 4 5 6 7
Manufacturing Transportation Retail
Figure 1 – Response of nonfarm GDP to shocks in farming outputShock of 1 percentage point in farming. QuartersPercentage points
-0.10-0.08-0.06-0.04-0.020.000.020.040.060.080.10
0 1 2 3 4 5 6 7
Response Lower interval Upper interval
28 \ Inflation Report \ Banco Central do Brasil \ June 2017
Inventories and the recent economic cycle
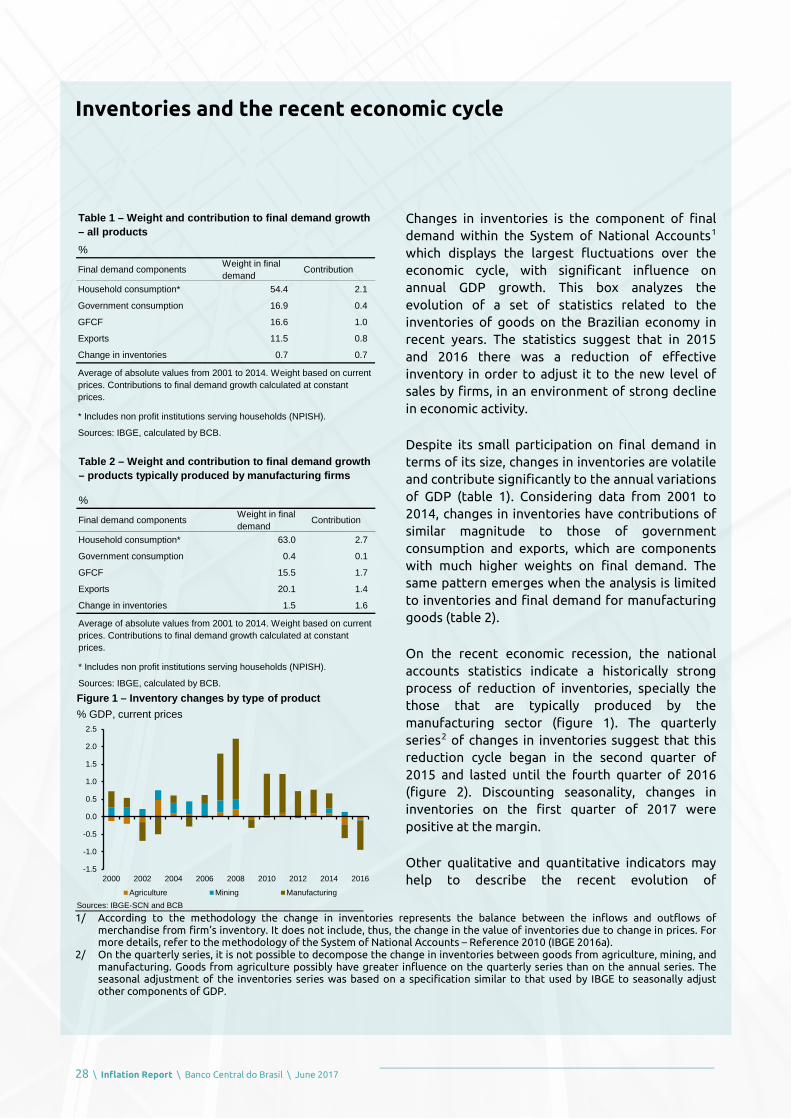
Changes in inventories is the component of final demand within the System of National Accounts1 which displays the largest fluctuations over the economic cycle, with significant influence on annual GDP growth. This box analyzes the evolution of a set of statistics related to the inventories of goods on the Brazilian economy in recent years. The statistics suggest that in 2015 and 2016 there was a reduction of effective inventory in order to adjust it to the new level of sales by firms, in an environment of strong decline in economic activity.
Despite its small participation on final demand in terms of its size, changes in inventories are volatile and contribute significantly to the annual variations of GDP (table 1). Considering data from 2001 to 2014, changes in inventories have contributions of similar magnitude to those of government consumption and exports, which are components with much higher weights on final demand. The same pattern emerges when the analysis is limited to inventories and final demand for manufacturing goods (table 2).
On the recent economic recession, the national accounts statistics indicate a historically strong process of reduction of inventories, specially the those that are typically produced by the manufacturing sector (figure 1). The quarterly series2 of changes in inventories suggest that this reduction cycle began in the second quarter of 2015 and lasted until the fourth quarter of 2016 (figure 2). Discounting seasonality, changes in inventories on the first quarter of 2017 were positive at the margin.
Other qualitative and quantitative indicators may help to describe the recent evolution of
_______________________________________________________ 1/ According to the methodology the change in inventories represents the balance between the inflows and outflows of
merchandise from firm’s inventory. It does not include, thus, the change in the value of inventories due to change in prices. For more details, refer to the methodology of the System of National Accounts – Reference 2010 (IBGE 2016a).
2/ On the quarterly series, it is not possible to decompose the change in inventories between goods from agriculture, mining, and manufacturing. Goods from agriculture possibly have greater influence on the quarterly series than on the annual series. The seasonal adjustment of the inventories series was based on a specification similar to that used by IBGE to seasonally adjust other components of GDP.
%
Final demand components Weight in final demand Contribution
Household consumption* 54.4 2.1
Government consumption 16.9 0.4
GFCF 16.6 1.0
Exports 11.5 0.8
Change in inventories 0.7 0.7
* Includes non profit institutions serving households (NPISH).
Sources: IBGE, calculated by BCB.
Average of absolute values from 2001 to 2014. Weight based on current prices. Contributions to final demand growth calculated at constant prices.
Table 1 – Weight and contribution to final demand growth – all products
%
Final demand components Weight in final demand Contribution
Household consumption* 63.0 2.7
Government consumption 0.4 0.1
GFCF 15.5 1.7
Exports 20.1 1.4
Change in inventories 1.5 1.6
* Includes non profit institutions serving households (NPISH).
Table 2 – Weight and contribution to final demand growth – products typically produced by manufacturing firms
Average of absolute values from 2001 to 2014. Weight based on current prices. Contributions to final demand growth calculated at constant prices.
Sources: IBGE, calculated by BCB.Figure 1 – Inventory changes by type of product% GDP, current prices
Sources: IBGE-SCN and BCB
-1.5
-1.0
-0.5
0.0
0.5
1.0
1.5
2.0
2.5
2000 2002 2004 2006 2008 2010 2012 2014 2016
Agriculture Mining Manufacturing

June 2017 \ Banco Central do Brasil \ Inflation Report \ 29
inventories, in part due to the still preliminary status of the national accounts statistics for 2015 and 2016. It is also important to notice that, in line with box “Inventories and Economic Cycle” from the March 2009 Inflation Report, there are few sources of quantitative and comprehensive data on the level and evolution of inventories in Brazil.
The industry surveys of Confederação Nacional da Indústria (CNI) and Fundação Getulio Vargas (FGV) produce monthly indicators about inventories with a qualitative nature. Despite differences on their trajectories, the indicators show, in a general fashion, a rise in inventories in relation to their planned/desired levels through 2014 and the beginning of 2015, and a subsequent adjustment through 2015 and 20163 (figure 3).
Additionally, sectoral statistics from Anfavea show a similar picture, with a rise in the inventories of vehicles measured in daily sales through 2015 and a subsequent adjustment throughout 2016 (figure 4). It bears noticing that in 2015 the rise of inventories measured in daily sales happened simultaneously to a downward trend on the actual number of vehicles held in inventory, which is consistent with the fall in vehicle sales in the period.
Data from the balance sheet of manufacturing firms with traded stocks also suggest a reduction cycle of inventories through 2015 and 20164 (figure 5). On the other hand, when compared to the firm’s operating revenue, the level of inventories still seem relatively high, despite some adjustment since 20155 (figure 6).
Together the indicators analyzed above suggest that the effective inentory of manufacturing products declined both in 2015 and 2016. Throughout this period, the decline has apparently been sufficient to adjust the inventories to firms’ desired/planned levels, even though data from
_______________________________________________________ 3/ These movements do not necessarily represent changes on the actual inventory of firms during this period, since these
indicators also respond to changes on the planned or desired inventory levels. 4/ For each quarter data from around 100 manufacturing firms were used to build the indicator. For each firm and quarter, the
year-over-year percent change of nominal inventories was calculated. The indicator on figure 4 represents the median of these variations, from which the year-over-year change of manufacturing IPA-DI (a producer price index) was discounted, in order to correct for the effect of price increases on the inventory value.
5/ The quarterly ratio between inventory and operating revenue displays a seasonal pattern on the firm level. The quarterly ratio for each firm was seasonally adjusted and, after that, the difference between the ratio in each quarter and its average in 2013 was calculated. The indicator is obtained as the median of these differences and tries to measure, in aggregate terms, how adequate the inventory levels are relative to the sales of manufacturing firms.
Figure 4 – Vehicle inventories1/
3-month-moving average
Source: Anfavea1/ Seasonally adjusted (BCB).
35
40
45
50
150
200
250
300
350
400
I2014
II III IV I2015
II III IV I2016
II III IV I2017
Thousand vehicles (left)Inventory in terms of daily sales (right)
Figure 2 – Change in Quarterly Inventories1//GDP ratio in 4 Quarters%
Sources: IBGE-SCN and BCB1/ Seasonally adjusted (BCB).
-0.6
-0.4
-0.2
0.0
0.2
0.4
0.6
0.8
I2005
I2007
I2009
I2011
I2013
I2015
I2017
Figure 3 – Indicators of inventory adequacy1/2/
3-month-moving average
Sources: FGV-SCIT and CNI-SI1/ Seasonally adjusted (FGV/BCB).2/ Higher values indicate higher inventories.
47
48
49
50
51
52
53
70
80
90
100
110
120
130
I2010
I2011
I2012
I2013
I2014
I2015
I2016
I2017
FGV-SCIT Inventory level (left)
CNI-SI Effective less planned inventories – manufacturing (right)

30 \ Inflation Report \ Banco Central do Brasil \ June 2017
traded companies indicate that inventory-revenue ratios are still relatively high.
Looking forward, a positive and more significant contribution of inventories to the final demand seems conditional on the recovery of the other demand components6, especially on household consumption and gross fixed capital formation. Since the central scenario on this Inflation Report foresees a gradual recovery of both components, the contribution of inventories to the final demand in 2017 should be positive.
References
IBGE 2016a – Série Relatórios Metodológicos, Volume 24, Sistema de Contas Nacionais Brasil – Ano de Referência 2010 (3rd edition).
IBGE 2016b – Série Relatórios Metodológicos, Volume 28, Contas Nacionais Trimestrais – Referência 2010 (3rd edition).
_______________________________________________________ 6/ In fact, on the annual series of the National Accounts, changes in inventories have a positive correlation with economic activity,
measured both in terms of supply (GDP), and in terms of final demand components.
Figure 5 – Inventory of manufacturing firms1/
Year-over-year change (%)
Sources: Economática and BCB1/ Manufacturing firms with traded stocks.
-20
-15
-10
-5
0
5
10
15
20
I2007
I2008
I2009
I2010
I2011
I2012
I2013
I2014
I2015
I2016
I2017
Figure 6 – Inventory/Operating Revenue ratio of manufacturing firms1/2/
Difference in relation to the average level in 2013
Sources: Economática and BCB1/ Manufacturing firms with traded stocks.2/ Indicator derived from firm-level seasonally adjusted series.
-0.5
0.0
0.5
1.0
1.5
2.0
2.5
I2011
I2012
I2013
I2014
I2015
I2016
I2017

June 2017 \ Banco Central do Brasil \ Inflation Report \ 31
Revision of GDP growth projections for 2017
This box updates the Central Bank’s forecasts for the GDP growth in 2017. Projections were revised considering the latest data released for the first quarter, the coincident indicators already disclosed for the second quarter of the year and the set of information available until the cutoff date of this Report.
GDP growth projections for 2017
The forecast for 2017 GDP growth remained at 0.5 percent, the same as in the previous Inflation Report, but with changes in its components. The maintenance of the projection considered on the one hand, favorable results of activity indicators for the first five months of the year, which, if maintained throughout the year, would lead to an upward revision in the annual GDP projection. On the other hand, the increase in current uncertainty, if maintained for a prolonged period, may have detrimental effects on the activity, which would recommend maintenance of the previous projection.
In line with the good result of the primary sector in the first quarter, the growth projection for agriculture was revised upwards (9.6 percent from 6.4 percent in the previous Inflation Report). Among the crops that should contribute to the agricultural growth in 2017 are corn, soybeans and rice, which should register respective annual increases of 52.3 percent, 18.5 percent and 14.7 percent, according to the Systematic Agricultural Production Survey (LSPA), from IBGE. It should be noted that, according to the box Impact of Crop Harvest on the Economic Activity, most of the positive contribution of the sector to the economic activity in 2017 is concentrated in the first quarter of the year.
The projection for industrial output was revised from -0.1 percent to 0.3 percent, which, if confirmed, would be the first positive result since 2013. The revision reflected, mainly, the improvement in the expected results of mining (4.0 percent from 0.5 percent in March) and civil

32 \ Inflation Report \ Banco Central do Brasil \ June 2017
construction (-2.1 percent, compared to -2.7 percent in March). Manufacturing and public utilities (electricity, bottled gas and water) should also contribute positively, with expected growth of 0.6 percent and 2.3 percent, in order.
Services production is expected to decline 0.1 percent, compared to a previous forecast of 0.1 percent growth. In this scenario, sectors most related to the industry, such as transportation, information services and other services, should register growth, contrasting with the expected drop in commerce and financial intermediation, insurance, social security and related services.
Regarding the domestic components of aggregate demand, the expected growth of household consumption was revised from 0.5 percent to stability. That downward revision is mainly due to the dynamic of the labor market and the evolution of credit during the first half of this year. Government consumption is expected to decline by 0.6 percent, compared to an increase of 0.2 percent in the March Report, reflecting the ongoing fiscal adjustment. The Gross Fixed Capital Formation (GFCF) is expected to decrease by 0.6 percent, compared to a decrease of 0.3 percent in the previous Report, reflecting mainly the less favorable result foreseen for absorption of capital goods.
The exports and imports of goods and services are projected to rise by 3.3 percent and 3.8 percent, respectively (2.4 percent and 3.5 percent in the previous report). The forecast for exports reflects the positive performance of the agricultural crop. Under this scenario, the contribution of the external sector to the 2017 GDP growth is estimated at zero, whereas the one related to domestic demand is projected at 0.5 p.p., driven by the annual variation of inventories1.
_______________________________________________________ 1/ See box “Inventories and the recent economic cycle”, in this edition of the Inflation Report.
Table 1 – Gross Domestic ProductAccumulated in 4 quarters
% growth2016 2017
IV Q IV Q1/
Crop and livestock -6.6 9.6
Industry -3.8 0.3 Mining -2.9 4.0 Manufacturing -5.2 0.6 Construction -5.2 -2.1 Public utilities 4.7 2.3
Services -2.7 -0.1 Commerce -6.3 -0.4 Transportation, storage and mailing -7.1 0.2 Communications -3.0 0.7 Financial and related services -2.8 -2.1 Other services -3.1 0.4 Real estate services 0.2 0.2 Public administration, health and education -0.1 -0.1
Value added at basic prices -3.1 0.5
Taxes on products -6.4 0.4
GDP at market prices -3.6 0.5
Household consumption -4.2 -0.0Government consumption -0.6 -0.6Gross fixed capital formation -10.2 -0.6Exports 1.9 3.3Imports -10.3 3.8
Source: IBGE1/ Estimated

June 2017 \ Banco Central do Brasil \ Inflation Report \ 33
What is Direct Investment? How does it work in Brazil?
The persistence of Direct Investment (DI) in Brazil at relatively high levels over the recent years has raised doubts about the concept of DI in the Balance of Payments (BOP). This box shows that the DI definition in Brazil follows the current international methodological standards, and that its evolution confirms the intuition that DI is the most stable component of capital flows.
The compilation of DI statistics by the Central Bank of Brazil (BCB) strictly follows the international methodological definitions consolidated in the IMF’s Sixth Edition of the Balance of Payments and International Investment Position Manual (BPM6) and the fourth edition of the Benchmark Definition of Foreign Direct Investment (BMD4) of the Organization for Economic Cooperation and Development (OECD).
The DI is one of the five functional categories of the BOP1 Financial Account and, like the others, records economic transactions (flows) between residents and nonresidents of an economy in a specific period of time. In Brazil, the BOP is released on a monthly basis, while the international standard release is on a quarterly basis.
In order to be classified as DI, an economic transaction between a resident and a nonresident requires that both parts have a direct investment relationship with each other. By example, in the case of direct investment liabilities, this relationship exists when the resident abroad has the control or a significant degree of influence on the management of the enterprise that is resident in the country. This definition aims to capture permanent economic relationship, in which the nonresident investor has long-term interests. The practical rule for the measurement of “control or significant degree of influence” is the ownership, by each nonresident investor, individually, of 10%
_______________________________________________________ 1/ Together with portfolio investments, derivatives, other investments (basically loans and deposits) and reserve assets.

34 \ Inflation Report \ Banco Central do Brasil \ June 2017
or more of the voting power in the invested enterprise2.
Also included in the direct investment relationship are economic transactions carried out between fellow enterprises, defined as those enterprises that do not hold at least 10% of the voting power in each other, but that are connected to the same direct investor and, therefore, belong to the same economic group.
Both BPM6 and BMD4 take into account the existence of two DI components, both utilized by the direct investor to finance economic activities of the recipient enterprise:
1. Equity capital: establishment or acquisition of a company that leads to the ownership of at least 10% of the voting power; as well as investments (or disinvestments) carried out after the establishment of a direct investment relationship; and
2. Intercompany lending: lending and amortization of credits between companies of the same economic group3 by means of distinct debt instruments (loans, debt securities, trade credits).
The DI component referring to intercompany lending has been included in the account since 2001, following the adoption of BPM5 in Brazil (1993), in line with BMD3.
Economic characteristics regarding risk, cost, terms and enforceability degree of intra-group credit granting significantly differ from market operations4 and the economic behavior of these flows is similar to that of DI rather than to that of portfolio investment or other investments.
The compilation of DI investments in Brazil is carried out by means of microdata of individual transactions through the identification of resident and nonresident parties and the characterization of
_______________________________________________________ 2/ See paragraphs 6.8 and 6.12 of BPM6, and 29, 31, 117, 124 and 125 of BMD4. An economic transaction in which the nonresident
investor holds less than 10% of the voting power of the invested enterprise is classified in the functional category of portfolio investment in the BOP Financial Account and, conceptually, reflects short-term investor’s interests, without effective participation in the enterprises’ management.
3/ Debt operations between financial enterprises (including banks) of the same economic group are allocated as portfolio investments or other investments and, therefore, are not included in the DI component intercompany lending.
4/ Paragraph 6.26 of BPM6.
June 2017 \ Banco Central do Brasil \ Inflation Report \ 35
the direct investment relationship. Based on such information, it may be often observed, in the same transaction, the existence of several options for direct investors bringing resources from abroad through the modalities of equity capital or intercompany lending. Also, it may be frequently observed cases in which the same direct investor combines these two modalities to finance its investments, or even the conversion of a liability originally in the loan modality into equity capital.
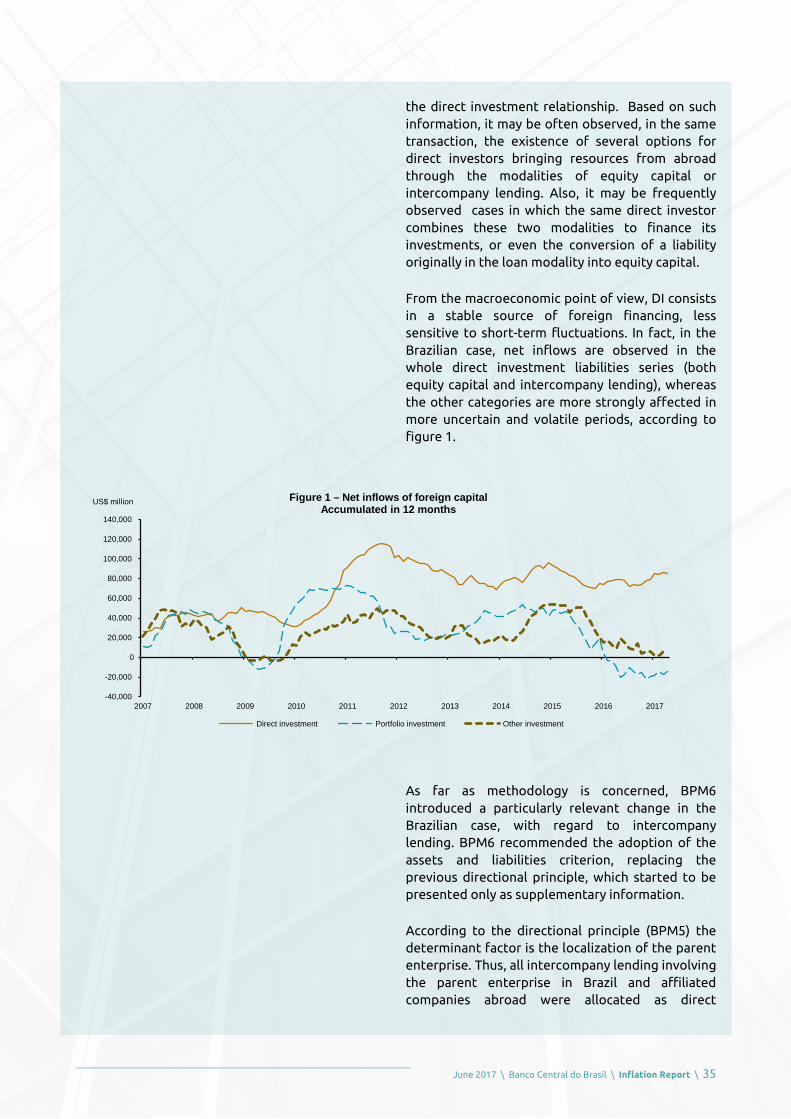
From the macroeconomic point of view, DI consists in a stable source of foreign financing, less sensitive to short-term fluctuations. In fact, in the Brazilian case, net inflows are observed in the whole direct investment liabilities series (both equity capital and intercompany lending), whereas the other categories are more strongly affected in more uncertain and volatile periods, according to figure 1.
As far as methodology is concerned, BPM6 introduced a particularly relevant change in the Brazilian case, with regard to intercompany lending. BPM6 recommended the adoption of the assets and liabilities criterion, replacing the previous directional principle, which started to be presented only as supplementary information.
According to the directional principle (BPM5) the determinant factor is the localization of the parent enterprise. Thus, all intercompany lending involving the parent enterprise in Brazil and affiliated companies abroad were allocated as direct
-40,000
-20,000
0
20,000
40,000
60,000
80,000
100,000
120,000
140,000
2007 2008 2009 2010 2011 2012 2013 2014 2015 2016 2017
US$ million Figure 1 – Net inflows of foreign capitalAccumulated in 12 months
Direct investment Portfolio investment Other investment

36 \ Inflation Report \ Banco Central do Brasil \ June 2017
investment outwards, regardless of the economic unit that was granting the credit. Therefore, “reversal” loans (affiliated abroad to the parent enterprise in the country) were recorded as direct investment outwards with inverted sign, i.e., liability transactions that reduce assets. This logical was similar for the direct investment inwards.
According to the criterion of assets and liabilities (BPM6), the determinant factor is the generation of a foreign asset or liability. Thus, all intercompany lending from nonresidents to residents must be allocated in the direct investment liabilities, regardless of the parent enterprise localization.
This methodological change is summarized in the chart below5.
As for Brazil, the most relevant impact of this change under the international methodological standard occurred for the heading “Affiliated abroad to the Brazilian parent enterprise”, a transaction that reduced direct investment inwards in the BPM5 and was reclassified as direct investment liabilities in the BPM6. The majority of these resources originates from issuances of securities by affiliated companies of Brazilian groups abroad, which are brought into the country under the modality of loans to Brazilian parent enterprises, classified in the BOP, according to the
_______________________________________________________ 5/ Further details on the BPM6 impact on DI are available in BCB (2015b).
BPM5 – Directional principle BPM6 – Assets and liabilities
Direct investment - Outwards Direct investment - Assets Equity capital Equity capital Intercompany lending Intercompany lending Brazilian direct investor to affiliated abroad Brazilian direct investor to affiliated abroad (-) Affiliated abroad to Brazilian direct investor (+) Affiliated in Brazil to direct investor abroad
Direct investment - Inwards Direct investment - Liabilities Equity capital Equity capital Intercompany lending Intercompany lending (-) Affiliated in Brazil to direct investor abroad (+) Affiliated abroad to Brazilian direct investor Direct investor abroad to affiliated in Brazil Direct investor abroad to affiliated in Brazil

June 2017 \ Banco Central do Brasil \ Inflation Report \ 37
international methodological standard (BPM6 and BMD4), as intercompany lending6.
Figure 2, below, shows the trajectory of DI in Brazil according to two concepts: direct investment inwards (BPM5) and direct investment liabilities (BPM6).
The BCB discloses DI statistics (table below) with sufficient detailing for transforming the methodology of assets and liabilities (BPM6) into the directional principle (BPM5), according to the previous table’s orientation, so as users may reproduce the Figure 2, above.
Finally, another aspect about direct investment flows, measured according to the international methodology for the compilation of foreign sector statistics (BPM6 and BMD4) refers to the relationship and differences with the concept of Gross Fixed Capital Formation (GFCF), measured by National Accounts. DI reflects an economic transaction between a resident and nonresident, according to the definition above, which may occur either by the capitalization by the nonresident investor of an affiliated enterprise in the country or the acquisition of an already existing enterprise owned by residents. GFCF represents the expansion of the future output capacity of an economy by means of current investments in fixed assets, with no restriction by the investor’s residence.
_______________________________________________________ 6/ Further details about these transactions are described in the Box “Debt Securities issued in the International Market by offshore
subsidiaries of Brazilian Corporations”, only in Portuguese, released in the March 2015 Inflation Report.
0
20,000
40,000
60,000
80,000
100,000
120,000
140,000
2007 2008 2009 2010 2011 2012 2013 2014 2015 2016 2017
US$ million Figure 2 – Direct investment flowsAccumulated in 12 months
Direct investment liabilities - Assets/Liabilities Criterion (BPM6) FDI - Directional Principle (BPM5)
Table 1 – Direct Investment Liabilities
Direct investment liabilities flows
Total
Equity capital – total
Equity capital, other than reinvestment of earnings
Inflows
Outflows
Equity capital – reinvestment of earnings
Intercompany lending
Disbursements
Headquarters abroad and subsidiary in Brazil
Subsidiary abroad and headquarters in Brazil (reverse investment)
Fellow enterprises
Amortizations
Headquarters abroad and subsidiary in Brazil
Subsidiary abroad and headquarters in Brazil (reverse investment)
Fellow enterprises

38 \ Inflation Report \ Banco Central do Brasil \ June 2017
In this conceptual framework, mergers and acquisitions involving nonresident direct investor are included in the DI definition according to BPM6 and BMD4. Since they represent, in the immediate moment, property transfer of enterprises, mergers and acquisitions do not add fixed capital to the economy, and consequently do not impact the GFCF. In turn, since DI operations denominated Greenfield raise output capacity, they affect both statistics, even though at distinct record periods.
The BCB does not have sources of information for precisely distinguishing these two DI modalities. It should be highlighted that this distinction does not belong to the standard BPM6 information, although it is included in the BMD4 as supplementary data.
Summing up, this box showed that the BCB strictly follows international standards for the compilation and dissemination of DI statistics (BPM6 and BMD4), which include the criterion of assets and liabilities and the DI category comprising two components: equity capital and intercompany lending. The BCB releases DI statistics with sufficient details for the building of an FDI indicator according to the previous methodological standards (BPM5 and BMD3). As expected, the DI trajectory is the most stable foreign capital flow in the BOP.
References
BANCO CENTRAL DO BRASIL (2015a). Debt Securities issued in the International Market by offshore subsidiaries of Brazilian Corporations. Inflation Report, March 2015. pg. 64-67. http://www.bcb.gov.br/htms/relinf/port/2015/03/ri201503b5p.pdf
BANCO CENTRAL DO BRASIL (2015b). Direct investment and primary income (earnings) – Adoption of the Sixth Edition of the Balance of Payments and International Investment Position Manual (BPM6), Methodological Note nr.3. October 2015. http://www.bcb.gov.br/ingles/economic/nm3bpm6i.pdf
INTERNATIONAL MONETARY FUND (2009). Balance of Payments and International Investment Position Manual, Sixth Edition (BPM6).

June 2017 \ Banco Central do Brasil \ Inflation Report \ 39
https://www.imf.org/external/pubs/ft/bop/2007/pdf/bpm6.pdf
ORGANIZATION FOR ECONOMIC COOPERATION AND DEVELOPMENT (2008). Benchmark Definition of Foreign Direct Investment, Fourth Edition (BMD4). https://www.oecd.org/daf/inv/investmentstatisticsandanalysis/40193734.pdf

40 \ Inflation Report \ Banco Central do Brasil \ June 2017
Balance of Payments projections for 2017
This box reviews the projections for the balance of payments in 2017, by taking into account the evolution of the domestic economic scenario, the prospects for the international economy as well as the most recent data regarding outstanding and external indebtedness and debt service of the country.
Based on a scenario of gradual recovery of the economic activity, the hike of the Brazilian commodities prices exported in the four-month period ended in April, as well as market expectations of a higher exchange devaluation in 2017, relative to the expected in the March 2017 Inflation Report, drove the revision, from US$ 30 billion to US$24 billion (1.19% of GDP), for the current account deficit in 2017.
A US$ 54 billion foreign trade surplus is projected for this year, with an increase of 10.1% in exports and 6.9% in imports, which should reach US$203 billion and US$149 billion, respectively. Comparing to the previous projection, the value of the exports increased US$3 billion and the imports remained the same. The review of the trade balance mainly reflects the positive evolution, up to May, of revenues related to exports of oil, iron ore and soybean complex.
The service account deficit is estimated at US$34.0 billion (US$36.7 billion on the previous Inflation Report). Net expenditures for operating leasing services are expected to drop in US$1.0 billion, to US$ 18.5 billion, impacted by the outcomes of the first four months of this year. One estimates the maintenance of net travel expenditures at US$12.5 billion, and the reduction, from US$5.2 billion to US$4.8 billion, in net transportation expenditures.
Net expenditures on interests are estimated at US$22.5 billion, a US$1.1 billion increase regarding the previous projection, and slightly higher than what was observed in 2016 (US$21.9 billion), when international rates remained in a lower level than the current one. Considering the expectations for the economic activity and exchange rate, net

June 2017 \ Banco Central do Brasil \ Inflation Report \ 41
remittances of profits and dividends were reduced from US$26.5 billion to US$24.5 billion, a low level from the historical point of view. The projection for net inflow of secondary income reduced to US$2.8 billion, spurred by the increase in gross expenditures.
Net inflows of direct investments liabilities (IDP) were estimated at US$75 billion (3.71% of GDP), fully financing the estimated current account deficit. Besides, net outflows of direct investments abroad were reduced from US$14 billion to US$5 billion, under the context of increasing selling of assets abroad held by some Brazilian economic groups that play important role in international markets.
Concerning portfolio investment liabilities, the figures of the first four months show net outflows of equities and investment funds and net inflows of debt securities traded in the domestic market, a different trend compared to 2016. Under this context, one projects neutral flows for equities and investment funds (a US$10 billion net inflow in the previous projection) and for debt securities traded in the domestic market (a US$7 billion net outflow in the previous projection), therefore estimating the balance for the flows of asset traded in the domestic market by non-resident investors. The forecast for rollover rates of loans and fixed-income securities traded abroad (maturities of one year or more) increased from 80% to 90%, in line with recent outcomes and lower spreads compared to 2016.
Regarding repo credit lines, US$7.2 billion are already negotiated to be paid back to the Central Bank in 2017, while for the balance of payments’ financial gap a US$15.9 billion surplus is expected, against US$15.5 billion in the previous projection. In this scenario, banks operating in the Brazilian foreign exchange market are expected to increase by US$8.7 billion the balance of their deposits abroad.
Table 1 – Balance of payments forecastsUS$ billion
Itemization 2016 2017
Apr Jan- Year Apr Jan- Year1/
Apr Apr
Current account 0.4 -7.2 -23.5 1.2 -3.5 -24.0
Trade balance 4.6 12.4 45.0 6.7 20.6 54.0
Exports 15.3 55.7 184.5 17.6 68.0 203.0
Imports 10.7 43.3 139.4 10.9 47.4 149.0
Services -2.5 -8.7 -30.4 -2.5 -9.9 -34.0
Travel -0.6 -1.7 -8.5 -0.9 -3.5 -12.5
Others -1.9 -7.0 -22.0 -1.6 -6.4 -21.5
Primary income -1.9 -11.8 -41.1 -3.2 -14.8 -46.8
Interest -1.4 -7.2 -21.9 -2.3 -8.8 -22.5
Dividends -0.6 -4.8 -19.4 -0.9 -6.1 -24.5
Others 0.0 0.1 0.3 0.0 0.1 0.2
Secondary income 0.2 1.0 3.0 0.2 0.7 2.8
Capital account 0.0 0.1 0.3 0.0 0.1 0.4
Financial account -0.0 -4.8 -16.5 1.7 -1.2 -23.6
Investment assets2/ 5.5 17.9 40.7 8.5 24.5 56.7
DI assets 1.2 2.7 7.8 0.1 0.8 5.0
Banks' assets 3.1 1.5 -1.7 4.9 4.8 8.7
Other assets 1.2 13.7 34.5 3.5 18.9 43.0
Investment liabilities2/ 8.6 21.8 65.4 11.1 33.3 91.0
DI liabilities 6.8 23.8 78.9 5.6 29.5 75.0
Total shares 1.6 4.5 10.6 -0.4 -1.0 -
Debt sec. in Brazil -0.1 -7.2 -26.7 4.4 3.2 -
Loans and debt sec.
abroad long term -1.2 -14.5 -20.7 -1.1 -5.0 -5.6
Debt sec. public -0.1 0.5 1.8 -0.1 -1.1 -1.5
Debt sec. private -0.8 -2.9 -5.5 0.4 -0.1 -0.8
Direct loans -0.4 -12.4 -13.6 -1.0 -2.5 -3.0
Others4/ 0.0 0.3 -3.4 -0.4 -1.3 -0.2
Loans and debt sec.
abroad short term -1.5 8.6 3.8 0.1 -0.3 -
Other liabilities5/ 3.0 6.6 19.4 2.5 6.9 21.6
Financial derivatives -0.3 -0.3 -1.0 -0.1 -0.1 -
Reserve assets 3.4 -0.6 9.2 4.4 7.8 10.7
Errors and omissions -0.5 2.3 6.8 0.6 2.2 -
Memo:
Current account/GDP (%) -1.2 -1.3 -0.5 -1.2
FDI / GDP (%) 4.0 4.4 4.5 3.7
1/ Forecast.2/ Includes direct investment, portfolio investment and other investments.3/ Includes equities traded in stock exchanges in Brazil and abroad.4/ Includes banks', buyers', bilateral and multilateral loans5/ Includes trade credit liabilities and other liabilities.

42 \ Inflation Report \ Banco Central do Brasil \ June 2017
Table 2 – Balance of payments – Financial gap1/
US$ billion
Itemization 2016* 2017*
Apr Jan- Year Apr Jan- Year2/
Apr Apr
Current account 0.4 -7.2 -23.5 1.2 -3.5 -30.0
Interest on debt securities issued in the country - expenses -0.0 -2.6 -6.0 -0.0 -2.9 -6.2
Interest on international reserves - receipts 0.2 1.0 3.0 0.3 1.1 3.3
Reinvested earnings – receipts -0.0 0.1 1.3 0.1 0.5 3.0
Reinvested earnings – expenses -0.6 -3.4 -9.1 -0.4 -1.7 -7.0
Current account – financial gap 0.8 -2.3 -12.8 1.1 -0.5 -23.1
Financial account -5.3 -1.6 -16.1 -7.6 -11.2 -38.6
Assets 2.4 16.3 41.0 3.5 19.2 44.0
Direct investment assets, except reinvested dividends 1.2 2.5 6.5 -0.1 0.3 11.0
Portfolio investment, except banks -1.1 -0.9 -0.7 0.7 2.0 -
Other investment, except banks 2.3 14.6 35.3 2.9 16.9 33.0
Liabilities 8.0 15.8 50.3 10.7 28.7 82.2
Direct investment liabilities, except reinvested dividends 6.2 20.4 69.8 5.2 27.8 68.0
Portfolio investment, except reinvested interest 0.6 -7.6 -25.8 4.4 -2.1 -6.1
Other investment 1.1 3.0 6.3 1.2 3.0 20.2
Others 0.3 -2.1 -6.9 -0.4 -1.6 -0.4
Financial gap3/ 6.1 -0.7 3.4 8.7 10.7 15.5
Net Banco Central interventions4/ 3.0 -2.2 5.1 3.9 5.9 7.2
Banks: asset changes5/ 3.1 1.5 -1.7 4.9 4.8 8.3
1/ Excludes all transactions settled through international reserves or in domestic currency, except for foreign exchange market internventions, and domestic transaction settled in reais.2/ Forecast.3/ + = surplus in the foreign exchange market; - = deficit in the foreign exchange market.4/ + = increase of international reserves; - = decrease of international reserves.5/ + = increase in the assets owned by banks; - = decrease in the assets owned by banks.* Preliminary data.

June 2017 \ Banco Central do Brasil \ Inflation Report \ 43
The impact of expectations and economic activity on the underlying inflation of the services sector
The economic slowdown and its effects on employment do not coincide with the downward movement of the underlying inflation in the services sector1. Despite the economic activity retraction and the rise in unemployment, recorded since the last quarter of 2014, the underlying inflation in the services sector remained higher than 9.0% in 12 months until the end of 2015, only slowing down in 2016, in parallel with the Brazilian consumer price index’ (IPCA) disinflation process (Figure 1). What is the role of inflation expectations and economic activity in services price behavior? This box aims to answer this question relating the recent trajectory of the underlying inflation in the services sector with the evolution of expectations and economic cycle.
For this purpose, Phillips curves were estimated in order to explain the underlying inflation in the services sector, the inflation of the remaining non-regulated prices; and the IPCA aggregated market prices inflation (Equations 1 to 3).
(1) 𝜋𝜋𝑡𝑡𝑠𝑠 = ∑ 𝛼𝛼𝑖𝑖𝑠𝑠𝐷𝐷𝑖𝑖 +4𝑖𝑖=1 𝛽𝛽1𝑠𝑠𝜋𝜋𝑡𝑡−1𝑠𝑠 + (1 − 𝛽𝛽1𝑠𝑠)𝐸𝐸𝑡𝑡𝜋𝜋𝑡𝑡+1 + 𝛾𝛾𝑠𝑠ℎ𝑡𝑡−1 + 𝛿𝛿𝑠𝑠𝑤𝑤𝑡𝑡−1 + 𝜀𝜀𝑡𝑡𝑠𝑠
(2) 𝜋𝜋𝑡𝑡𝑙𝑙𝑠𝑠 = ∑ 𝛼𝛼𝑖𝑖𝑙𝑙𝑠𝑠𝐷𝐷𝑖𝑖 +4𝑖𝑖=1 𝛽𝛽1𝑙𝑙𝑠𝑠𝜋𝜋𝑡𝑡−1𝑙𝑙𝑠𝑠 + 𝛽𝛽2𝑙𝑙𝑠𝑠𝜋𝜋𝑡𝑡−1∗ + (1 − 𝛽𝛽1𝑙𝑙𝑠𝑠 − 𝛽𝛽2𝑙𝑙𝑠𝑠)𝐸𝐸𝑡𝑡𝜋𝜋𝑡𝑡+1 + 𝛿𝛿𝑙𝑙𝑠𝑠𝑤𝑤𝑡𝑡−1 + 𝜌𝜌𝑙𝑙𝑠𝑠𝑧𝑧𝑡𝑡−2 + 𝜀𝜀𝑡𝑡𝑙𝑙𝑠𝑠
(3) 𝜋𝜋𝑡𝑡𝑙𝑙 = 𝜔𝜔𝑡𝑡𝑠𝑠𝜋𝜋𝑡𝑡𝑠𝑠 + 𝜔𝜔𝑡𝑡
𝑙𝑙𝑠𝑠𝜋𝜋𝑡𝑡𝑙𝑙𝑠𝑠
In the equations, 𝜋𝜋𝑡𝑡𝑠𝑠, 𝜋𝜋𝑡𝑡𝑙𝑙𝑠𝑠, 𝜋𝜋𝑡𝑡𝑙𝑙, 𝜋𝜋𝑡𝑡∗ and 𝐸𝐸𝑡𝑡𝜋𝜋𝑡𝑡 represent, respectively, the underlying inflation in the services sector, the inflation of the remaining non-regulated prices, the market price inflation, the external inflation measured by the monthly changes of Brazilian Commodity Index (IC-Br), measured in Reais, and the current expectation for IPCA; 𝐷𝐷𝑖𝑖 are seasonal dummies; ℎ𝑡𝑡 is a measure of the output gap; 𝑤𝑤𝑡𝑡 is the change in the average real
_______________________________________________________ 1/ The underlying inflation in the sector of services excludes the changes in the prices of the groups “tourism”; “domestic services”;
“courses” and “communication”. These groups hinder the identification of the inflationary tendency in the sector of services for several reasons, such as excessive volatility and methodology of calculation. This segmentation in the inflation of services is better described in the box “Service sector inflation“, released in the September 2016Inflation Report.
4
6
8
10
12
14
2
4
6
8
10
12
Jan2004
Jan2006
Jan2008
Jan2010
Jan2012
Jan2014
Jan2016
IPCAUnderlying service inflationUnemployment rate (dir.)
Figure 1 – IPCA, underlying services inflation and unemployment % change in 12 months; and % monthly change
Sources: IBGE, BCB and Continuous PNAD

44 \ Inflation Report \ Banco Central do Brasil \ June 2017
income2; 𝑧𝑧𝑡𝑡 represents the difference between wholesale and retail prices3; 𝜔𝜔𝑡𝑡
𝑠𝑠 and 𝜔𝜔𝑡𝑡𝑙𝑙𝑠𝑠 are the
weights of the underlying inflation in the services sector and of the remaining market prices, such that 𝜔𝜔𝑡𝑡
𝑠𝑠 + 𝜔𝜔𝑡𝑡𝑙𝑙𝑠𝑠 = 1; and 𝜀𝜀𝑡𝑡𝑠𝑠 and 𝜀𝜀𝑡𝑡𝑙𝑙𝑠𝑠 are the error
terms of the equations.
Figure 2 highlights that the system of equations above captures a large part of the fluctuations of the underlying inflation in the services sector.
The estimation results show that the average contribution of the output gap fluctuations and of the real income variations for the underlying inflation in the services sector changed from positive in the 2010-2014 period to negative in from 2014-2016 period.
Indeed, from 2010 until the end of 2014, changes in the pattern of consumption enabled by the employment evolution and by the income transfer’ programs stimulated the demand for services, explaining the higher level of underlying inflation in the services sector in relation to the remaining market price inflation. In the following period, the rise in unemployment and the economic activity contraction explain the smaller contribution of the income and output gap to the underlying inflation in the services sector (figure 3).
According to the results of the econometric model, the underlying inflation in the services sector only remained in its ascending path until the end of 2015 because of the higher contribution stemming from inflationary expectations in relation to the previous years. From 2010 to the third quarter of 2014, for example, the average contribution of inflation expectations and inertia for the underlying inflation in the services sector was 6.03 p.p. per year. This contribution increased to around 8.60 p.p. per year from the end of 2014 to 2015, more than compensating the smaller contribution of the activity factors for the inflation of this subgroup.
Nevertheless, from 2016 onwards, in particular after the second semester, the decrease in inflation expectations joined the economic activity
_______________________________________________________ 2/ Computed based on FGTS (Length-of-Service Guarantee Fund for) revenue data, released by Caixa Econômica Federal (CEF); and
on the number of formal workers in Caged (General Register for Employed and Unemployed), released by the Ministry of Labor. The series was deflated by IPCA.
3/ Subtracted from its mean.
0.5
1.0
1.5
2.0
2.5
3.0
3.5
I2004
I2005
I2006
I2007
I2008
I2009
I2010
I2011
I2012
I2013
I2014
I2015
I2016
I2017
Observed Estimated
Figure 2 – Underlying services inflation% change in 3 months
Sources: IBGE and BCB
99
101
103
105
107
109
95
100
105
110
115
120
125
130
I2004
II2005
III2006
IV2007
I2009
II2010
III2011
IV2012
I2014
II2015
III2016
Price of services, deflated by IPCAAverage incomeGDP (right)
Figure 3 – Price of services, average income and GDP2004 = 100
Sources: IBGE and BCB
June 2017 \ Banco Central do Brasil \ Inflation Report \ 45
retraction and the IPCA disinflation process itself to explain the sharp decline of the underlying inflation in the services sector.
In conclusion, this box evaluated how the underlying inflation in the services sector was related to the evolution of the economic cycle and inflation expectations in recent years. Results from the econometric model revealed that the decrease in the contributions of the output gap and income to the inflation in the services sector from the end of 2014 to 2015 was more than compensated by the increase in the contributions of the inertia and inflationary expectations for services inflation. However, from 2016 onwards, the decrease in inflation expectations together with the economic conditions explained the pronounced slowdown of the underlying inflation in the services sector.
![SEConomy: a Framework for the Economic Assessment of ... · Further, Gartner [16] corroborates with the U.S.A. estimate, predicting in 2018 a cost of 114 and 124 billion USD in 2019,](https://img.dokumen.tips/doc/110x75/5f4f6f9c862e9a33c32ebdc5/seconomy-a-framework-for-the-economic-assessment-of-further-gartner-16-corroborates.jpg)


![ECONOMIC SCENARIO GENERATORS AND SOLVENCY II · 1 ECONOMIC SCENARIO GENERATORS AND SOLVENCY II BY E. M. VARNELL [Presented to the Institute of Actuaries, 23 November 2009] ABSTRACT](https://img.dokumen.tips/doc/110x75/5f83c8af8eb03d483673e2d2/economic-scenario-generators-and-solvency-ii-1-economic-scenario-generators-and.jpg)


