Embed Size (px)
Citation preview

Distribution of Microbial Biomass and Potential for AnaerobicRespiration in Hanford Site 300 Area Subsurface Sediment
Xueju Lin,a,b David Kennedy,a Aaron Peacock,c James McKinley,a Charles T. Resch,a James Fredrickson,a and Allan Konopkaa
Pacific Northwest National Laboratory, Richland, Washington, USAa; Georgia Institute of Technology, School of Biology, Atlanta, Georgia, USAb; and Haley & Aldrich, Inc.,Oak Ridge, Tennessee, USAc
Subsurface sediments were recovered from a 52-m-deep borehole cored in the 300 Area of the Hanford Site in southeasternWashington State to assess the potential for biogeochemical transformation of radionuclide contaminants. Microbial analyseswere made on 17 sediment samples traversing multiple geological units: the oxic coarse-grained Hanford formation (9 to 17.4m), the oxic fine-grained upper Ringold formation (17.7 to 18.1 m), and the reduced Ringold formation (18.3 to 52 m). Microbialbiomass (measured as phospholipid fatty acids) ranged from 7 to 974 pmols per g in discrete samples, with the highest numbersfound in the Hanford formation. On average, strata below 17.4 m had 13-fold less biomass than those from shallower strata. ThenosZ gene that encodes nitrous oxide reductase (measured by quantitative real-time PCR) had an abundance of 5 to 17% relativeto that of total 16S rRNA genes below 18.3 m and <5% above 18.1 m. Most nosZ sequences were affiliated with Ochrobactrumanthropi (97% sequence similarity) or had a nearest neighbor of Achromobacter xylosoxidans (90% similarity). Passive multi-level sampling of groundwater geochemistry demonstrated a redox gradient in the 1.5-m region between the Hanford-Ringoldformation contact and the Ringold oxic-anoxic interface. Within this zone, copies of the dsrA gene and Geobacteraceae had thehighest relative abundance. The majority of dsrA genes detected near the interface were related to Desulfotomaculum spp. Theseanalyses indicate that the region just below the contact between the Hanford and Ringold formations is a zone of active biogeo-chemical redox cycling.
The Hanford Site is located within the semiarid Pasco Basin ofthe Columbia Plateau in southeastern Washington State. The
site contains radioactive waste stemming from years of nuclearweapon production. Large volumes of process wastewater wereintroduced into the 300 Area process ponds and infiltratedthrough the 4- to 10-m-thick vadose zone beneath the disposalfacilities. Even after excavation of the bulk of contaminated sedi-ments from the ponds, a groundwater uranium (U) plume hasremained beneath the 300 Area, with the core of the plume ex-ceeding the drinking water standard (30 �g/liter) (11, 41). TheColumbia River forms the north and east boundaries of the Site.Upstream, the river is dam controlled; the river stage at the site canvary up to 3 m seasonally (6), and this variation causes near-shorewater table fluctuations. These, in turn, affect dissolved U concen-trations and distribution within the contaminant plume. Near theriver, field-scale elements, such as aquifer sediments, groundwa-ter, and the Columbia River, comprise a complex and dynamicmicrobial environment. The construction of experimental fieldsites, such as the Hanford Integrated Field Research Challenge(IFRC) site, in the 300 Area thus represent a unique and valuablenatural laboratory for understanding the hydrologic, mass trans-fer, and biogeochemical processes controlling contaminant fateand transport in the subsurface environment.
The role of subsurface microorganisms in transforming con-taminants has not been a consideration in past decisions regardingenvironmental management of the Hanford Site. Microbial reac-tions can modify contaminant solubility, result in the precipita-tion or dissolution of mineral phases, and consume electron do-nors and reduce electron acceptors (and thereby alter the chemicaland biogeochemical reactivity of microsites). Selected subsurfacemicrobiology investigations were performed at Hanford, mainlyin the western central plateau, in the early 1990s (15, 25, 34). Theseinvestigations largely predated the application of molecular ecol-
ogy, and there has been only a small amount of recent work atHanford related to microbial ecology (12, 14, 16, 19, 36). As aresult, the significance of microbial community composition andfunctional potential for contaminant transformation in near-shore regions along the Columbia River corridor remains un-known.
For this initial study of subsurface sediments in the 300 Area ofthe Hanford Site, we characterized the vertical distribution of mi-crobial biomass and community potential for relevant biogeo-chemical activities (reductions of sulfate, metals, and nitrate)across multiple geological formations, as well as groundwater geo-chemistry. We employed real-time quantitative PCR (qPCR) toassay the distribution of functional groups and constructed clonelibraries for samples from selected depths to phylogeneticallycharacterize the organisms. These measurements of the distribu-tion of microbial biomass and functional bacterial groups wererelated to depth-dependent geochemical gradients in the aquiferdetermined using a passive multilevel sampler.
MATERIALS AND METHODSSite description and sampling. Sampling took place in an experimentalwell field (Hanford Integrated Field Research Challenge [IFRC] site; http://ifchanford.pnl.gov/) in the 300 Area of the Hanford Site near Richland,WA. The site is about 250 m from the Columbia River. A deep character-ization borehole (well number C6209), penetrating 52 m below the
Received 1 November 2011 Accepted 18 November 2011
Published ahead of print 2 December 2011
Address correspondence to Allan Konopka, [email protected].
Copyright © 2012, American Society for Microbiology. All Rights Reserved.
doi:10.1128/AEM.07404-11
0099-2240/12/$12.00 Applied and Environmental Microbiology p. 759–767 aem.asm.org 759
Dow
nloa
ded
from
http
s://j
ourn
als.
asm
.org
/jour
nal/a
em o
n 25
Jan
uary
202
2 by
46.
71.2
07.1
95.

ground surface (bgs), was drilled during late July 2008 (6). Seventeensamples representing �1-m stratigraphic intervals were subjected to in-tensive microbiological analysis. These included three coarse-grained sed-iments from the saturated zone in the Hanford formation (9 to 17.4 mbgs) and six samples from the transition zone between the Hanford-Ringold contact (17.4 m bgs) and the fine-grained upper Ringold forma-tion (18.9 m bgs). This transition zone comprises an aquitard that sepa-rates the upper aquifer from deeper Ringold formation sediments. Eight(30.8 to 51.5 m bgs) samples were analyzed from the Ringold formation’sunit E and lower mud strata and down to the Columbia River basalt flowtop. Sampling methods and sediment lithology have been described else-where (6). The subsamples of cores were immediately stored in a �80°Cfreezer until processed for extraction of either DNA or phospholipid fattyacids.
Chemical measurements for groundwater and sediment samples.Groundwater samples were taken by equilibrating multilevel sampler(MLS) cells (53) in wells C6204 and C6209 at the IFRC site (http://ifchanford.pnl.gov/pdfs/18340.pdf) for more than 2 weeks prior to re-covery for chemical measurements. These two wells are approximately 60m apart, with C6204 near the southwest corner of the IFRC site well fieldand C6209 to the northeast, closer to the Columbia River. Due to theirregular subsurface topography, samplers deployed at the same depths inthe two wells could access strata with disparate mineralogy or lithic tex-ture. However, the profiles do allow comparisons of geochemistry acrosscomparable units. Well C6204 had a 4-inch PVC (polyvinyl chloride)wire-wrap screen from 9.6 to 17.2 m below ground surface, correspondingto the geological strata from the water table into the upper reduced Rin-gold formation. Well C6209 was screened in the reduced Ringold forma-tion from 18.9 m to 37.2 m.
Dissolved cations were determined on 0.2-�m-filtered, nitric acid-preserved samples using a Perkin Elmer Optima 2100 DV inductivelycoupled plasma optical emission spectrophotometer (ICP-OES). TheICP-OES was calibrated using ICP standards (Ultra Scientific, Inc., Kings-town, RI) in a dilution range of 0.5 to 3,000 �g liter�1.
Dissolved anions were determined in 0.2-�m-filtered, unpreservedsamples using a Dionex ICS-2000 anion chromatograph, with an AS40auto sampler. The analysis was performed using isocratic 15-min elutionswith 23 mM KOH eluent at 30°C at a flow rate of 1 ml min�1. A guardcolumn (IonPac AG18 guard, Dionex catalog number 060551) and ananalytical column (IonPac AS18, Dionex catalog number 060549) wereused with an anion suppressor (Dionex catalog number 064554). Stan-dards were made from Spex CertiPrep solution (1,000 mg liter�1 anionstandards, Metuchen, NJ) with dilutions calibrated from 0.24 to 120 ppm(except for fluoride, 0.08 to 40 ppm, and nitrite, 0.24 to 40 ppm).
Dissolved sulfide was determined on unfiltered samples using thecolorimetric methylene blue method (method 8131, Hach Co., Love-land, CO).
Dissolved gases were measured by gas chromatography at Oak RidgeNational Laboratory using methods described in Spalding and Watson(44).
For gas analysis of H2 and CH4 in our laboratory, samples were run ona Trace Analytical RGA5 process gas analyzer (Peak Laboratories, LLC,Mountain View, CA). One-milliliter sample volumes were injected fromthe diffusion gas syringes to fill the 100-�l fixed injection loop. The cali-bration range for H2 and CH4 was 1 to 300 ppm. H2 was run with areductive gas detector (RGD) set at 265°C using a dual column consistingof a Supelco phase 700-059, 60/80-mesh, molecular sieve 5A, 31-in. by1/8-in. stainless steel column and a Supelco phase 700-028, 60/80-mesh,Unibead, 31-in. by 1/8-in. stainless steel column set at 105°C. The carriergas for the RGD was 99.9999% ultrapure nitrogen (product numberX34380; Oxarc) with a nitrogen prepurifier (product number NP2; VICIValco Instruments, Inc.) at 62 lb/in2 and a flow rate of 22 cm3 min�1. Theretention time for hydrogen was 35 s. Methane was run using a flameionization detector (FID) at 295°C with an 80/100-mesh HayeSep A solid-phase, 13.5 ft by 1/16 in. column set at a temperature of 80°C. Gases used
for the FID were ultrapure 99.9999% hydrogen (product number 33505;Oxarc) at 42 lb/in2 and 25 cm3 min�1 and ultrapure 99.9999% com-pressed air (zero air, product number X32070; Oxarc) at 66 lb/in2 and 34cm3 min�1. The retention time for methane was 61 s.
Organic carbon in sediment was analyzed in three subsamples fromeach of the following strata: Hanford formation (9.1 to 9.6 m bgs), oxi-dized Ringold formation (17.7 to 18.0 m bgs), and reduced Ringold for-mation (18.6 to 18.9 m bgs). Total Fe was only analyzed in the Hanfordformation sample. The samples were sieved through a 4.75-mm mesh,and organic C or total Fe was analyzed at Huffman Laboratories, Inc.(Golden, CO), according to ASTM standard methods (http://www.astm.org/DIGITAL_LIBRARY/index.shtml). In addition, the concentrationsof Fe(II) were analyzed by ferrozine assay (46) in the sieved Hanfordformation sediments after extraction with 0.5 N HCl. Fifteen milliliters ofanoxic 0.5 N HCl was added to the weighed sediments in an anaerobicglove bag (5% H2 and 95% N2; Coy Laboratory Products, Inc., Grass Lake,MI), and the samples were incubated at 100 rpm and 30°C for 24 h. Theextraction was performed in triplicate.
PLFA analysis. Subsamples frozen at �80°C were shipped overnightto Microbial Insights, Inc., for analysis of phospholipid fatty acids (PLFA).Phospholipid biomarker analysis was performed as previously described(40). Briefly, PLFA were extracted with a single-phase chloroform-methanol buffer system (54). The total extractable lipids were then sepa-rated, using a silicic acid column, into three lipid categories: neutral lipids,glycolipids, and polar lipids (18). After fractionation, the polar lipid por-tion was transesterified to form fatty acid methyl esters (FAMEs) by mildalkaline methanolysis to release plasmalogen ethers as dimethyl acetals(18). Quantification and identification of individual PLFA were done us-ing a combination of gas chromatography and mass spectroscopy.
MPN determinations. The medium for most probable number(MPN) culture was a mineral salts medium that mimicked the ionicstrength and composition of groundwater augmented with a mix of or-ganic substrates and a specific terminal electron acceptor. The mineralsalts medium (pH 7.8) contained NaHCO3 (1.1 mM), Ca(NO3)2 · 4H2O(0.18 mM), CaCl2 · 2H2O (0.42 mM), MgSO4 (0.21 mM), Na2SO4 (0.14mM), KHCO3 (0.07 mM), NH4Cl (1 mM), KCl (1.34 mM), NaH2PO4
(0.43 mM), and HEPES (3 mM). The medium was supplemented with 10ml liter�1 of 10� Wolfe’s vitamin solution (3), 10 ml liter�1 of 10�Wolfe’s mineral solution (3), and 10 ml liter�1 electron donor mix (13compounds at 40 mM each substrate: formate, acetate, propionate,caprylic acid, methanol, ethanol, n-propanol, n-butanol, pyruvate, DL-malate, succinate, DL-lactate, and glycerol plus Casamino Acids [2.5 gliter�1]). For fermenters, glucose was added (final concentration, 0.2mM). After autoclaving, 1 ml of 1 g liter�1 selenium and 0.1 ml of 100 mMFe-nitrilotriacetate were added.
Different electron acceptors were used to assess the cultivability ofphysiological groups. (i) For aerobic microorganisms, an oxic mediumwas used. All other tests entailed anoxic incubations with the followingspecific modifications to the culture medium: (ii) fermenters, 0.2 mMglucose; (iii) denitrifiers, 5 mM NaNO3; (iv) Mn-reducing bacteria, 5 mMMnO2 and no HEPES buffer; (v) iron-reducing bacteria, 5 mM amor-phous ferrihydrite; and (vi) sulfate reducers, 5 mM Na2SO4.
To prepare MPN series, sediment slurries containing 1 g fresh sedi-ment and 9 ml mineral salts solution were shaken at 200 rpm for 1 h atroom temperature. The original sediment slurry was then serially dilutedby adding 1 ml of each dilution to the 9 ml of mineral salts solution to afinal sediment mass fraction of 10�6. Twenty microliters of each dilutionwas used to inoculate 180 �l of medium in the wells of microtiter plates(Corning, New York, NY), with 8 replicates per dilution. After inocula-tion, the plates were covered with sterile lids (corner notch lid; Corning,New York, NY) and wrapped with Parafilm to avoid water loss by evapo-ration. All MPN series (except the aerobes) were incubated for 12 to 24weeks at room temperature in an anaerobic chamber. Nitrate reducingmedium was checked under the stereoscope for the growth of denitrifiers.Precipitation or clearing in SO4
2�, Fe3�, and Mn4� reducing media was
Lin et al.
760 aem.asm.org Applied and Environmental Microbiology
Dow
nloa
ded
from
http
s://j
ourn
als.
asm
.org
/jour
nal/a
em o
n 25
Jan
uary
202
2 by
46.
71.2
07.1
95.

visually examined under a stereoscope. The media for aerobes and fer-menters were inoculated onto a solid medium and tested for growth:PYT80 (80 mg of each peptone, yeast extract, and tryptone) was used foraerobes, and PYT80 plus 5 mM glucose for anaerobes. Phytagel (Sigma-Aldrich, St. Louis, MO) at 0.8% plus 6.3 mM MgSO4 was used as thegelling agent.
DNA extractions, cloning, and preparation of plasmid standards.DNA was extracted from 10 to 20 g of sediment from each stratum.Briefly, a prelysis washing step was applied by mixing about 10 g of soilwith 25 ml of phosphate buffer 1 (pH 6.6) and 1.5 ml of 100 mM Al2(SO4)3
solution and then adjusting the pH to 8 for centrifugation (20). A lysisbuffer containing 2 ml of SDS lysis mixture (100 mM NaCl, 500 mM Tris[pH 8], 10% [wt/vol] SDS) and 15 ml phosphate buffer (pH 8.0) wasadded to each sediment pellet, followed by three cycles of freeze-thaw celllysis at �80°C for 20 min and 65°C for 5 min per cycle. The final lysis stepwas done by incubating the samples at 65°C for 30 min, and then they werecentrifuged at 5,000 � g for 2 min. The supernatant containing genomicDNA was collected and precipitated by mixing with 0.1 volume of 5 MNaCl and 1.0 volume of isopropanol. The extracted DNA, as well as othercoextracts (e.g., protein), was centrifuged at 8,500 � g for 60 min at roomtemperature. The pellet was cleaned up by extraction using an equal vol-ume of phenol/chloroform/isoamylalcohol (25:24:1), followed by two ex-tractions with chloroform/isoamylalcohol (24:1). The genomic DNA wasfurther purified with a Montage PCR kit (Millipore Corp., Bedford, MA)by washing 3 times with 450 �l of 10 mM Tris.
Isolation of genomic DNA from cultured strains (as standards forqPCR) was done using a MoBio PowerSoil DNA isolation kit according tothe manufacturer’s manual. For targeting 16S rRNA genes, plasmid clonescontaining 16S rRNA gene fragments were chosen as standards for qPCRassays. DNA fragments containing the small subunit (SSU) rRNA genewere amplified by PCR with genomic DNA of reference strains or envi-ronmental samples listed in Table 1. The bacteria-specific primers 27F and1492R were used to amplify 16S rRNA genes of Shewanella oneidensisMR-1, Anaeromyxobacter dehalogenans strain K, and Geobacter sulfurre-ducens. The dsrA and nosZ gene fragments were amplified from Desulfo-vibrio desulfuricans strain F28-1 using primers DSR-1F and DSR-4R, andenvironmental DNA (from the 9.5-m depth) using nosZ2-F and nosZ2-R.
To generate the above-named gene fragments, 50-�l PCR mixturescontained 1� Easy-A high fidelity master mix (Stratagene Ltd.), 100 to1,000 nM primers (Table 1), and 1 �l template DNA. PCR was performedin a PTC-225 Peltier thermal cycler (MJ Research) with an initial dena-turation step of 95°C for 3 min, followed by 25 cycles of 95°C for 30 s,annealing at temperatures referenced in the above table for 30 s, and 72°C
for 1.5 min, with a final extension at 72°C for 10 min. PCR products werepurified with a MinElute PCR purification kit (Qiagen Inc., Valencia, CA)according to the manufacturer’s instructions. The amplification productswere visualized by electrophoresis through a 1.0% agarose gel in 1� TAE(40 mM Tris-acetate, 1 mM EDTA) containing ethidium bromide (0.50mg ml�1). The amplicons were cloned using the TOPO TA cloning kit(Invitrogen, Carlsbad, CA) and served as standard templates. Plasmidsused as standards for qPCR assays were purified using a PureLink quickplasmid miniprep kit (Invitrogen) according to the manufacturer’s pro-tocol and sequenced to confirm the insertions. Linearized plasmids wereproduced by digestion with the restriction endonuclease EcoRI (Invitro-gen, Carlsbad, CA) according to the manufacturer’s protocol and purifiedusing a MinElute PCR purification kit (Qiagen, Inc., CA). The DNA con-centrations of purified plasmids were determined fluorometrically using aPicoGreen DNA quantification kit (Invitrogen) and a Turner DesignsTD-700 fluorometer according to the manufacturer’s manual.
Quantitative real-time PCR assays. All reactions were performedwith a StepOnePlus real-time PCR system (Applied Biosystems, Inc., Fos-ter City, CA) programmed for 45 cycles according to the references listedin Table 1. Power SYBR green PCR master mix was used for all SYBRgreen-based assays. For the GEO494F/825R primer pair, optimal primerconcentrations were performed using a matrix of concentrations thatranged from 100 to 1,000 nM forward and reverse primers. The primercombination with the lowest cycle threshold (CT) value (number of PCRcycles that elapse before the threshold is reached) and the highest �Rnvalue (baseline-subtracted fluorescent reading normalized to the refer-ence dye) were selected. For all SYBR green-based assays, the meltingcurves of amplicons were analyzed to ensure that a single homogenousproduct was generated.
Linearized plasmid DNA with inserts of specific gene fragments wasused to establish standard curves that were included in each run. Thestandard contained different quantities of cloned gene fragments, span-ning 8 orders of magnitude from 101 to 108 gene copies per PCR well. Tominimize the effects of inhibitors in assays, environmental DNA was di-luted to 5 to 10% of the original concentrations, and duplicate wells eachcontaining 2.5 �l of diluted DNA were run for each sample. The results arereported as the relative abundance of gene copies, normalized to the totalbacterial and archaeal 16S rRNA gene copy numbers as reported in Linet al. (28).
Constructing clone libraries for nosZ, dsrA, and Shewanella 16SrRNA genes. Two clone libraries of nosZ genes were constructed fromqPCR products using DNA samples from depths of 9.5 m (Hanford for-mation) and 18.9 m (just below the Ringold oxic-reduced interface), re-
TABLE 1 Primers, probes, reference strains, and clones used in the study
PCR Target
Source of gene fragmentsinserted into plasmidstandards
Primer (concn [�M])
Reference(s)Forward Reverse Probe
End-point PCR dsrAB DSR-1F (0.4) DSR-4R (0.4) 52Shewanella spp. She211f (0.4) She1259r (0.4) 49
Real-time PCR Domain Bacteria Shewanella oneidensis MR-1 331F (0.1) 797R (0.1) UNI (0.1) 38Domain Archaea Methanospirillum hungatei ARCH349F (0.8) ARCH806R (0.8) ARCH516F (0.2) 47Anaeromyxobacter
spp.Anaeromyxobacter
dehalogenans strain K60F (0.4) 461R (0.4) 39
Geobacteraceae Geobacter sulfurreducens GEO494F (0.15) GEO825R (0.15) 24Shewanella spp. Shewanella oneidensis MR-1 She112f (0.3) She220r (0.3) 23, 49dsrA (dissimilatory
sulfite reductasegene)
Desulfovibrio desulfuricans DSR-1F (0.4) DSR-4R (0.4) 26, 43
nosZ (nitrous oxidereductase gene)
nosZ gene of Ochrobactrumanthropi from sampledepth 9.5 m
nosZ-2F (1.0) nosZ-2R (1.0) 22
Hanford Site Subsurface Biomass and Anaerobic Respiration
February 2012 Volume 78 Number 3 aem.asm.org 761
Dow
nloa
ded
from
http
s://j
ourn
als.
asm
.org
/jour
nal/a
em o
n 25
Jan
uary
202
2 by
46.
71.2
07.1
95.
spectively. Clone libraries of dsrA gene fragments were constructed byamplifying DNA from depths of 17.4 m and 18.3 m with primer pairDSR-1F and DSR-4R (Table 1). Thirty-six white colonies from each nosZand dsrA library and 60 colonies from the Shewanella 16S rRNA geneclone library were picked for plasmid isolation and sequencing. She-wanella 16S rRNA genes were amplified with primers She211f andShe1295r (Table 1) from samples at depths of 9.5 m, 18.9 m, and 47.3 m.Amplicons from these three depths were purified and quantified. Equalamounts of amplicons from each sample were pooled for ligation andtransformation. Forty-eight white colonies were picked to prepare glyc-erol stocks. The PCR conditions for amplification of each gene target havebeen described above. Glycerol stocks, after a 12-hr incubation, were sentto Agencourt Bioscience Corporation for plasmid isolation and one-waysequencing (�800 bp per read).
Phylogenetic analysis of gene sequences. The nosZ and dsrA genesequences were translated in NCBI’s open reading frame finder (http://www.ncbi.nlm.nih.gov/projects/gorf/), and their phylogenetic affilia-tions checked using the blastp program. Sequences confirmed to be nosZor dsrA genes were aligned in MEGA4 with functional gene sequencesdownloaded from Functional Gene Pipeline (http://fungene.cme.msu.edu/). Sequences that were more than 97% similar were clustered, andone representative sequence was used to construct a neighbor-joiningtree. Those nearest neighbors and representative nosZ or dsrA sequencesfrom the database were included in the tree construction.
Shewanella 16S rRNA gene sequences were imported into ARB (32)and aligned using FastAligner. The nearest neighbors were marked to-gether with sequences in this study to generate a neighbor-joining treewith a bootstrap analysis. Sequences that were more than 99% similarwere considered identical, and one representative sequence was kept forconstruction of a neighbor-joining tree.
Nucleotide sequence accession numbers. The above-described se-quences have been assigned GenBank accession numbers HQ622631 toHQ622640 (nosZ gene), HQ622641 (Shewanella 16S rRNA gene),
JN185617 to JN185621 (Pseudomonas 16S rRNA gene), and HQ622642 toHQ622645 (dsrA gene).
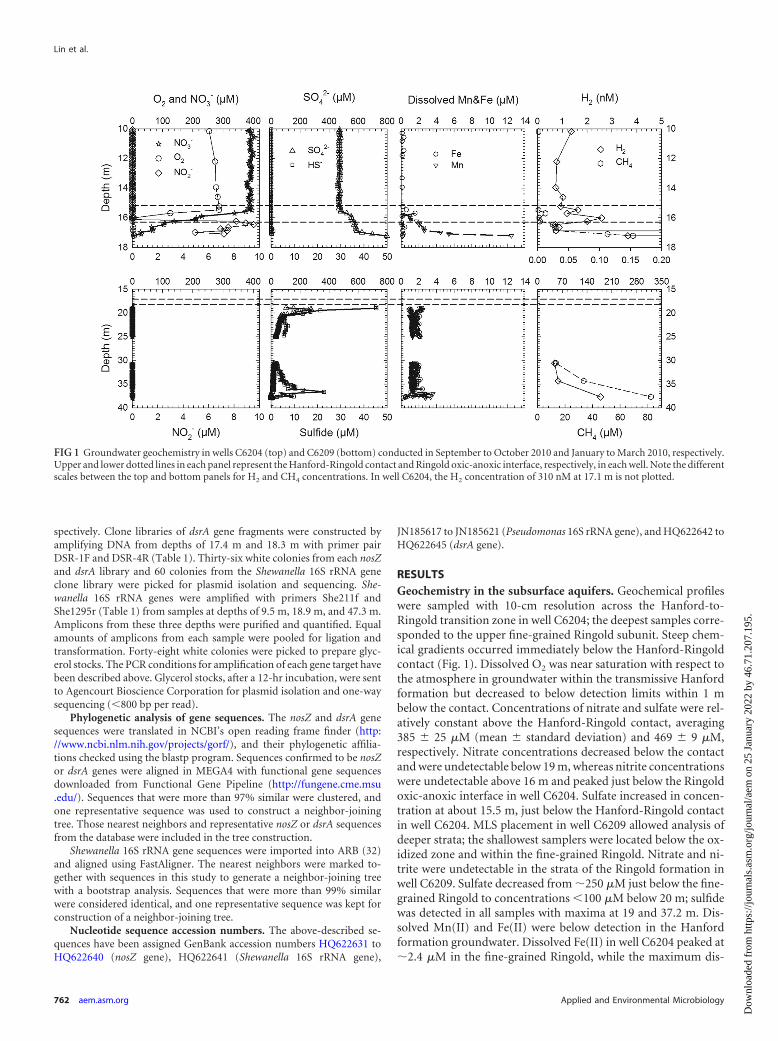
RESULTSGeochemistry in the subsurface aquifers. Geochemical profileswere sampled with 10-cm resolution across the Hanford-to-Ringold transition zone in well C6204; the deepest samples corre-sponded to the upper fine-grained Ringold subunit. Steep chem-ical gradients occurred immediately below the Hanford-Ringoldcontact (Fig. 1). Dissolved O2 was near saturation with respect tothe atmosphere in groundwater within the transmissive Hanfordformation but decreased to below detection limits within 1 mbelow the contact. Concentrations of nitrate and sulfate were rel-atively constant above the Hanford-Ringold contact, averaging385 � 25 �M (mean � standard deviation) and 469 � 9 �M,respectively. Nitrate concentrations decreased below the contactand were undetectable below 19 m, whereas nitrite concentrationswere undetectable above 16 m and peaked just below the Ringoldoxic-anoxic interface in well C6204. Sulfate increased in concen-tration at about 15.5 m, just below the Hanford-Ringold contactin well C6204. MLS placement in well C6209 allowed analysis ofdeeper strata; the shallowest samplers were located below the ox-idized zone and within the fine-grained Ringold. Nitrate and ni-trite were undetectable in the strata of the Ringold formation inwell C6209. Sulfate decreased from �250 �M just below the fine-grained Ringold to concentrations �100 �M below 20 m; sulfidewas detected in all samples with maxima at 19 and 37.2 m. Dis-solved Mn(II) and Fe(II) were below detection in the Hanfordformation groundwater. Dissolved Fe(II) in well C6204 peaked at�2.4 �M in the fine-grained Ringold, while the maximum dis-
FIG 1 Groundwater geochemistry in wells C6204 (top) and C6209 (bottom) conducted in September to October 2010 and January to March 2010, respectively.Upper and lower dotted lines in each panel represent the Hanford-Ringold contact and Ringold oxic-anoxic interface, respectively, in each well. Note the differentscales between the top and bottom panels for H2 and CH4 concentrations. In well C6204, the H2 concentration of 310 nM at 17.1 m is not plotted.
Lin et al.
762 aem.asm.org Applied and Environmental Microbiology
Dow
nloa
ded
from
http
s://j
ourn
als.
asm
.org
/jour
nal/a
em o
n 25
Jan
uary
202
2 by
46.
71.2
07.1
95.

solved Mn(II) concentration (�12 �M) was found at the bottomof C6204, about 0.7 m below the Hanford-Ringold interface. Inthe deeper strata observed in C6209, Mn(II) concentrationsranged from 1 to 4 �M. Concentrations of dissolved Fe(II) variedbetween 1 and 2.4 �M between 20 and 37 m.
Dissolved H2 concentrations ranged from 0.7 nM to 1.6 nM inthe Hanford formation. These values were consistent with thosereported for anaerobic sediments where H2 concentrations werein steady state with sulfate reduction as the dominant terminalelectron accepting process (30). Dissolved CH4 was detectable atthe top of the Ringold formation and increased with depth.Deeper in the Ringold formation, both dissolved gases increasedin concentration to a maximum of 178 nM for H2 and 82 �M forCH4 (Fig. 1).
Chemical analysis for the sediment samples showed that in theHanford formation sediments, 41% of total Fe was present asFe(II). Organic carbon contents were low in these subsurface sed-iments, with 0.09%, 0.08%, and 0.09% of sediment weight in theHanford formation, oxic Ringold formation, and upper reducedRingold formation, respectively.
Vertical distribution of total and cultivatable biomass. Bio-mass analyzed as PLFA was generally about 13-fold higher in theHanford formation (9.5 to 17.4 m) than in the Ringold formation(below 17.7 m) (Table 2). In three Hanford formation samples,the average PLFA concentration was 519 � 396 pmol g�1 of sed-iment and the concentrations ranged from 252 to 974 pmol g�1.This range is equivalent to 5.1 � 106 to 19.5 � 106 cells g�1, basedon a conversion factor of 2 � 104 cells/pmol PLFA (4). Biomass inthe Ringold sediment samples was relatively constant at 39 � 30pmol PLFA g�1 (equivalent to a range of cell abundances from0.14 to 1.98 � 106 cells g�1). The highest level (99 pmol g�1) wasdetected in the weathered basalt sample from 51.2 m.
Bacteria modify their membrane fatty acids upon encounter-ing stressful environmental conditions, and these changes havebeen used as physiological indicators (21, 31). Samples from the
upper Hanford formation had cyclopropyl/monoenoic ratios ofless than 1.0 and trans/cis ratios of about 0.1 to 0.2 (Table 3),which are close to values generally found in metabolically vigor-ous populations (21, 31). In contrast, cyclopropyl/monoenoic ra-tios of �1.0 were found only in the Ringold samples, and thesesamples also had trans/cis ratios as high as 0.66. These data sug-gested that microorganisms in the Ringold sediments were nutri-ent or energy limited. Unfortunately, low total PLFA levels (andhence no detection of the stress markers) in some Ringold samplesprevented a more comprehensive analysis of physiological stressin different geological units.
There was a 6-fold decline in cultivatable aerobes from theHanford to the Ringold sediments (Table 2). On average, aerobesrepresented 1.3% � 2.2% of total PLFA-based cell estimates. Bothfermenters and denitrifers were detected throughout the sampledprofile but showed only minor variations, about 0.32% � 0.33%and 0.41% � 0.38% of the total PLFA biomass, respectively. Cul-tivable microorganisms capable of Fe(III) and Mn(IV) reductionrepresented about 0.01% of total biomass in the Hanford forma-tion, and they were irregularly detected in the Ringold sediments.Note that despite the high dissolved oxygen concentrations inHanford formation groundwater, sulfate reducers were detectedin Hanford sediment samples. The MPN counts of sulfate reduc-ers were 2-fold lower in the Hanford than in the Ringold forma-tion (0.9 � 103 versus 1.8 � 103 cells g�1).
Relative abundances of functional bacterial groups. The rel-ative abundance of both phylogenetic and functional genes wasdetermined by normalizing to the absolute copy numbers of totalbacterial plus archaeal 16S rRNA genes to factor out the 100-folddifferences in total biomass between samples (Fig. 2). The nosZgene, encoding nitrous oxide reductase that catalyzes the reduc-tion of N2O to N2 in microbial denitrification, was quite prevalent,with an abundance of 5 to 17% relative to total 16S gene copynumbers below 18.3 m and 0.5 to 4.7% in samples above 18.1 m(Fig. 2A). Sulfate-reducing potential was assayed by analysis of
TABLE 2 Total prokaryotic phospholipid fatty acids and estimated cell abundances, as well as most probable numbers of various types ofmicroorganisms in the Hanford Site subsurface
Depth(m)
Total PLFAa
(pmol/g soil)No. of cells/gsoilb
MPN counts (cells per g soil)
Aerobes Fermenters Denitrifiers Fe reducers Mn reducers Sulfate reducers
9.5 974 1.95E�07 4.07E�05 1.67E�04 2.39E�03 2.63E�02 1.39E�03 8.61E�029.6 252 5.05E�06 3.39E�04 1.47E�03 2.80E�03 6.62E�02 6.62E�02 3.39E�029.8 331 6.61E�06 9.23E�04 1.40E�03 2.98E�03 6.85E�02 4.77E�02 6.85E�0217.4 804 1.61E�07 8.47E�03 3.00E�03 1.77E�03 NDc ND 1.77E�0317.7 52 1.03E�06 ND 6.03E�03 7.87E�03 ND ND 3.85E�0318.0 12 2.43E�05 1.92E�04 ND ND ND ND 2.41E�0318.1 24 4.89E�05 ND ND ND ND ND ND18.3 35 6.93E�05 4.60E�03 4.60E�03 2.67E�03 1.71E�03 ND 1.71E�0318.9 20 4.02E�05 1.73E�03 1.95E�02 1.73E�03 ND ND 1.73E�0330.8 38 7.52E�05 ND 3.35E�03 4.42E�03 ND ND 1.64E�0334.2 7 1.36E�05 ND 1.69E�03 1.69E�03 ND ND ND38.4 56 1.12E�06 1.95E�05 2.46E�03 3.98E�03 9.32E�02 ND 9.32E�0239.0 12 2.41E�05 ND 1.62E�03 2.79E�03 ND ND ND39.3 23 4.61E�05 ND 2.76E�03 3.48E�03 ND ND 2.76E�0347.3 29 5.87E�05 1.80E�03 1.15E�03 1.80E�03 ND ND ND51.2 99 1.98E�06 7.05E�03 1.20E�04 3.76E�03 8.46E�02 5.41E�02 8.46E�0251.5 94 1.89E�06 1.37E�03 3.71E�03 1.79E�04 ND ND 6.57E�02a PLFA, prokaryotic phospholipid fatty acids.b Based on a conversion factor of 2 � 104 cells/pmol PLFA (4).c ND, not detectable.
Hanford Site Subsurface Biomass and Anaerobic Respiration
February 2012 Volume 78 Number 3 aem.asm.org 763
Dow
nloa
ded
from
http
s://j
ourn
als.
asm
.org
/jour
nal/a
em o
n 25
Jan
uary
202
2 by
46.
71.2
07.1
95.

dsrA gene copies and ranged from below the detection limit (2 �103 gene copies g�1) to 7% of total 16S rRNA genes in Ringoldsediments; dsrA gene copies were near the detection limit in Han-ford sediments (Fig. 2B). For the detection of metal-reducing bac-teria, no functional gene primers are available, so phylogeneticprimers for several taxa known to be important in this processwere applied. Detection of Geobacteraceae, Anaeromyxobacterspp., or Shewanella spp. was sporadic, and their abundance wasgenerally below 0.5% of total 16S gene copy numbers, with theexception that Geobacteraceae accounted for 4.2% and 1.7% at thedepths of 17.4 m and 51.2 m, respectively (Fig. 2C).
Phylogenetic analysis of nosZ, dsrA, and Shewanella 16SrRNA genes. Because denitrifying bacteria were prevalentthroughout the Hanford 300 Area subsurface sediments, we com-pared nosZ gene sequence diversity in clone libraries from twodepths: 9.5 m (Hanford formation) and 18.3 m (Ringold forma-tion). When aligned on a nosZ phylogenetic tree, three clusterswere found (Fig. 3); there was one sequence (HF-B5) with only 50%sequence similarity to any in the current nosZ gene database. Themost abundant sequences in libraries from both the Hanford andRingold samples (48% of total sequences) were closely affiliated(�97% similarity) with nosZ genes from the alphaproteobacteriumOchrobactrum anthropi. Eighteen percent of sequences (all from theRingold formation sample) had the closest association (90% similar-
TABLE 3 PLFA biomarkers of microbial physiological stress at different depths, measured in terms of the cyclopropyl/monoenoic precursor ratiosand the trans/cis PLFA ratios
Geological unitsDepth(m)
Cyclopropyl/monoenoic precursor ratio Trans/cis PLFA ratio
cy17:0/16:1w7c cy19:0/18:1w7c 16:1w7t/16:1w7c 18:1w7t/18:1w7c
Hanford formation 9.5 0.52 0.72 0.11 0.129.6 0.51 0.68 0.22 09.8 0.66 0.85 0.1 017.4 23.81 10.53 0.59
Ringold formation 17.7 0.2218.1 1.75 0.2730.8 1.47 0.37 0.3538.4 0.4947.3 0.66
Weathered basalt 51.2 1.34 0.6851.5 0.19 0.19
FIG 2 Relative abundances of phylogenetic and functional microbial groups,normalized to total Bacteria and Archaea 16S rRNA gene copy numbers. Upperand lower dotted lines represent the Hanford-Ringold contact and Ringoldoxic-anoxic interface, respectively.
FIG 3 Neighbor-joining tree of nosZ genes amplified from DNA samples at9.5 m (circles) and 18.3 m (triangles). Bootstrap values larger than 50 areshown on each branch. Values in parentheses indicate the number of identicalsequences in the libraries.
Lin et al.
764 aem.asm.org Applied and Environmental Microbiology
Dow
nloa
ded
from
http
s://j
ourn
als.
asm
.org
/jour
nal/a
em o
n 25
Jan
uary
202
2 by
46.
71.2
07.1
95.

ity) with nosZ genes of Achromobacter xylosoxidans. About 12% oftotal sequences grouped with nosZ genes of Pseudomonas grimontii.
The relative abundance of dsrA gene copy numbers underwenta dramatic change near the Ringold oxidized-reduced interface at18.3 m, suggesting a potential shift in the community compositionof sulfate-reducing bacteria. To compare diversity between oxi-dized and reduced sediments that have similar textural character-istics, dsrA gene clone libraries were constructed from oxic (17.4m) and reduced (18.3 m) Ringold sediments. Two sequence clus-ters were identified (Fig. 4): one related (91% similarity) to Des-ulfotomaculum sp. and the other most closely affiliated (89% sim-ilarity) with an uncultured aquifer clone. Both the oxidized andreduced strata contained sequences affiliated with Desulfotomacu-lum thermosapovorans, a spore-forming, sulfate-reducing bacte-rium belonging to the order Clostridiales. Sequences affiliated withleachate-polluted aquifer clones were found only in the reducedRingold sample.
We confirmed that the amplicons from Shewanella-specificprimers were authentic by constructing a clone library after mix-ing PCR products from depths of 9.5 m, 18.9 m, and 47.3 m.Forty-one of 46 nonchimeric sequences of Shewanella had morethan 99% sequence similarity to and affiliated with the cultivatedstrain Shewanella oneidensis MR-1. The other 5 sequences werefound to represent another clade, a Pseudomonas sp. (data notshown).
DISCUSSIONBiomass distribution within the Hanford Site subsurface. Thehighest biomass levels were found in the highly transmissive Han-ford formation. Our finding is consistent with data from otherterrestrial subsurface environments, where microbial biomass andactivity generally decline as a function of depth and then remainrelatively constant over a range of deeper sediments (27). Thesubsurface in the Hanford 300 Area contains multiple geologicalunits and, also, physical and chemical transition zones, such as the
Hanford-Ringold contact and the oxidized-reduced interface inthe fine-grained Ringold unit. These stratigraphic and lithologicfeatures create heterogeneity in sediment properties, such as po-rosity and texture, between geological units and could thereforeaffect microbial biomass distribution (27). The dramatic declinein biomass from the Hanford to the Ringold formation was notcorrelated to organic carbon contents, which were similar in bothstrata. The high transmissivity in the Hanford aquifer comparedto that in the fine-grained Ringold sediments likely provides amuch greater advective flux of limiting nutrients to microbes,which could then theoretically sustain higher biomass content andlevels of metabolic activities. The analysis of physiological stressmarkers in PLFA profiles is also consistent with the idea that mi-crobes in the Ringold formation encounter lower nutrient fluxesthan those in the Hanford formation.
Geochemical gradients and their relationship to microbialdistributions. Groundwater chemical profiles indicated a sharptransition in redox conditions below the Hanford-Ringold forma-tion contact. Oxygen and nitrate became depleted across the con-tact and within the fine-grained Ringold subunit, whereas reducedproducts of anaerobic respiration [nitrite, Fe(II), Mn(II), sulfide,and methane] exhibited the opposite trend, increasing with depth.This redox zonation likely reflects diverse microbial activities op-erating in the 300A subsurface that are also vertically stratified andresponsible for driving the reactions that contribute to such strat-ification. We employed culture-independent and culture-dependent techniques to assay the potential for anaerobic respi-ratory processes, although we understand the difficulty in directlylinking gene copy number and enrichment experiments to in situmicrobial physiology and function (50).
The qPCR and MPN analyses indicated a broadly distributedpotential for nitrate reduction throughout the subsurface strata.The geochemical profiles, however, suggest that microbial nitratereduction would be restricted to the strata just below the Hanford-Ringold contact, where O2 becomes depleted and nitrate is detect-able. The denitrifying microbial populations in the 300 Area sub-surface sediment were dominated by Ochrobactrum anthropi andAchromobacter sp., based on nosZ gene libraries. There are culti-vated strains of both species that are denitrifiers: these taxa have abroad habitat distribution that includes the soil rhizoplane andhumans (7, 35). Achromobacter sp. has been detected in otheruranium-contaminated sites, which also harbored other denitri-fying bacterial genera, such as Acidovorax, Acinetobacter, Alcali-genes, Hyphomicrobium, Ralstonia, Sphingomonas, etc. (1, 55). Weonly amplified nosZ genes in this study and cannot exclude thepossibility that other N reductases and taxa are important com-ponents (17). The high abundance of O. anthropi in denitrifyingpopulations has not been reported in other subsurface habitats.However, there is very poor understanding of how mineralogicand geochemical factors select for specific functional microbes atdifferent sites. For example, the Hanford Ochrobactrum nosZclones had 97% similarity with Ochrobactrum anthropi YD50.2, anovel denitrifying bacterium found to tolerate relatively high lev-els of reactive nitrogen species (NO and NO2
�) (13). Although thebulk groundwater concentrations of nitrite were much lower thanthose reported by Doi et al. in a study of reactive nitrogen speciestolerance (13), the physically heterogeneous subsurface sedimentsmay structure the unique denitrifying populations in the HanfordSite subsurface. If the Hanford Ochrobactrum population pos-sesses the high nitrite tolerance of O. anthropi YD50.2, this repre-
FIG 4 Phylogenetic affiliations of dsrA gene amplicons from oxic (17.4 m,circles) and reduced (18.3 m, triangles) Ringold sediments. Numbers in pa-rentheses represent the total number of sequences with more than 97% simi-larity in the constructed library. Bootstrap values larger than 50 are shown oneach branch.
Hanford Site Subsurface Biomass and Anaerobic Respiration
February 2012 Volume 78 Number 3 aem.asm.org 765
Dow
nloa
ded
from
http
s://j
ourn
als.
asm
.org
/jour
nal/a
em o
n 25
Jan
uary
202
2 by
46.
71.2
07.1
95.

sents a strategy for selective cultivation of this numerically abun-dant subsurface microbe.
Overall, the relative abundance of metal- and sulfate-respiringbacteria was quite low in the 300A subsurface sediments. The lowpopulation levels suggested that the rates at which these processeswere occurring were relatively low and that this could be a conse-quence of limited availability of appropriate electron donorsand/or acceptors. However, genes or taxa associated with theseprocesses were detected, and both field and laboratory studieshave demonstrated that the abundances of metal and sulfate re-ducers can increase significantly when appropriate environmentaland nutritional conditions are imposed (2, 8, 39, 48, 51).
It is noteworthy that functional groups of anaerobic respirerswere detected (at low abundance) by molecular and cultivationapproaches in several samples from the oxic Hanford formation.These sediments are physically and mineralogically heteroge-neous and could contain microsites where advection forces arelow (29) and hot spots (33) where electron donors are relativelyconcentrated. This circumstance would generate microenviron-ments of O2 depletion where anaerobic respiration could occur.The high proportion of Fe(II) within the total Fe content of Han-ford formation sediments demonstrates that zones depleted in O2
are present and suggests that microbial reduction of Fe(III) mightoccur in the oxic Hanford formation sediment.
The maxima in abundance of dsrA genes and Geobactereaceae16S rRNA genes below the Hanford-Ringold contact were consis-tent with the geochemical profiles, which indicated steep redoxgradients and peaks in the metabolic products of Fe(III) and sul-fate reduction. The zonation of oxidized and reduced chemicalspecies is commonly encountered in saturated sediments in fresh-water and marine habitats (5), where these processes are driven bythe sedimentation of organic matter from the overlying water. Thenature of the driving forces for biogeochemical reduction wereless clear in this environment and will require extensive furtherstudy to adequately define. The concentration of dissolved organiccarbon in groundwater has been assayed to be �25 �mol liter�1,and sedimentary organic C ranged from �42 �mol/g to 67�mol/g in Hanford and upper Ringold sediments. Future workwill consider the capacity for inorganic electron donors in drivingbiogeochemical reductions in the subsurface (9, 37).
The reason for the increase in sulfate concentration with depthis unclear but is likely due to a combination of oxidation of ironsulfide and leaching of sulfate from the reduced region of thefine-grained Ringold formation. Similar findings have been ob-served in other aquifers (9, 42), where confining beds containedhigher concentrations of sulfate than the aquifer, as the developedconcentration gradient allowed sulfate to diffuse. Pyritic S wasdetectable in reduced Ringold sediment from well C6209 cores butundetectable in the overlying oxidized Ringold material (unpub-lished observations). The decrease in dissolved O2 and nitrateacross the fine-grained Ringold could be due, at least in part, tomicrobial oxidation of sediment-associated reduced S and/or Fe.Consistent with this hypothesis is the maintenance of a lithoau-totrophic Fe(II)-oxidizing, nitrate-reducing enrichment cultureby E. Shelobolina (personal communication), in which Fe in re-duced Ringold sediments is the major available electron donor.
Gas concentration profiles suggested an upward flux of H2 andCH4 from the deeper aquifer, and CH4 was detectable from thebottom of the screened interval in well C6209 to the base of theHanford formation. This observation suggested the existence of
hydrogen-consuming and CH4-producing microbial populationsin the reduced Ringold formation (10, 45) and the potential formethanotrophy in both the oxic and anoxic Hanford subsurface.
The vertical arrangement of geological units and their distinctsediment textures make it likely that field-scale features (Hanford-Ringold contact, Ringold oxic-reduced interface, and silt barriers)in the Hanford Site subsurface exert a significant control on thetransfer and flux of energy and material, hence limiting microbialbiomass distribution through groundwater flow and river waterinfiltration. Additional system complexities that may impact tem-poral and spatial dynamics of the microbial community in theHanford unconfined aquifer arise from the fluctuating hydrolog-ical gradient and the flux of reduced inorganic energy sources(e.g., H2 and CH4) from deeper strata. The facts that H2 and CH4
are detectable in the Hanford formation and that their concentra-tions are quite high in the Ringold formation suggest organic mat-ter fermentation combined with electron acceptor limitation.Therefore, it would be interesting to determine the source(s) of H2
and CH4 in the system and the extent to which the upward fluxesof fermentation and methanogenesis products support microbialbiomass and activity above the aquitard.
ACKNOWLEDGMENTS
We thank J. H. Lee, N. Adams, M. Marshall, S. Fansler, and S. B. Reed forassistance with the sampling and DNA extraction and T. Peretyazhko forsharing organic carbon data. K. Reardon, O. Geydebrekht, and A. Plymaleprovided bacterial and archaeal strains.
This research was supported by the U.S. Department of Energy(DOE), Office of Biological and Environmental Research (BER), as part ofSubsurface Biogeochemistry Research Program’s Scientific Focus Area(SFA) and Integrated Field-Scale Research Challenge (IFRC) at the PacificNorthwest National Laboratory (PNNL). PNNL is operated for DOE byBattelle under contract DE-AC06-76RLO 1830.
REFERENCES1. Akob DM, Mills HJ, Kostka JE. 2007. Metabolically active microbial
communities in uranium-contaminated subsurface sediments. FEMS Mi-crobiol. Ecol. 59:95–107.
2. Anderson RT, et al. 2003. Stimulating the in situ activity of Geobacterspecies to remove uranium from the groundwater of a uranium-contaminated aquifer. Appl. Environ. Microbiol. 69:5884 –5891.
3. Atlas RM. 1993. Handbook of microbiological media. CRC Press, BocaRaton, FL.
4. Balkwill DL, Leach FR, Wilson JT, McNabb JF, White DC. 1988.Equivalence of microbial biomass measures based on membrane lipid andcell-wall components, adenosine triphosphate, and direct counts in sub-surface aquifer sediments. Microb. Ecol. 16:73– 84.
5. Berner RA. 1981. A new geochemical classification of sedimentary envi-ronments. J. Sediment. Petrol. 51:359 –365.
6. Bjornstad BN, Horner JA, Vermeul VR, Lanigan DC, Thorne PD. 2009.Borehole completion and conceptual hydrogeologic model for the IFRCWell Field, 300 Area, Hanford Site.PNNL-18340. Pacific Northwest Na-tional Laboratory, Richland, WA. http://ifchanford.pnl.gov/pdfs/18340.pdf.
7. Busse H-J, Stolz A. 2006. Achromobacter, Alcaligenes and related genera,p 675–700. In Dworkin M, Falkow S, Rosenberg E, Schleifer K-H, andStackebrandt E (ed), Prokaryotes. Springer Science�Business Media,New York, NY.
8. Cardenas E, et al. 2008. Microbial communities in contaminated sedi-ments, associated with bioremediation of uranium to submicromolar lev-els. Appl. Environ. Microbiol. 74:3718 –3729.
9. Chapelle FH, Lovley DR. 1990. Rates of microbial metabolism in deepcoastal plain aquifers. Appl. Environ. Microbiol. 56:1865–1874.
10. Chapelle FH, et al. 2002. A hydrogen-based subsurface microbial com-munity dominated by methanogens. Nature 415:312–315.
11. Christensen JN, Dresel PE, Conrad ME, Maher K, Depaolo DJ. 2004.
Lin et al.
766 aem.asm.org Applied and Environmental Microbiology
Dow
nloa
ded
from
http
s://j
ourn
als.
asm
.org
/jour
nal/a
em o
n 25
Jan
uary
202
2 by
46.
71.2
07.1
95.

Identifying the sources of subsurface contamination at the Hanford Site inWashington using high-precision uranium isotopic measurements. Envi-ron. Sci. Technol. 38:3330 –3337.
12. DeSantis TZ, et al. 2007. High-density universal 16S rRNA microarrayanalysis reveals broader diversity than typical clone library when samplingthe environment. Microb. Ecol. 53:371–383.
13. Doi Y, Takaya N, Takizawa N. 2009. Novel denitrifying bacteriumOchrobactrum anthropi YD50.2 tolerates high levels of reactive nitrogenoxides. Appl. Environ. Microbiol. 75:5186 –5194.
14. Faybishenko B, et al. 2008. In situ long-term reductive bioimmobiliza-tion of Cr(VI) in groundwater using hydrogen release compound. Envi-ron. Sci. Technol. 42:8478 – 8485.
15. Fredrickson JK, et al. 1995. Microbial community structure and biogeo-chemistry of miocene subsurface sediments—implications for long-termmicrobial survival. Mol. Ecol. 4:619 – 626.
16. Fredrickson JK, et al. 2004. Geomicrobiology of high-level nuclear waste-contaminated vadose sediments at the Hanford Site, Washington State.Appl. Environ. Microbiol. 70:4230 – 4241.
17. Green SJ, et al. 2010. Denitrifying bacteria isolated from terrestrial sub-surface sediments exposed to mixed-waste contamination. Appl. Environ.Microbiol. 76:3244 –3254.
18. Guckert JB, Antworth CP, Nichols PD, White DC. 1985. Phospholipid,ester-linked fatty-acid profiles as reproducible assays for changes in pro-karyotic community structure of estuarine sediments. FEMS Microbiol.Ecol. 31:147–158.
19. Hazen TC, Faybishenko B, Long PE. 2006. Annual report for project47285 field-integrated studies of long-term sustainability of chromiumbioreduction at Hanford 100H Site, vol PNNLSA-52844.Pacific North-west National Laboratory, Richland, WA.
20. He JZ, Xu ZH, Hughes J. 2005. Pre-lysis washing improves DNA extrac-tion from a forest soil. Soil Biol. Biochem. 37:2337–2341.
21. Hedrick DB, Peacock A, White DC. 2005. Interpretation of fatty acidprofiles of soil microorganisms, p 251–259. In R. Margesin and F. Schinner(ed), Soil biology, vol 5. Springer-Verlag, Berlin, Germany.
22. Henry S, Bru D, Stres B, Hallet S, Philippot L. 2006. Quantitativedetection of the nosZ gene, encoding nitrous oxide reductase, and com-parison of the abundances of 16S rRNA, narG, nirK, and nosZ genes insoils. Appl. Environ. Microbiol. 72:5181–5189.
23. Himmelheber DW, Thomas SH, Loffler FE, Taillefert M, Hughes JB.2009. Microbial colonization of an in situ sediment cap and correlation tostratified redox zones. Environ. Sci. Technol. 43:66 –74.
24. Holmes DE, Finneran KT, O’Neil RA, Lovley DR. 2002. Enrichment ofmembers of the family Geobacteraceae associated with stimulation of dis-similatory metal reduction in uranium-contaminated aquifer sediments.Appl. Environ. Microbiol. 68:2300 –2306.
25. Kieft TL, et al. 1995. Microbiological comparisons within and acrosscontiguous lacustrine, paleosol, and fluvial subsurface sediments. Appl.Environ. Microbiol. 61:749 –757.
26. Kondo R, Nedwell DB, Purdy KJ, Silva SD. 2004. Detection and enu-meration of sulphate-reducing bacteria in estuarine sediments by compet-itive PCR. Geomicrobiol. J. 21:145–157.
27. Lehman RM. 2007. Microbial distributions and their potential control-ling factors in terrestrial subsurface environments, p 135–178. In R. B.Franklin and A. L. Mills (ed), The spatial distribution of microbes in theenvironment. Springer, Dordrecht, Netherlands.
28. Lin X, Kennedy D, Fredrickson J, Bjornstad B, Konopka A. 2011.Vertical stratification of subsurface microbial community compositionacross geological formations at the Hanford Site. Environ. Microbiol.[Epub ahead of print.] doi:10.1111/j.1462-2920.2011.02659.x.
29. Liu CX, Zachara JM, Yantasee W, Majors PD, McKinley JP. 2006.Microscopic reactive diffusion of uranium in the contaminated sedimentsat Hanford, United States. Water Resour. Res. 42:W12420.
30. Lovley DR, Goodwin S. 1988. Hydrogen concentrations as an indicator ofthe predominant terminal electron-accepting reactions in aquatic sedi-ments. Geochim. Cosmochim. Acta 52:2993–3003.
31. Ludvigsen L, Albrechtsen HJ, Ringelberg DB, Ekelund F, ChristensenTH. 1999. Distribution and composition of microbial populations inlandfill leachate contaminated aquifer (Grindsted, Denmark). Microb.Ecol. 37:197–207.
32. Ludwig W, et al. 2004. ARB: a software environment for sequence data.Nucleic Acids Res. 32:1363–1371.
33. McClain ME, et al. 2003. Biogeochemical hot spots and hot moments atthe interface of terrestrial and aquatic ecosystems. Ecosystems 6:301–312.
34. McKinley JP, et al. 1997. Biogeochemistry of anaerobic lacustrine andpaleosol sediments within an aerobic unconfined aquifer. Geomicrobiol.J. 14:23–39.
35. Moreno E, Moriyon I. 2006. The genus Brucella, p 315– 455. In DworkinM, Falkow S, Rosenberg E, Schleifer K-H, Stackebrandt E (ed), Pro-karyotes. Springer Science�Business Media, New York, NY.
36. Moser DP, et al. 2003. Biogeochemical processes and microbial charac-teristics across groundwater-surface water boundaries of the HanfordReach of the Columbia River. Environ. Sci. Technol. 37:5127–5134.
37. Murphy EM, Schramke JA. 1998. Estimation of microbial respirationrates in groundwater by geochemical modeling constrained with stableisotopes. Geochim. Cosmochim. Acta 62:3395–3406.
38. Nadkarni MA, Martin FE, Jacques NA, Hunter N. 2002. Determinationof bacterial load by real-time PCR using a broad-range (universal) probeand primers set. Microbiology 148(Pt 1):257–266.
39. North NN, et al. 2004. Change in bacterial community structure duringin situ biostimulation of subsurface sediment cocontaminated with ura-nium and nitrate. Appl. Environ. Microbiol. 70:4911– 4920.
40. Peacock AD, et al. 2004. Utilization of microbial biofilms as monitors ofbioremediation. Microb. Ecol. 47:284 –292.
41. Peterson RE, Connelly MP. 2001. Zone of interaction between HanfordSite groundwater and adjacent Columbia River PNNL-13674.PacificNorthwest National Laboratory, Richland, WA.
42. Pucci AA, Owens JP. 1989. Geochemical variations in a core of hydro-geologic units near Freehold, New Jersey. Ground Water 27:802– 812.
43. Schippers A, Neretin LN. 2006. Quantification of microbial communitiesin near-surface and deeply buried marine sediments on the Peru conti-nental margin using real-time PCR. Environ. Microbiol. 8:1251–1260.
44. Spalding BP, Watson DB. 2008. Passive sampling and analyses of com-mon dissolved fixed gases in groundwater. Environ. Sci. Technol. 42:3766 –3772.
45. Stevens TO, McKinley JP. 1995. Lithoautotrophic microbial ecosystemsin deep basalt aquifers. Science 270:450 – 454.
46. Stookey LL. 1970. Ferrozine—a new spectrophotometric reagent for iron.Anal. Chem. 42:779 –781.
47. Takai K, Horikoshi K. 2000. Rapid detection and quantification of mem-bers of the archaeal community by quantitative PCR using fluorogenicprobes. Appl. Environ. Microbiol. 66:5066 –5072.
48. Tang YJ, Carpenter S, Deming J, Krieger-Brockett B. 2005. Controlledrelease of nitrate and sulfate to enhance anaerobic bioremediation ofphenanthrene in marine sediments. Environ. Sci. Technol. 39:3368 –3373.
49. Todorova SG, Costello AM. 2006. Design of Shewanella-specific 16SrRNA primers and application to analysis of Shewanella in a minero-trophic wetland. Environ. Microbiol. 8:426 – 432.
50. Torsvik V, Ovreas L. 2002. Microbial diversity and function in soil: fromgenes to ecosystems. Curr. Opin. Microbiol. 5:240 –245.
51. Vrionis HA, et al. 2005. Microbiological and geochemical heterogeneityin an in situ uranium bioremediation field site. Appl. Environ. Microbiol.71:6308 – 6318.
52. Wagner M, Roger AJ, Flax JL, Brusseau GA, Stahl DA. 1998. Phylogenyof dissimilatory sulfite reductases supports an early origin of sulfate respi-ration. J. Bacteriol. 180:2975–2982.
53. Weisbrod N, Ronen D, Nativ R. 1996. New method for samplinggroundwater colloids under natural gradient flow conditions. Environ.Sci. Technol. 30:3094 –3101.
54. White DC, Bobbie RJ, Heron JS, King JD, Morrison SJ. 1979. Biochem-ical measurements of microbial mass and activity from environmentalsamples. In Costerton JW and Colwell RR (ed), Native aquatic bacteria:enumeration, activity and ecology, vol ASTM STP 695. American Societyfor Testing and Materials, Philadelphia, PA.
55. Yan TF, et al. 2003. Molecular diversity and characterization of nitritereductase gene fragments (nirK and nirS) from nitrate- and uranium-contaminated groundwater. Environ. Microbiol. 5:13–24.
Hanford Site Subsurface Biomass and Anaerobic Respiration
February 2012 Volume 78 Number 3 aem.asm.org 767
Dow
nloa
ded
from
http
s://j
ourn
als.
asm
.org
/jour
nal/a
em o
n 25
Jan
uary
202
2 by
46.
71.2
07.1
95.