Embed Size (px)
Citation preview

1
Crystal Engineering Manufacturing Facility Analysis
A Senior Project submitted to
the Faculty of California Polytechnic State University,
San Luis Obispo
In Partial Fulfillment
of the Requirements for the Degree of
Bachelor of Science in Industrial Engineering
by
Sthefano Alvarado Maximiliano Cortes
Eric Kornrumpf
March 2017

2
Table of Contents
Executive Summary 5
I. Introduction 6
II. Background 7
Literature Review 7
What is facilities design? 7
Systematic Layout Planning 9
Redundancy In Facility Design 10
Cellular Manufacturing 10
Lean Manufacturing 11
Kanban 12
Algorithms 12
III. Design 13
Requirements 17
Constraints 17
Approach 17
Product Line Flows 17
Defining Departments 18
Defining Relationships 20
Cellular Manufacturing 21
Space Savings 22
IV. Methods 23
Project Management 23
Flowcharts and Process Flow Diagrams 24
Spaghetti 24

3
Analytic Hierarchy Process (AHP) 25
V. Results and Discussion 26
Design 1 26
Design 2 27
Design 3 28
Design 4 29
Analytic Hierarchy Process Results 30
Economic Analysis 31
VI. Conclusions 36
References 39
Appendix 41
List of Figures
Figure 1: Entire Crystal Engineering facility 14 Figure 2: Warehouse 14 Figure 3: Auxiliary Production Floor 15 Figure 4: Primary Production Floor 16 Figure 5: XP2i Flow Chart 18 Figure 6: Relationship Diagram 20 Figure 7: Space Relationship Diagram 21 Figure 8: Cellular Manufacturing Matrix 22 Figure 9: Gantt Chart 23 Figure 10: List of Tasks for Gantt Chart 24 Figure 11: Design 1 (Cellular Manufacturing) 26 Figure 12: Design 2 (SLP) 27 Figure 13: Design 3 (SLP) 28 Figure 14: Design 4 (Space Savings) 29 Figure 15: AHP Weight Calculations 30 Figure 16: Final AHP Calculation 31

4
List of Tables
Table 1: Design 1 Summary Data 27
Table 2: Design 2 Summary Data 28
Table 3: Design 3 Summary Data 29
Table 4: Design 4 Summary Data 30
Table 5: Revenue per Square Foot by Product 32
Table 6: Design 1 Cost Breakdown 33
Table 7: Design 2 Cost Breakdown 33
Table 8: Design 3 Cost Breakdown 34
Table 9: Design 4 Cost Breakdown 34
Table 10: Economic Analysis Summary 35

5
Executive Summary
This report will encompass a two-quarter long senior project effort to provide a recommendation for the client, Crystal Engineering. Crystal Engineering is currently in the process of introducing three new products, one now and two within the next six months. However, their existing lines already occupy the available production space and as a result, they are unable to determine how to effectively incorporate new production lines within the facility. Therefore, the main objectives of this project were to deliver several facility redesign layouts backed by a holistic justification for each. The formulation of the facility redesign layouts incorporated several industrial engineering tools and methodologies which included systematic layout planning, cellular manufacturing, and a customized design focused on saving space. These methodologies generated four facility redesigns where systematic layout planning was incorporated into two of them (Design 2, Design 3); and cellular manufacturing and space savings (Design 1 and Design 4 respectively) each incorporated just one. In order to choose the most optimal design, the industrial engineering tool of analytical hierarchy process (AHP) was used where the factors and individual weights of each were determined with the input of several key stakeholders at Crystal Engineering. The design that ended up being chosen with AHP was Design 4 which incorporated the space savings methodology (see Design section). Besides AHP, which included four key factors (flow, available space, cost, effort of implementation; see Methods section for greater detail) defined with the help of client, an economic analysis based on a revenue per square foot metric was also used to further justify Design 4. One of the most significant factors in the justification of the implementation of Design 4 was found in the economic analysis. The results determined that the potential increase for annual profit based on the projected addition of three new product lines was valued at $2,627,786. Furthermore, the other three layouts would not be able to accommodate the three new lines if they were to be the projected size, leaving Design 4 the only design to fully accommodate the clients requirements due to its aggressive focus on space savings for future product line expansion.

6
I. Introduction
This report will cover a project with Crystal Engineering, a manufacturing company based in San Luis Obispo. They specialize in manufacturing pressure sensors and other calibration equipment products. They currently produce seven different products in their facility for revenue. Their production strategy is split between assemble-to-order and make-to-stock.
Crystal Engineering plans to introduce several new product lines within the next year; moreover, they are currently in the process of incorporating a new product into their production process within the next two months. They are looking to add another two products within the next twelve months. Due to the upcoming expansion of their product lines, they are uncertain if they will have enough space to accommodate for the expansion effectively. They are also have concerns if all of their current product lines are profitable enough to keep due to their space constraints; therefore, they are also looking for a revenue per square foot analysis (see A1) of each individual product line. For this project, there are several objectives that were identified with the client. They are as follows:
● A revenue per square foot metric calculation of all of their products in current production.
● Thorough analysis incorporating several lean process improvement and facility design tools including process flow diagrams,spaghetti diagrams, systematic layout planning, cellular manufacturing, etc.
● Several facility redesign options for future expansion ○ This encompasses the entire facility including production and inventory
storage rooms
The approach to solving this problem will begin with understanding the production process and strategies through mapping out the manufacturing facility on Microsoft Visio as well as developing process flows for each product currently in production. This will help encompass a holistic understanding of the client’s business.
The first task after laying down a foundation of understanding the business will be to calculate the revenue per square foot metric that the client has requested (See A1). From there, the focus of the second half of the project timeline will be on incorporating industrial engineering tools to provide analytical evaluations for justifying recommendations for a facility redesign, or alternate solutions as appropriate.

7
II. Background Crystal Engineering currently produces seven product lines; XP2i, Nvision, 33 series, SPT, CPF & Pump, M1, and 40 series. They are adding two additional product lines within the next months. The two product lines are ACT and DCT. Since revenue per square foot (see A1) is an important metric to Crystal Engineering, the focus of this project will be on the product lines that generate the most revenue from their forecasts. There are several processes used to produce these products. Each products’ raw materials are stocked in the main assembly room on a series of racks. Their products are a mixture of assemble-to-order and make-to-stock. The XP2i is one of the only products that uses a kanban system for sub-assemblies. There are bins of different sub-assembly part numbers that are filled. If the operators are not working on customer orders, they will fill kanban bins if the bins are empty. The general process for producing each product involves several steps. An order is generated by the production scheduler, and an operator is assigned to that order. The operator will gather raw materials needed by collecting them from the appropriate rack in the assembly room. The operator completes assembly operations at their workstation and after finishing places the products in bins that are on racks next to the lab rooms. The lab rooms contain calibration machinery that usually takes about one day of processing. After the processing is completed in the lab, the products are sent to final inspection and packaged. After packaging is completed, they are either stored in racks as finished goods, or they will be sent out the door almost immediately (if assemble-to-order). Not all products follow this exact process, but these are the general steps in the production of most of their products. Literature Review The literature review will include the following topics related to this project: facilities design, systematic layout planning, and lean manufacturing. What is facilities design? Facilities planning and design involves several components. Facilities planning and design does not necessarily only apply to manufacturing facilities. Nowadays, it involves warehouse, retail stores, hospitals, and other service organizations. Facilities planning and facilities design are two separate concepts; moreover, facilities design falls under the umbrella of facilities planning
8
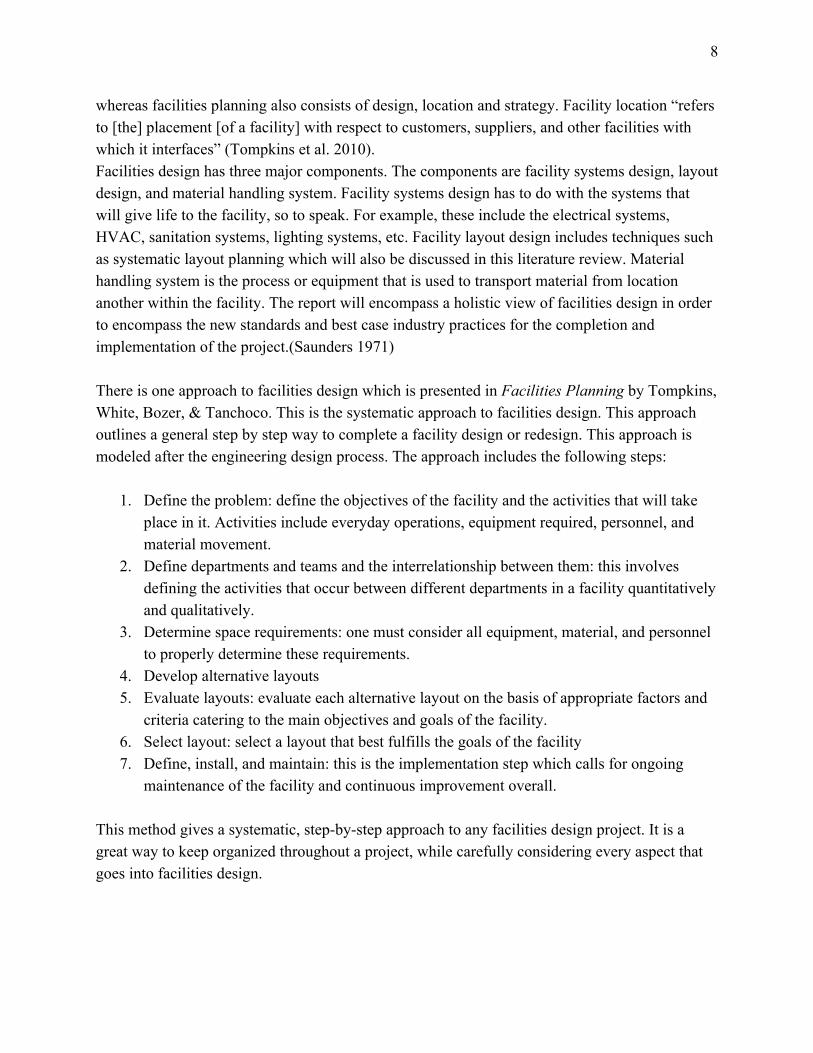
whereas facilities planning also consists of design, location and strategy. Facility location “refers to [the] placement [of a facility] with respect to customers, suppliers, and other facilities with which it interfaces” (Tompkins et al. 2010). Facilities design has three major components. The components are facility systems design, layout design, and material handling system. Facility systems design has to do with the systems that will give life to the facility, so to speak. For example, these include the electrical systems, HVAC, sanitation systems, lighting systems, etc. Facility layout design includes techniques such as systematic layout planning which will also be discussed in this literature review. Material handling system is the process or equipment that is used to transport material from location another within the facility. The report will encompass a holistic view of facilities design in order to encompass the new standards and best case industry practices for the completion and implementation of the project.(Saunders 1971) There is one approach to facilities design which is presented in Facilities Planning by Tompkins, White, Bozer, & Tanchoco. This is the systematic approach to facilities design. This approach outlines a general step by step way to complete a facility design or redesign. This approach is modeled after the engineering design process. The approach includes the following steps:
1. Define the problem: define the objectives of the facility and the activities that will take place in it. Activities include everyday operations, equipment required, personnel, and material movement.
2. Define departments and teams and the interrelationship between them: this involves defining the activities that occur between different departments in a facility quantitatively and qualitatively.
3. Determine space requirements: one must consider all equipment, material, and personnel to properly determine these requirements.
4. Develop alternative layouts 5. Evaluate layouts: evaluate each alternative layout on the basis of appropriate factors and
criteria catering to the main objectives and goals of the facility. 6. Select layout: select a layout that best fulfills the goals of the facility 7. Define, install, and maintain: this is the implementation step which calls for ongoing
maintenance of the facility and continuous improvement overall. This method gives a systematic, step-by-step approach to any facilities design project. It is a great way to keep organized throughout a project, while carefully considering every aspect that goes into facilities design.

9
Systematic Layout Planning Systematic layout planning (SLP) is a method used to generate alternative layouts. This method requires five types of input (Heragu, 1997). The inputs are the following:
● Product: types of products are being produced ● Quantity: volumes of each product ● Routing: the production process for each type ● Service: the support needed such as inspection areas ● Time: when or how long to produce each product
These types of data all feed into the systematic layout planning process. After acquiring as much of these type of data as possible, one can begin the process. Flow of materials and activity relationships are defined through charts such as from-to charts, flow between charts, and activity relationship charts. These are all used to develop a relationship diagram. “The relationship diagram positions activities spatially” (Tompkins et al. 2010). Relationship diagrams will give the interrelationship between departments and define them by importance of proximity. For example, department A may work very closely with department B so they should most likely be placed close to each other. But department A may not work very closely to department C, which means that they don’t necessarily have to be placed close to each other in the layout.
After having produced the relationship diagram, space requirements and space availability should be defined. This will give you the proper constraints and the requirements for each department. This data will feed into the development of the space relationship diagram, which is a diagram that visually shows each department in terms of space required and the interactions between them. This diagram will be a driving force in developing alternative layouts. “Finally, the conversion of a space relationship diagram into several feasible layout alternatives is not a mechanical process: intuition, judgement, and experience are important ingredients in the process” (Tompkins et al. 2010).
Once alternative layouts have been developed, they must be evaluated. These layouts can be evaluated based on criteria and factors that are important to the specific business. For example, flexibility can be a criteria because a company may introduce new products quite often. Another criteria can be the amount of material travel which would ideally be reduced to a minimum in most cases.
An article that serves as a good example of SLP is “Productivity improvement of a manufacturing facility using systematic layout planning” (Naqvi et al. 2016). This project used a simplified version of systematic layout planning. The company manufactured switch gears in a high mix low volume environment. The engineers collected data for current state analysis and

10
used tools like relationship diagrams, from-to charts, space relationship diagrams. Overall material flow efficiency was improved using SLP and lean tools. This article relates specifically to the project through the problem-solving methodology used. There were similar constraints to the senior project such as areas that needed special attention due to noise levels. Redundancy In Facility Design “Appraising redundancy in facility layout” explores adding multiples of specific machines to achieve redundancy. The main focus of this article was to determine the effect of redundancy on cost of transportation, reduced downtime due to breakdowns, and the ability to handle demand fluctuations. Utilizing an FLP model they are able to determine what machines should be duplicated and the effect of the duplication. As noted in the paper, smaller problems are much easier to handle than larger problems, as the computational time is exponential as it increases in size. The main outcome that is found is that machines are typically chosen to be duplicated when they have a large number of connections to different processes. They also noted that redundancy is most beneficial when the different work orders visit a large number of machines to reach completion. While we may not use the same FLP model they utilized in their project. It will be useful to keep their observations in mind when planning the facility layout and to bring it into consideration.
Cellular Manufacturing Cellular manufacturing is another method of designing a facility layout. Cellular manufacturing involves grouping product families and processes in order to place all equipment and workstations necessary in one “cell.” “In a cellular manufacturing system (CMS), machines are grouped into several cells, where each cell is dedicated to a particular part family and the objective is to maximize cell independence. CMS helps in reducing the material handling, work-in-process, setup time, and manufacturing lead time and improve productivity, operation control, etc” (Pattanaik & Sharma, 2008). Cellular manufacturing follows lean principles of eliminating wastes such as unnecessary transport or overprocessing. The case study in the article “Implementing lean manufacturing with cellular layout: a case study” by Pattanaik and Sharma discusses the use of similarity coefficient method to group machines together. A binary machine-part incidence matrix was formed, which is a matrix that pairs all the machines that are used for each part. This matrix was used to calculate coefficients for comparing two machines. The higher the coefficient, the higher the importance that they be close in the cellular layout. The value added, non-value added, and necessary non-value added times were also analyzed in order to create the optimum layout (Delaney, 1995).

11
Duggan suggests defining cells by types of products in his article “Facilities Design for Lean Manufacturing.” The types of cell layouts defined are the following: stable product, bulk product, small product, new product, and mixed model. Stable product deals are basic product that has low required support sources. Bulk product cells require more space due to their size. Small product cells requires less space than the normal product. New product cells are “cells that focus on the launch and debugging of new products” (Duggan, 1998). Finally, mixed model cells allow for multiple products that are no longer at capacity. Lean Manufacturing Lean manufacturing is important to consider in any type of industrial engineering project. It focuses on the elimination of waste in any process. The Toyota Production System is perhaps the best example of lean manufacturing. There are many lean manufacturing tools that can be used to assist in completing a facilities design project. Ultimately, a facilities design project should consider eliminating wastes as much as possible. These wastes are outlined in The Toyota Way: 14 Management Principles from the World’s Greatest Manufacturer (Liker, 2004). The wastes identified by Toyota include the following:
1. Overproduction - overproduction will take up space in a facility. 2. Waiting (time on hand) - e.g. waiting for parts or other materials, equipment downtime. 3. Unnecessary transport or conveyance - carrying material long distances is inefficient. 4. Overprocessing or incorrect processing - processing more than necessary is a waste. 5. Excess inventory - excess raw material, WIP, or finished goods can take up too much
space. 6. Unnecessary movement - unnecessary transport, reaching, searching or other movements. 7. Defects - defective parts, parts that require rework or repair are considered waste. 8. Unused employee creativity - employee knowledge or ideas that are not used.
Of these wastes, overproduction, unnecessary transport, over processing, excess inventory, and unnecessary movement are the most relevant to facilities design. An inefficiently designed facility will show these wastes in one way or another. For example, if two machines that are used in sequence are far from each other, this creates unnecessary transport, movement, and waiting. (Omogbai and Salonitis, 2017)
5S is also an important part of facility design. This deals more with the details of how things are arranged, especially in a workstation. The 5S’s are sort, straighten, shine, standardize, and sustain. Sort means only keeping items that are needed while disposing what is useless. Straighten means giving a place for everything that is needed. Shine simply refers to cleanliness. Standardize refers to developing “systems and procedures to maintain and monitor the first three S’s” (Liker, 2004). Sustain refers to self-discipline in maintaining the system and a culture of

12
continuous improvement. If 5S is implemented into the facility design, the facility will be more efficient overall.
Kanban A Kanban is a method of having operators control the production planning of a line through a well defined process that utilizes several principles to allow a more consistent and less chaotic production schedule. Visual signals are used to identify when a product should be run or not, following the principle that a product should only be made when the downstream step has signaled that it needs more. “The Kanban schedule replaces the traditional weekly or daily production schedule most of us have become familiar with in manufacturing operations. This schedule is replaced with visual signals and predetermined decision rules that allow the production operators to schedule the line” (Gross & McInnis 2003). Kanbans can come in many forms, but the general commonality is what was stated. The following benefits can be had by switching to a Kanban methodology for manufacturing scheduling.
1. Reduces Inventory 2. Improves Flow 3. Prevents Overproduction 4. Places Control at the operations level 5. Creates visual scheduling and management of the process 6. Improves responsiveness to change in demand 7. Minimizes risk of inventory obsolescence 8. Increases ability to manage the supply chain
(Gross & McInnis 2003)
Algorithms
Facilities planning and design has a robust history (in the manufacturing industry) of conducted research on algorithms aimed to optimize facility flows and designs (Rosenblatt and Lee,1987). “A review of intelligent approaches for designing dynamic and robust layouts in flexible manufacturing systems” covers different approaches to attacking the problem of facility layouts. The article begins by discussing the basic question of whether to choose a dynamic or robust layout for your facility, focusing on the costs and benefits of each solution, including the various distinct types of algorithms that can be used for facility space and flow optimization. This article provides value to the project as it gives details about a wide variety of algorithms that are useful

13
for different scenarios. Due to the size of the client’s facility for the project, the target algorithms that can be applied will deal with smaller sized manufacturing facilities. These methods are stated to be effective for the case of the project, but almost impossible for a medium to large scale facility improvement project. This article is very helpful due to it giving a framework of possible solutions that can be utilized to formulate an additional depth of insight for a systematic process improvement.
“Facility layout for cellular manufacturing system under dynamic conditions” touches on the topic of optimizing facility layout in a dynamic layout situation. To solve this issue they primarily used Hierarchical Genetic Algorithm to lessen the expense of moving parts within the respective cells, and also for between the cells. This method was useful for small and medium scale problems, which can be applied to this project. The data required to use this method will be possible, so this is a possible path to take to help reach the ultimate goal.
III. Design
An initial meeting with the client helped determine the deliverables, requirements and constraints for the facility redesign project. It was determined that the two main deliverables they require for this project are to complete a revenue per square foot analysis (see A1), and subsequently provide multiple facility layouts to them. This section of the report will discuss in further detail the project’s evaluated requirements, system constraints, and overall approach to provide the client’s deliverables.
The figures below show an overview of the facility and its current layout.

14
Figure 1: Entire Crystal Engineering facility (Microsoft Visio layout)
Figure 2: Warehouse

15
Figure 3: Auxiliary Production Floor

16
Figure 4: Primary Production Floor
As shown in the Visio layouts, the facility consists of three main areas: the warehouse where everything from old equipment to bulk items, and any overhead inventory is stored; the primary production floor which is located centrally, where the majority of assembly is completed there; lastly the auxiliary production floor where new product lines are currently being stored and assembled. The auxiliary production floor is attached to the facility but it is in a separate unit(room).
To commence the facility redesign project, the group began with a data collection and validation phase where the current layout was measured to get a more accurate picture, and a deeper understanding of how production flowed within the facility. The layout had changed organically over time and new items had been introduced that had not been added onto the current Visio layout. To be able to give the client their requested current revenue per square foot (see A1)

17
metric, the Visio Layout was updated to reflect the current state. This process involved physically measuring the facility to validate the existing layouts as well as improving the accuracy of the layout data.
Requirements The original problem statement for the project stated that the client, Crystal Engineering, was in the process of acquiring new product lines to implement into their assembly production floor within a twelve month timeline; therefore, a disruption in process flow due to a more crowded facility is unavoidable.
After several initial meeting with the client, the main deliverables identified were to calculate a revenue per square foot metric as well as provide several facility redesign layouts backed up by engineering and economic justifications. The main requirement that was echoed by different departments throughout capturing the Voice of the customer (VOC) was a need for more open space in the facility as well as an improvement in the utilization of their current space.
Constraints There were several constraints that were determined through initial and ongoing meetings with the client throughout the duration of the project which were:
1) Current facility is to be used, as no new facility will be purchased. 2) Machine specific rooms(calibration chambers) will not be relocated due to the extreme
costs in change over. 3) No proposed changes to additional or alternating shifts
Approach
Going forward the main design path used will be the systematic approach to facility design. As of now the goals have been determined and the operations for each product lines were mapped out. The group has defined the departments within the facility, and now must define the interrelationships between them. From there the the space requirements will be determined for each department and then propose several alternative layouts based on the findings.
Product Line Flows The most important step in initiating any facilities design project is understanding the operations, processes, and workflows in their current state. Several industrial engineering tool are useful in determining these things. To understand each product flow, flow charts and process flow charts were completed for each product line. There are a total of nine main product lines. Figure 5

18
below is an example of a flow for the XP2i, one of their main products. For all other flowcharts and flow process diagrams, please refer to Appendix B. The difference in the colors of the boxes in process maps signify a handoff to another worker in the procedure.
Figure 5: XP2i Flow Chart
The different colors indicate the different people or departments that handle the product from start to finish. The light green colored steps are generally for the assembly area as the facility is currently laid out. The peach colored steps are for a sub-assembly process that occurs almost entirely in building unit 11. The purple steps indicate the area of calibration labs. The blue steps indicated the areas of finished goods inspection, packaging, and finished good storage. The gray step indicated the last step which is always the shipping process. Defining Departments
After having defined the processes and facility flows for each of the products, the departments were defined. Departments were defined by closely examining the process flows and acquiring reiterative input from the client. Currently, the Crystal Engineering has a mixed department set

19
up. Departments are determined mostly based on processes, but there are some departments that are defined by products. For example, SPT and DCT products have a small area in which all processes are completed as opposed to other lines, such as, XP2i which travels through various different areas of the facility.
The departments were defined mainly by process since most products undergo similar process flows. For example, most products have some sort of assembly work or calibration required. The following is a list of the departments defined:
1. Raw Material Storage - storage for raw materials of all nine product lines 2. Welding - there are two welding workstations that are used for sensors (XP2i, M1) and
sensor modules (Nvision & 40 Series) 3. Assembly - Assembly is required for all nine products at different steps in each process 4. Calibration Lab/Chambers - Processing in the calibration is required for the majority of
products. 5. Conversion Table - The conversion table is used for software related processes such as
verification and conversions for sensors and sensor modules. 6. Kitting Table - this table is used for making kits including different components. The
kitting process is mainly used for CPF & Pump products, but some XP2i or 40 series are occasionally kitted.
7. Fluid Pressure Testing - The high pressure sensors for XP2i and M1 products require this process. This is also used for CPF hoses, a type of CPF product.
8. FG Inspection - The majority of the products go through this department towards the end of the processes for inspection and usually packaging.
9. FG Storage - This is where finished goods are stored along with some raw material for CPF and Pump products. CPF and Pump raw material is stored here mainly because it needs to be close to the kitting and shipping departments.
10. Shipping - All products are prepared for shipping in this area. 11. Production Planning - This is comprised of Randy and Trevor, which are production
schedulers and supervisors. They also perform receiving inspections for raw materials. 12. Repairs - This department is also known as the customer service department. They
mainly deal with customer repairs which sometimes requires calibration lab processing. 13. Engineering / R&D - This department includes any office space for engineering,
equipment, tools, and storage. This is currently scattered throughout the facility.

20
Defining Relationships
After having defined departments, the relationships between the departments need to be determined. This is the step where systematic layout planning is applied. First, a from/to chart was completed in order to determine the number of trips that are taken between departments. The time frame for this chart was based on the data given from annual sales and quantities of the products. From the from/to chart, the flow between chart was created. The flow between shows the absolute value of the trips between two different departments.
After completing the flow/between chart, the activity relationships chart was completed to define the importance of relationships between departments. The categories for the relationship were the following: absolutely necessary, especially important, important, ordinary, and unimportant. These were assigned based on the number of trips between departments. The higher number of trips, the more important the relationship is between two departments. Please refer to the Appendix C for the from/to chart, flow between, and activity relationships chart.
Figure 6: Relationship Diagram
Figure 6 above shows the resulting relationship diagram from the previous steps of systematic layout planning. This relationship diagram is then used to make a space relationship diagram. The space relationship diagram is used to show the relative size of each of the departments along with the relationships between them. This helps in developing alternative layouts by moving

21
departments around in different configurations. The space relationship diagram is seen below in Figure 7.
Figure 7: Space Relationship Diagram
Cellular Manufacturing Cellular manufacturing involves grouping product families and processes in order to place all equipment and workstations necessary in one “cell.” In a cellular manufacturing system, workstations and machines utilized in the process of production are grouped into several cells, where each cell is dedicated to a particular part family where the objective is to maximize cell independence. The holistic goals of cellular manufacturing are to accelerate production, manufacture a wide variety of similar products in close proximity while minimizing waste (such as transport and over-processing) as much as possible by reducing the material handling (or work in progress hand-offs), work-in-process, setup time, and manufacturing lead time. It is another methodology that was used in fabricating the design of a facility layout. The process of cellular manufacturing involved three major steps:
1. Defining specific process groups (such as welding, inspection, assembly, etc.) by area 2. Implement process groups and products into cellular manufacturing matrix 3. Calculate product groups using cellular manufacturing matrix

22
Figure 8: Cellular Manufacturing Matrix
After documenting process flows for each individual product, the similar process steps became apparent for all products. In order to formulate the cellular manufacturing maxtrix, grouped process departments had to be made which are shown above (Figure 8) under the first column. In the cellular manufacturing matrix, the marked “x’s” signify the products that utilize the corresponding process step of the leftmost column. The goal was to cluster together as many similar “x” marks possible by rearranging products (columns) to define similar product groups. The first row of the matrix (Figure 8) shows the paired products in corresponding colors. The grouped product cells were defined in four different cells:
1. M1,XP2i 2. NVision, 40 Series 3. 30 Series, SPT/DCT 4. CPF, Pump, ACT
It should be noted that the rows highlighted in pink are shared process steps by different cells and the purple highlighted rows are utilized by all products Space Savings
The last design strategy that was used in the formulation of one of the facility redesign layouts was not a specific industrial engineering method. It was based on subjective decision making and discussions with the client. The focus of this strategy was to fulfill the principle request from the client to open up as much space as possible for future expansion of product lines. This design was completed after having developed the designs based on SLP and cellular manufacturing in order to give a more robust set of alternatives. Flow based on the routing of each of the product lines was still taken into consideration for this design.

23
IV. Methods To determine the effectiveness of each proposed layout, a variety of industrial engineering tools were utilized that incorporated lean manufacturing and six sigma fundamentals. Each proposed redesign also included a layer of economic analysis for the change to be justified. Available space for expansion is important to the clients as they are a rapidly expanding company and need to keep available space to maximum utilization. It was ensured to keep the client updated on the facility redesign process as well as included for input in order to create a reiterative process to attain the most optimized designs. The following section of the report will discuss in further detail some of the the major engineering tools applied throughout the project that were used for justifying the provided facility layout redesign options.
Project Management The team decided to make a project Gantt chart to make everyone accountable for action items and set deadlines. Figure 9 and 10 below show the major steps for the Gantt chart throughout the quarter. The use of Microsoft Project made it simple to develop the Gantt chart and to stay on schedule.
Figure 9: Gantt Chart

24
Figure 10: List of Tasks for Gantt Chart
Flowcharts and Process Flow Diagrams Flowcharts and process flow diagrams were developed in order to outline the process for each of the product lines. This helped define the operations of the facility in order to use spaghetti diagrams to acquire the flows for each products in terms of distances travel for material. Microsoft Visio and Excel were primarily used to make them. Please refer to Appendix B for these flowcharts and process flow diagrams.
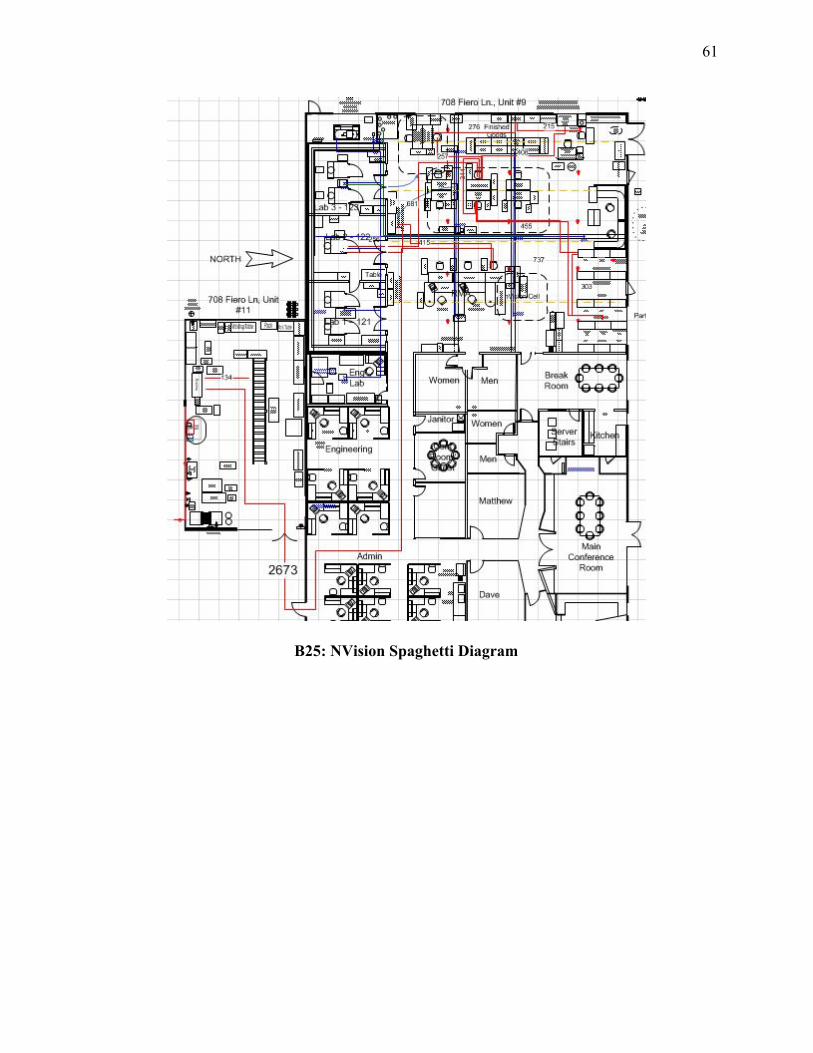
Spaghetti

25
Spaghetti diagrams were developed for individual product line. They were mainly developed for the purpose of reducing motion waste across the assembly process flow. The diagrams were also developed on Microsoft Visio with one the featured tools on the software package that counted the distance travelled by lines that were incorporated into the facility layout. These lines represented the walking distance by the workers and material(see Appendix B for rest of flows). In order to keep the analysis constant and as organized as possible, the lines were made with perpendicular crossings; moreover, the lines were either drawn vertical or horizontal, not diagonal.
Analytic Hierarchy Process (AHP) In order to determine what factors valued most, input was received from the client. The analytic hierarchy process (AHP) tool was designed with client input on the factors valued and the weights assigned. The scores that were yield as a result of the ratings assigned were later incorporated to the justification of the best recommendation for each of the possible layouts.

26
V. Results and Discussion Design 1
Figure 11: Design 1 (Cellular Manufacturing)
Design 1 (Figure 11) incorporated the cellular manufacturing methodology. The design features four different “cells” that were identified with the use of the cellular manufacturing matrix (see Design section). The boxes outlined in red, yellow, blue, and purple boxes are corresponding to the product “cells” whereas the orange highlighted box represents shared spaces by different cells. It can be noted this design opens up a significant amount of usable production space in the auxiliary production floor (Unit #11) while also fully utilizing all of the space in the warehouse (Unit #27). Other changes include the addition of more inventory storage shelves and an ultrasonic welding enclosure for the main production floor. Table 1 below shows metrics that were evaluated for this layout.

27
Flow Savings (miles/yr)
Total Available Space in Production
(sq ft)
Total Available Space in Warehouse
(sq ft)
Cost to Implement
43.57 1190.7 74.583 $14,079.00
Table 1: Design 1 Summary Data Design 2
Figure 12: Design 2 (SLP)
Design 2 (Figure 12) incorporated the systematic layout planning methodology. It can be noted that this design also opens up a significant amount of space in the auxiliary production floor (Unit #11), while leaving room for additional storage in the warehouse (Unit #27). It also utilizes most of the main production floor. Other changes include the addition of more inventory storage shelves and an ultrasonic welding enclosure for the main production floor. This design moves Production Planning and Repairs into the office space since there was no significant relationship to other departments based on the SLP analysis. Table 2 below shows metrics that were evaluated for this layout.

28
Flow Savings (miles/yr)
Total Available Space in Production
(sq ft)
Total Available Space in Warehouse
(sq ft)
Cost to Implement
38.66 1019.8 379.4 $14,272.00
Table 2: Design 2 Summary Data Design 3
Figure 13: Design 3 (SLP)
Design 3 (Figure 13) also incorporated the systematic layout planning methodology. It can be noted that this design opens up the most amount of space in the warehouse (Unit #27) as well as fully utilizing the auxiliary production floor while leaving some space in the main production floor to possibly implement a workstation in the future next to the welding area marked in grey. The main difference between this SLP design versus the Design 2, was the opening up of warehouse space and keeping the SPT/DCT product line assembly and calibration area in the current location (in the bottom left of Unit #11). This design moves Production Planning and

29
Repairs into the office space since there was no significant relationship to other departments based on the SLP analysis. Table 3 below shows metrics that were evaluated for this layout.
Flow Savings (miles/yr)
Total Available Space in Production
(sq ft)
Total Available Space in Warehouse
(sq ft)
Cost to Implement
21.32 983 597.6 $2,579.00
Table 3: Design 3 Summary Data Design 4
Figure 14: Design 4 (Space Savings)
Design 4 (Figure 14) incorporated a facility redesign layout focused on maximizing space savings for future product line expansion. This design features the most amount of usable open space in the main production floor while leaving some space for storage in the center region of the auxiliary production floor (Unit #11) as well as increasing the amount of inventory shelving in the warehouse (Unit #27) in anticipation of the upcoming expansion. This design move

30
Production Planning and Repairs departments out of the main floor in order to free up space. Table 4 below shows metrics that were evaluated for this layout.
Flow Savings (miles/yr)
Total Available Space in Production
(sq ft)
Total Available Space in Warehouse
(sq ft)
Cost to Implement
13.5673814 2316.305 150.94 $4,655.00
Table 4: Design 4 Summary Data
Analytic Hierarchy Process Results The analytical hierarchy process (AHP) starts with determining the weights for the factors that are used in order to choose the optimal design. This was done by conversations with the clients and collecting data on their rankings for several factors. The factors for the AHP were determined by conversations with the clients based on what they find important in a layout. These include the following factors: available space, flow, cost, and effort of implementation. The weights were determined using matrix calculations. Figure 15 below shows the matrix calculation for the weights.
Figure 15: AHP Weight Calculations
After this, pairwise comparisons for each alternative design were completed in order to determine the weights of the alternatives based on the four factors. For the flow metric, the savings compared to the current layout for each alternative were used to determine the matrix values. Specifically, the metric used was total savings in flow per year based on the total batches

31
of each product (see Appendix D1). For the available space metric, the total available space was defined to be production floor space along with some inventory space since this was of highest importance to the customer. Each layout was compared by how much open space there was available for production and inventory (see Appendix D2). For the cost metric, the costs for implementation of each of the alternatives were used to compare each alternative. (see Appendix D3). For the effort of implementation metric, the total square footage that would be moved to implement the alternative design was summed and used to make the pairwise comparisons (see Appendix D4).
After computing the weights for each alternative based on the four factors, a matrix was formulated in order to multiply it by the weights of the factors. This resulting matrix is shown below in Figure 16. The calculation indicated Design 4 to be the optimal layout.
Figure 16: Final AHP Calculation
Economic Analysis
Each design has been economically justified utilizing three different factors; cost to implement, annual savings in distance traveled, and potential increased annual revenue.
● Cost to implement: the price for equipment and services necessary to implement the layout. Such as the cost of new tables or a junk removal service (see references for junk removal rates). This does not include the cost of the labor that will be provided by the company, as it was determined to be a sunk cost.
● Annual savings in distance traveled: based on the reduction in distance that each product must travel from the beginning of its process to the end. We calculated this distance and converted it into miles per year, we then divided by the average walking

32
speed of two miles per hour. Giving us the total amount of labor hours that are being saved. Once we multiplied the labor rate by the labor hours we were given the total amount of savings annually for distance traveled.
● Potential increased annual revenue: determined by multiplying the average revenue per square foot by the additional available production space. First to determine the average revenue per square foot, we found the revenue per square foot of each product. The square footage that was measured was the space that fixed objects such as workstations, racks, shelving, calibration chambers, welders, and any other equipment that is required to manufacture the product occupies. See table 5 below for the final analysis of revenue per square foot.
Table 5: Revenue per Square Foot by Product
Since it is not known what products will be introduced into the facility, an average of the revenue per square foot was taken to determine what to expect from new product lines. This gave an average value of $8,999.27 for revenue per square foot.
Then the additional available production space was determined. The the empty contiguous space within the layouts was measured to find how much total available space was available. Since not all empty space will be usable, it was determined the percentage of space that would actually be used. Calculated was that 29.9% of any production floor space opened would be occupied, and that 49% of warehouse space would be occupied when available. From there it was calculated that 10% of the newly implemented production space would be occupied for warehouse inventory.
Design 1 (Cellular Layout)
● Cost to implement:

33
Ultrasonic Welder Enclosure $11,500
3 small racks (raw storage) $579
Junk Removal Service (warehouse) $2000
Total $14,079
Table 6: Design 1 Cost Breakdown
● Annual savings in distance traveled
435.70year43.57 miles × hour
2 miles × $20hour = $
● Potential increased annual revenue
8, 99.27 rev/square f t 391.62 square feet 3, 24, 94 $ 9 × = $ 5 2
Design 2 (SLP 1)
● Cost to implement:
Ultrasonic Welder Enclosure $11,500
1 medium rack $193
3 small racks (raw storage) $579
Junk Removal Service (warehouse) $2000
Total $14,272
Table 7: Design 2 Cost Breakdown
● Annual savings in distance traveled
386.60year38.66 miles × hour
2 miles × $20hour = $
● Potential increased annual revenue
8, 99.27 rev/square f t 335.41 square feet 3, 18, 45 $ 9 × = $ 0 4
34
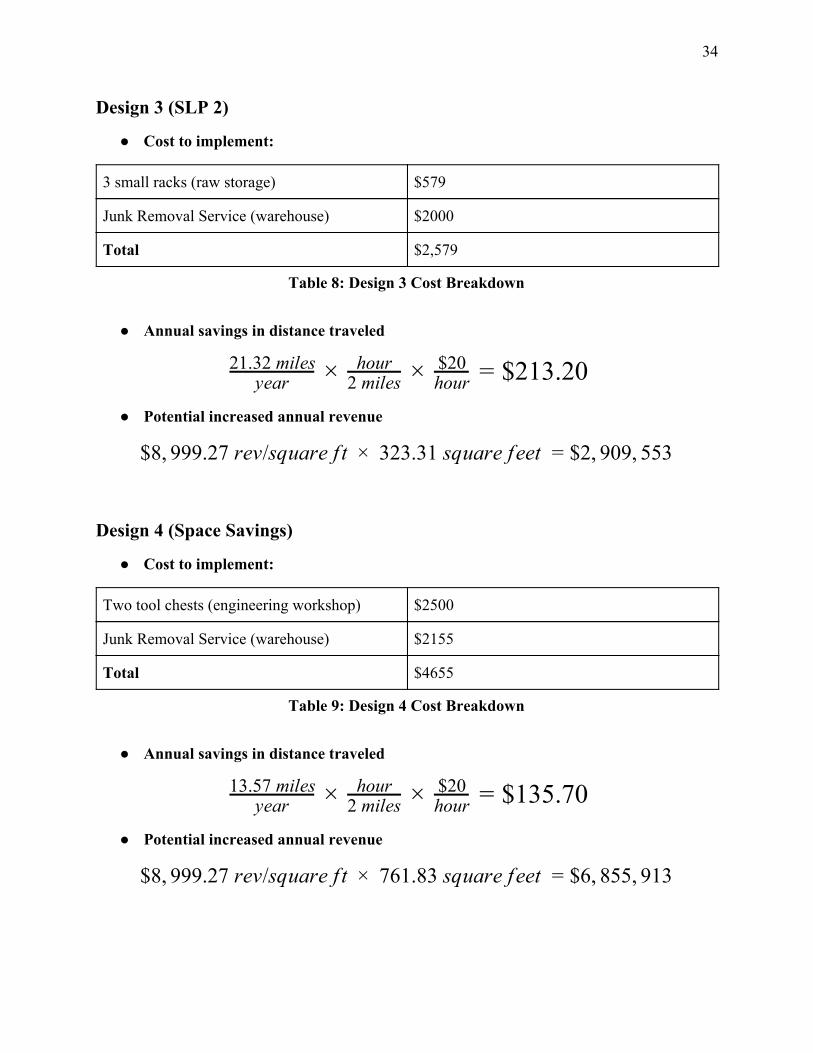
Design 3 (SLP 2)
● Cost to implement:
3 small racks (raw storage) $579
Junk Removal Service (warehouse) $2000
Total $2,579
Table 8: Design 3 Cost Breakdown
● Annual savings in distance traveled
213.20year21.32 miles × hour
2 miles × $20hour = $
● Potential increased annual revenue
8, 99.27 rev/square f t 323.31 square feet 2, 09, 53 $ 9 × = $ 9 5
Design 4 (Space Savings)
● Cost to implement:
Two tool chests (engineering workshop) $2500
Junk Removal Service (warehouse) $2155
Total $4655
Table 9: Design 4 Cost Breakdown
● Annual savings in distance traveled
135.70year13.57 miles × hour
2 miles × $20hour = $
● Potential increased annual revenue
8, 99.27 rev/square f t 761.83 square feet 6, 55, 13 $ 9 × = $ 8 9

35
Layout Cost to implement
Annual savings in distance traveled
Potential increased annual revenue
Design 1 (Cellular) $14,079 435.70 $ $3,524,294
Design 2 (SLP 1) $14,272 386.60 $ $3,018,445
Design 3 (SLP 2) $2,579 213.20 $ $2,909,553
Design 4 (Space savings) $4,655 135.70 $ $6,855,913
Table 10: Economic Analysis Summary
As you can see in table 10, design 3 has the lowest cost to implement. Design 1 has the highest annual savings for distance traveled. Lastly, design 4 has the highest potential increased annual revenue. While no layout was a clear winner of all three categories, design 4 by far is the winner due to the number being several million dollars higher than the alternatives, at the expense of a few hundred in distance traveled and a few thousand in cost to implement. To add to this, available space was determined by the customer as the most important factor, which the analysis backs up the choice of design 4 as the best economic alternative.
Design 4 Further Analysis
Crystal Engineering has a 50% average profit margin on their products. They will be bringing in three new product lines whose size is estimated at a total of 584 square feet. This additional information was used to determine the potential increased annual profit, projected increased annual profit based on the three new product lines, payback period, and ROI.
● Potential Increased Annual Profit
, 99.27 .5 61.83 sq f t. 3, 27, 578 9 Sq. f t.revenue × 0 prof it
revenue × 7 = $ 4 9

36
● Projected Increased Annual Profit Based on Three New Products
, 99.27 .5 84 sq f t. 2, 27, 868 9 Sq. f t.revenue × 0 prof it
revenue × 5 = $ 6 7
● Payback Period
, 55 dollars 2, 28, 22 65 ) 0.65 days4 6 ÷ ( 6 7 yeardollars ÷ 3 year
days =
● ROI
) x 100 6, 50% ( $4,655$2,627,786 − $4,655 = 5 3
VI. Conclusions
The client, Crystal Engineering, will be undergoing an expansion of their product line within the following year without expanding the size of their current facility; therefore, an opportunity exists to improve the facility layout to accommodate for future expansion. The primary objectives that were identified with the client are as follows:
● A revenue per square foot metric calculation of all of their products in current production.
● Thorough analysis incorporating several lean process improvement and facility design tools including process flow diagrams,spaghetti diagrams, and lean and 5s principles.
● Several facility redesign options for future expansion ○ This encompasses the entire facility including production and warehouse
(inventory storage) rooms
Throughout the project, several methods were used to calculate the four different facility redesign layouts. The methods of formulating redesign layouts included cellular manufacturing, systematic layout planning, and a layout that focused on saving as much space as possible(see space savings design section).

37
Cellular manufacturing involved grouping together similar products into categorized “cells” to maximize efficiency. By placing machines and workstations in close proximity to corresponding similar products, manufacturing waste can be reduced and production can be accelerated. This method yielded one facility redesign layout (design 1). Systematic layout planning(SLP) is a similar engineering tool that was used to develop designs 2 and 3 of the facility redesigns. In summary, SLP is a tool used specifically for developing facility layouts by logically arranging areas of high frequency of interaction in close proximity. The goal of this process is provide the quickest possible flow of materials (processes) and minimize the amount of material handling. After utilizing different methodologies to formulate the facility redesigns, the project team realized that the overall goal of the project had not been reached due to lack of open space in the main production floor. The systematic layout planning and cellular manufacturing methodologies were successful in improving flow, but the space savings layout was better in terms of the overall goal of the project which was to free up available production space. The project team would recommend the following:
● Implement Design 4 based on the AHP and Economic Analysis ● Remove extra cubicles that are used for storage to accomodate for the changes of the
recommended design. ● Move production planning and customer service/repairs departments into the office area. ● Consolidate engineering inventory, equipment and workstations into one are into
warehouse. One of the most significant factors in the justification of the implementation of Design 4 was found in the economic analysis. The results determined that the potential increase for annual profit based on the projected addition of three new product lines was valued at $2,627,786. Furthermore, the other three layouts would not be able to accommodate the three new lines if they were to be the projected size, leaving Design 4 the only design to fully accommodate the clients requirements due to its aggressive focus on space savings for future product line expansion. The team learned lessons in how manufacturing theory translates into practices. A great example of this was the big constraint of not being able to move the calibration labs because they need to be highly controlled environments. This definitely affected the way the designs were developed. Another important aspect about this project was process flow definition. The team realized how important it is to properly map out a process. Mapping out each of the flows was an iterative process, yet it proved to be fruitful in the analysis.

38
In terms of improvements that could have been made for the project, the team acknowledges that it would have been beneficial to have collected more data to validate the assumptions and estimates given by the client. In the process of calculating the revenue per square foot metric that was requested by the client, time studies would have been an ideal tool to use to validate the estimates given on the amount of time each individual product spends at each workstation during the assembly process.
References

39
Amir-Mohammad Golmohammadi, Hamid Bani-Asadi, Hamid Esmaeeli, Hengameh Hadian, and Farzaneh Bagheri. "Facility Layout for Cellular Manufacturing System under Dynamic Conditions." Decision Science Letters 5.3 (2016): 407-16. Web.
Delaney, D., JW Herrmann, G. Ioannou, T. Lu, I. Minis, Ah Mirza, and R. Palmer. "DESIGN AND IMPLEMENTATION OF A HYBRID MANUFACTURING FACILITY." Computers & Industrial Engineering 29 (1995): 315-19. Web.
Duggan, Kevin J. "Facilities design for lean manufacturing." IIE Solutions, Dec. 1998, p. 30+. Academic OneFile, Accessed 28 Jan. 2018.
Gross, John M., and Kenneth R. McInnis. Kanban Made Simple: Demystifying and Applying Toyota's Legendary Manufacturing Process. New York: AMACOM, 2003. Web.
Heragu, Sunderesh. Facilities Design. Boston: PWS Publishing, 1997.
Liker, Jeffrey K. The Toyota Way: 14 Management Principles from the World's Greatest Manufacturer. McGraw-Hill, 2004.
Moslemipour, Ghorbanali, Tian Lee, and Soon Rilling. "A Review of Intelligent Approaches for Designing Dynamic and Robust Layouts in Flexible Manufacturing Systems." The International Journal of Advanced Manufacturing Technology 60.1 (2012): 11-27. Web.
Naqvi, Syed Asad Ali, et al. “Productivity Improvement of a Manufacturing Facility Using Systematic Layout Planning.” Cogent Engineering, vol. 3, no. 1, 2016, doi:10.1080/23311916.2016.1207296.
Omogbai, and Salonitis. “The Implementation of 5S Lean Tool Using System Dynamics Approach.” Procedia CIRP, vol. 60, 2017, pp. 380–385.
Pattanaik, L. N., and B. P. Sharma. “Implementing Lean Manufacturing with Cellular Layout: a Case Study.” The International Journal of Advanced Manufacturing Technology, vol. 42, no. 7-8, 2008, pp. 772–779., doi:10.1007/s00170-008-1629-8.
Rosenblatt, Meir J., and Hau L. Lee. “A Robustness Approach to Facilities Design.” International Journal of Production Research, vol. 25, no. 4, 1987, pp. 479–486.
Saunders, B. W. Facilities Design: a Problem of Systems Analysis. International Journal of Production Research, vol. 9, Taylor & Francis Ltd, Jan. 1971. EBSCOhost, search.ebscohost.com/login.aspx?direct=true&db=buh&AN=5550961&site=ehost-live.
Tompkins, James A. Facilities Planning. John Wiley & Sons, 2010.
Zhao, Yifei, and Stein W. Wallace. "Appraising Redundancy in Facility Layout." International Journal of Production Research (2015): 1-15. Web.

40
“Price List.” San Luis Movers & Junk Removal, sanluismoversandjunkremoval.com/junk-removal/pricelist/.
“UNITED STATES DEPARTMENT OF LABOR.” Occupational Safety and Health Administration, www.osha.gov/.

41
Appendix
Product Line
Annual Qty
Rev(sales) per Unit of Product
Daily Through
put Lot Size (average) Pull/Push
Sq.ft Usage
Rev./Sq. Ft.
XP2i 12,000 $0.75 46.15 36 Push 557.32 $16,110.33 Nvision 900 $2.05 3.46 21 Push 276.09 $6,697.39 30 Series 1,300 $1.20 5 40-50 Push 186.20 $8,384.34 40 Series 375 $1.33 1.44 1-2 Pull 244.54 $2,036.70 CPF & Pump N/A
Depends on Order Both 204.30 $6,509.99
M1 1600 $0.37 6.15 36 Push 147.56 $4,023.42
SPT 10000 $0.15 38.46 50-100 Push, rarely Pull 68.30 $22,101.28
DCT 4000 $0.10 15.38 Depends on Order Pull 55.39 $6,954.73
ACT 2000 $0.05 7.69 Depends on Order Pull 12.92 $8,175.27
Service & Repairs N/A N/A N/A N/A N/A 125.70 $6,608.20
A1: Product Information
B1: Nvision Flow Chart

42
B2: 30 Series Flow Chart
B3: 40 Series Flow Chart

43
B4: M1 Flow Chart
B5: SPT & DCT Flow Chart
B6: ACT Flowchart

44
B7: CPF & Pump Flow Chart
B8: Nvision Sensor Module Subprocess Flow Chart

45
B9: 40 Series Sensor Module Subprocess Flowchart

46
B10: XP2i Flow Process Chart

47
B11: 30 Series Flow Process Chart

48
B12: 40 Series Flow Process Chart

49
B13: Nvision Flow Process Chart

50
B14: M1 Flow Process Chart

51
B15: SPT/DCT Flow Process Chart

52
B16: CPF Flow Process Chart

53
B17: Pump Flow Process Chart

54
B18: ACT Flow Process Chart

55
B19: XP2i Spaghetti Diagram

56
B20: 30 Series Spaghetti Diagram

57
B21: 40 Series Spaghetti Diagram

58
B22: ACT Spaghetti Diagram

59
B23: CPF Spaghetti Diagram

60
B24: M1 Spaghetti Diagram
61
B25: NVision Spaghetti Diagram

62
B26: Pump Spaghetti Diagram

63
B27: SPT/DCT Spaghetti Diagram

64
C1: From/To Chart
C2: Flow Between Chart

65
C3: Activity Relationships Chart
D1: Pairwise Comparison in terms of Flow Savings/Year

66
D2: Pairwise Comparison in terms of Available Space
D3: Pairwise Comparison in terms of Costs

67
D4: Pairwise Comparison in terms of Effort of Implementation