Embed Size (px)
Citation preview
1
Critical Success Factors and Organizational Performance
Prepared by: Niemann, Lahlou,
Zertani & Pflug Lecturer: Ihsan Yüksel
2
Introduction
• In this project, critical success factors approach will be used in measurement of organizational performance.
• Performance: output/outcome at the end of a certain period of time of an activity.
• Outcome: extents the organization reached its objectives.
• Performance measurement: evaluation of all efforts made to achieve objectives.
3
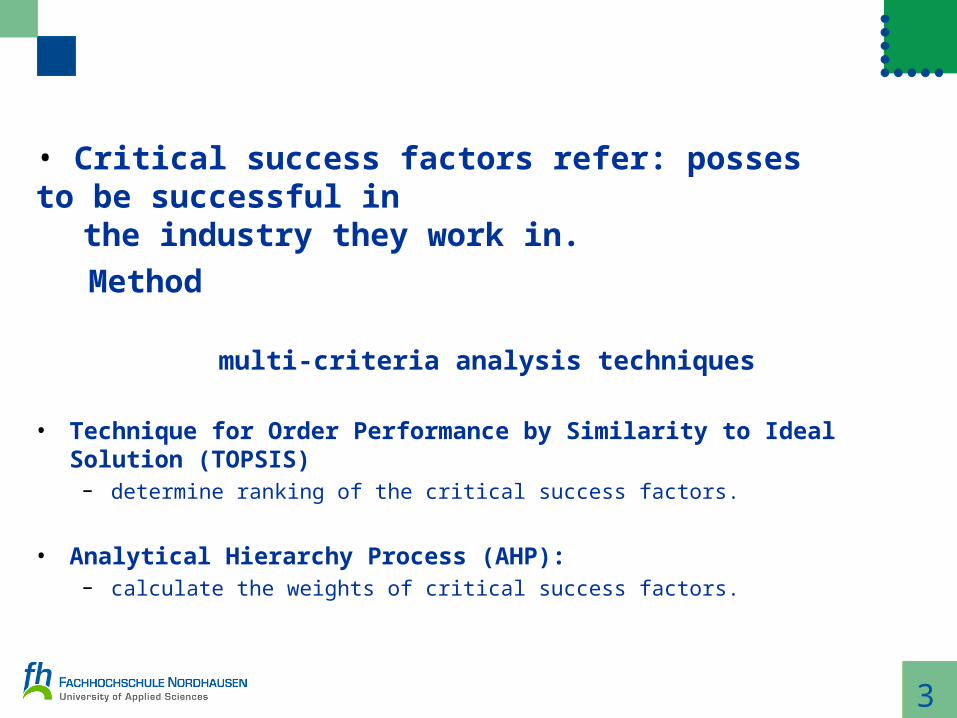
Method
multi-criteria analysis techniques
• Technique for Order Performance by Similarity to Ideal Solution (TOPSIS)
– determine ranking of the critical success factors.
• Analytical Hierarchy Process (AHP): – calculate the weights of critical success factors.
• Critical success factors refer: posses to be successful in the industry they work in.
4
Step 1: Determining the factors that enable the organization to be successful in its sector.
In this step, first the factors necessary for the organization to be successful in its sector have been determined.
5
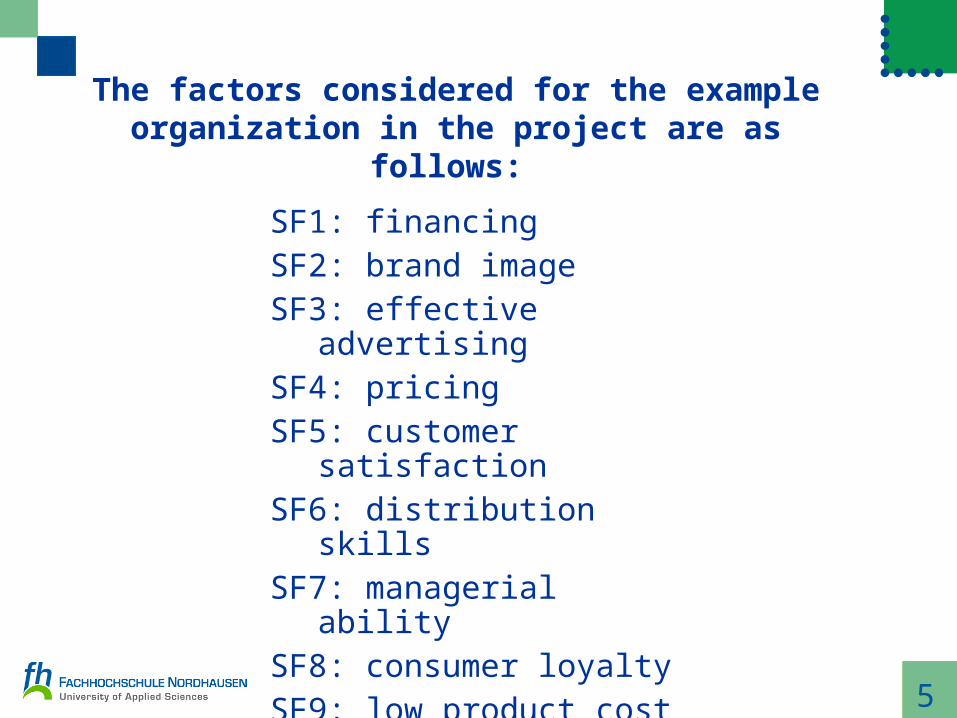
The factors considered for the example organization in the project are as
follows:
SF1: financingSF2: brand imageSF3: effective advertisingSF4: pricingSF5: customer satisfactionSF6: distribution skillsSF7: managerial abilitySF8: consumer loyaltySF9: low product cost
6
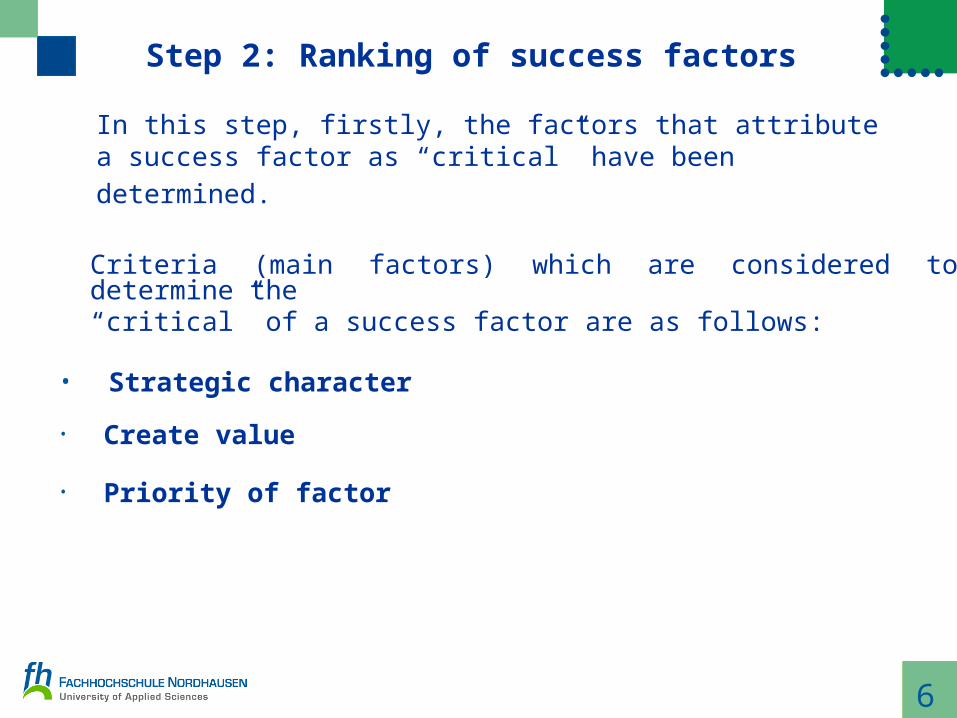
Step 2: Ranking of success factors
Criteria (main factors) which are considered to determine the “critical” of a success factor are as follows:
• Strategic character
• Create value
• Priority of factor
In this step, firstly, the factors that attribute a success factor as “critical” have been determined.
7
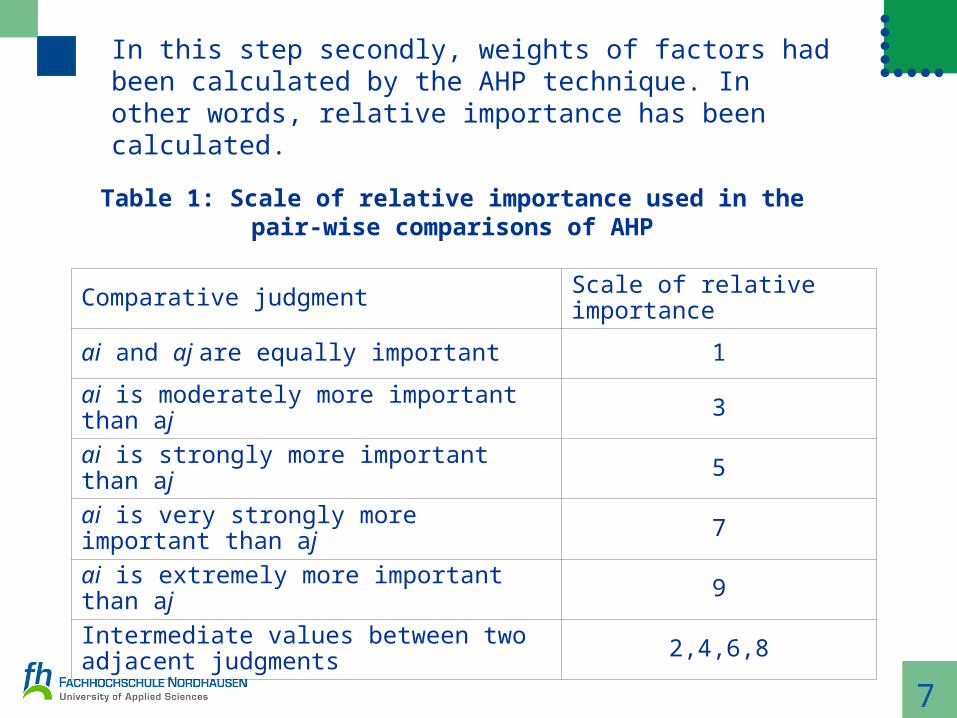
Comparative judgment Scale of relative importance
ai and aj are equally important 1
ai is moderately more important than aj 3
ai is strongly more important than aj 5
ai is very strongly more important than aj 7
ai is extremely more important than aj 9
Intermediate values between two adjacent judgments 2,4,6,8
Table 1: Scale of relative importance used in the pair-wise comparisons of AHP
In this step secondly, weights of factors had been calculated by the AHP technique. In other words, relative importance has been calculated.
8
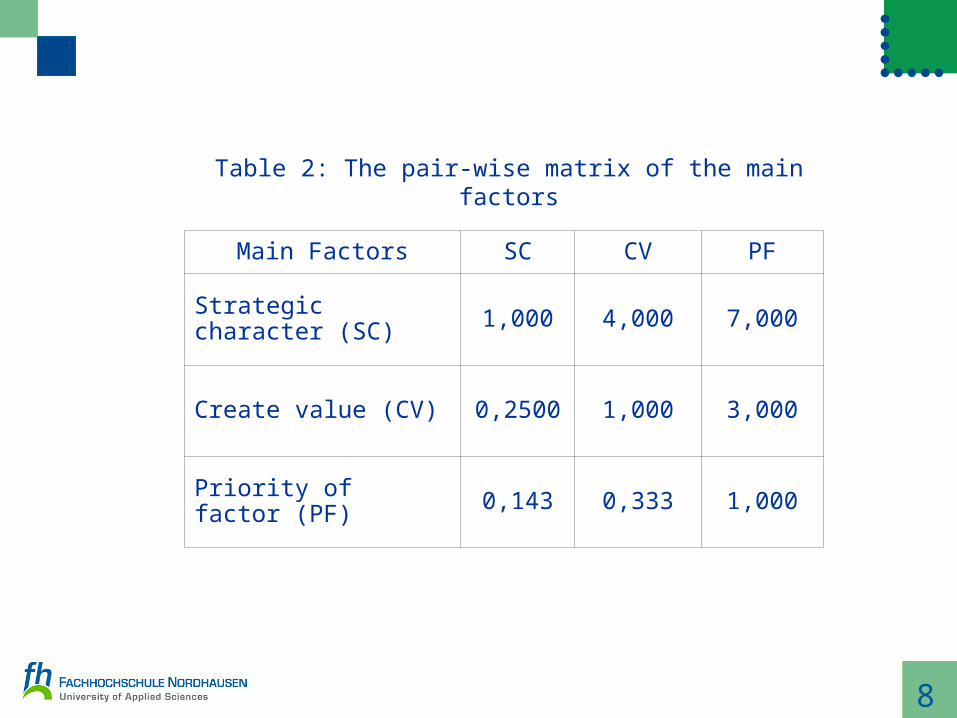
Main Factors SC CV PF
Strategic character (SC) 1,000 4,000 7,000
Create value (CV) 0,2500 1,000 3,000
Priority of factor (PF) 0,143 0,333 1,000
Table 2: The pair-wise matrix of the main factors
9
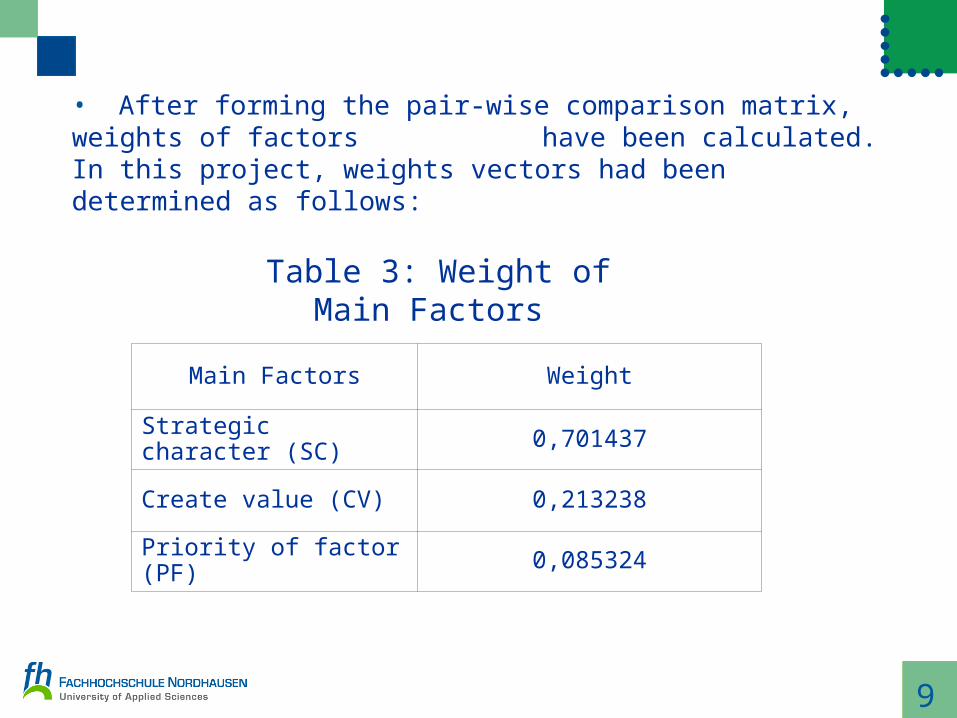
• After forming the pair-wise comparison matrix, weights of factors have been calculated. In this project, weights vectors had been determined as follows:
Main Factors Weight
Strategic character (SC) 0,701437
Create value (CV) 0,213238
Priority of factor (PF) 0,085324
Table 3: Weight of Main Factors
10
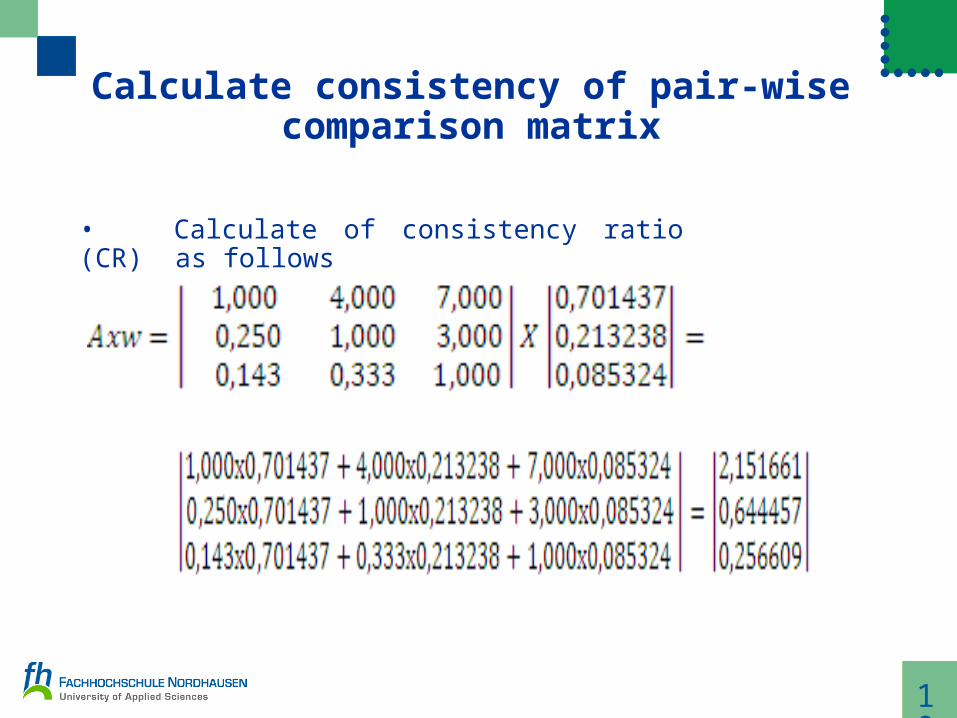
Calculate consistency of pair-wise comparison matrix
• Calculate of consistency ratio (CR) as follows
11
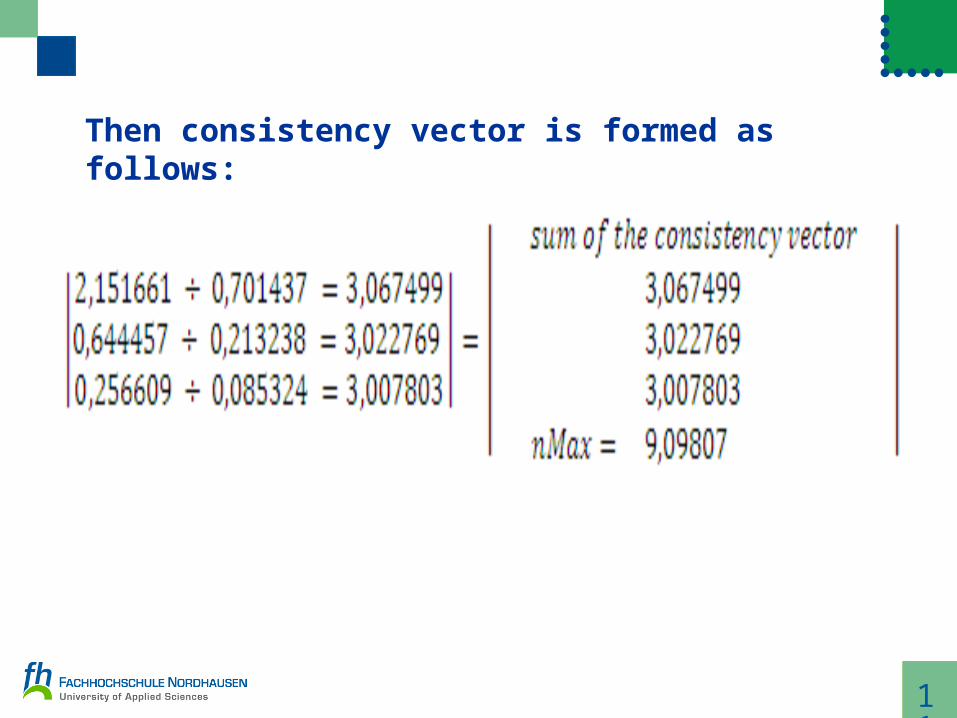
Then consistency vector is formed as follows:
12
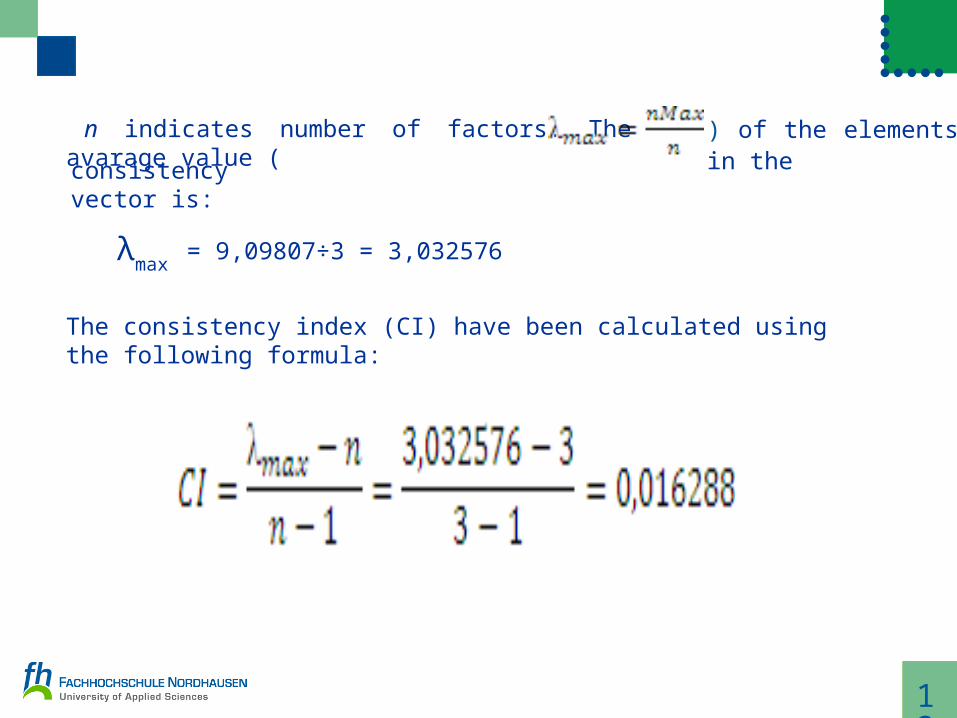
n indicates number of factors. The avarage value ( ) of the elements in the
consistency vector is:
= 9,09807÷3 = 3,032576
The consistency index (CI) have been calculated using the following formula:
λmax
13
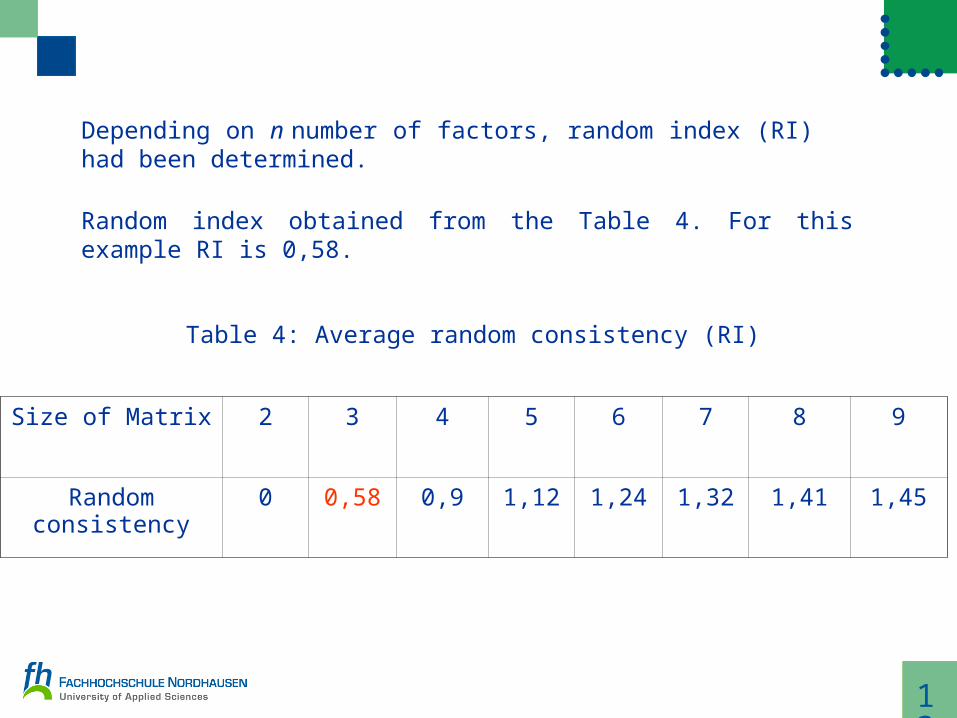
Depending on n number of factors, random index (RI) had been determined.
Random index obtained from the Table 4. For this example RI is 0,58.
Size of Matrix 2 3 4 5 6 7 8 9
Random consistency 0 0,58 0,9 1,12 1,24 1,32 1,41 1,45
Table 4: Average random consistency (RI)
14
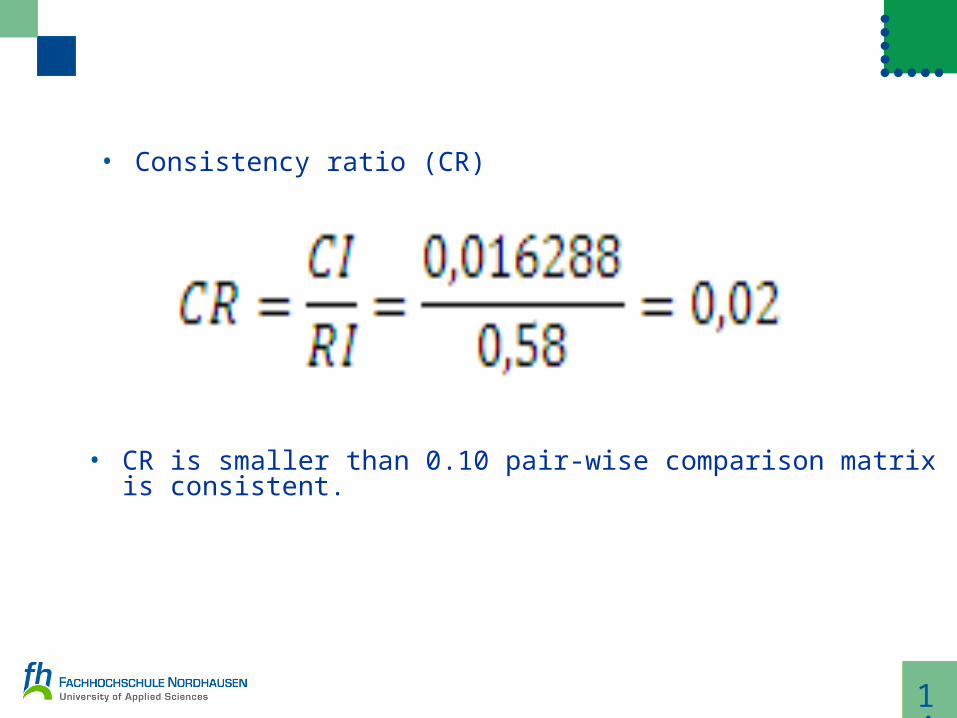
• Consistency ratio (CR)
• CR is smaller than 0.10 pair-wise comparison matrix is consistent.
15
Ranking:
• After calculating weight of the main factors, ranking of the success factors have been determined using TOPSIS technique.
• The calculations have been made in Excel program.
16
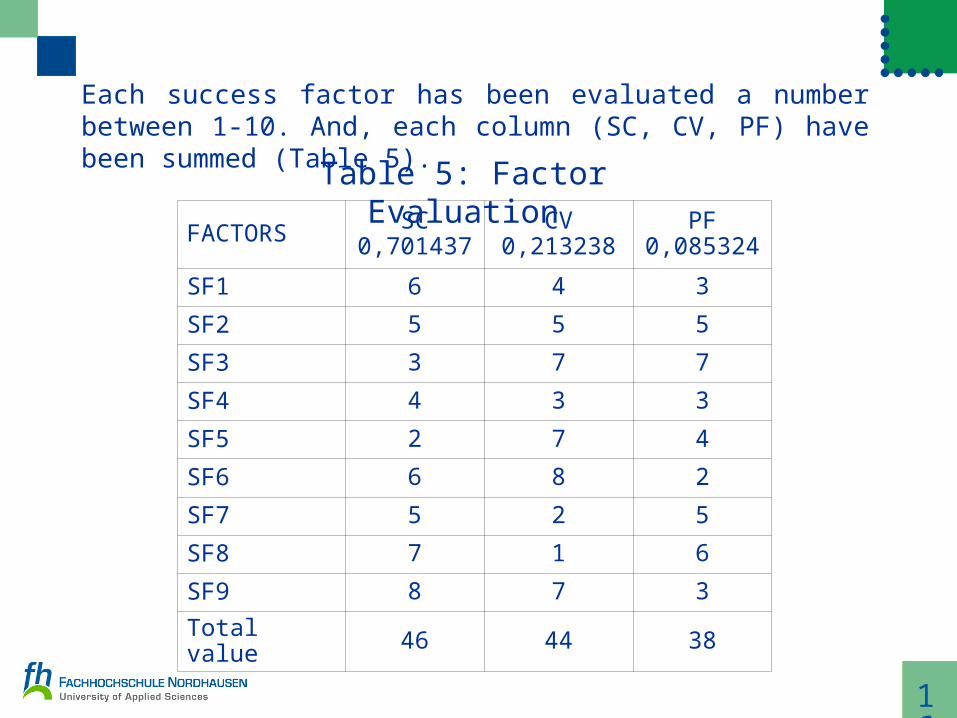
Each success factor has been evaluated a number between 1-10. And, each column (SC, CV, PF) have been summed (Table 5).
FACTORS SC0,701437
CV0,213238
PF0,085324
SF1 6 4 3
SF2 5 5 5
SF3 3 7 7
SF4 4 3 3
SF5 2 7 4
SF6 6 8 2
SF7 5 2 5
SF8 7 1 6
SF9 8 7 3
Total value 46 44 38
Table 5: Factor Evaluation
17
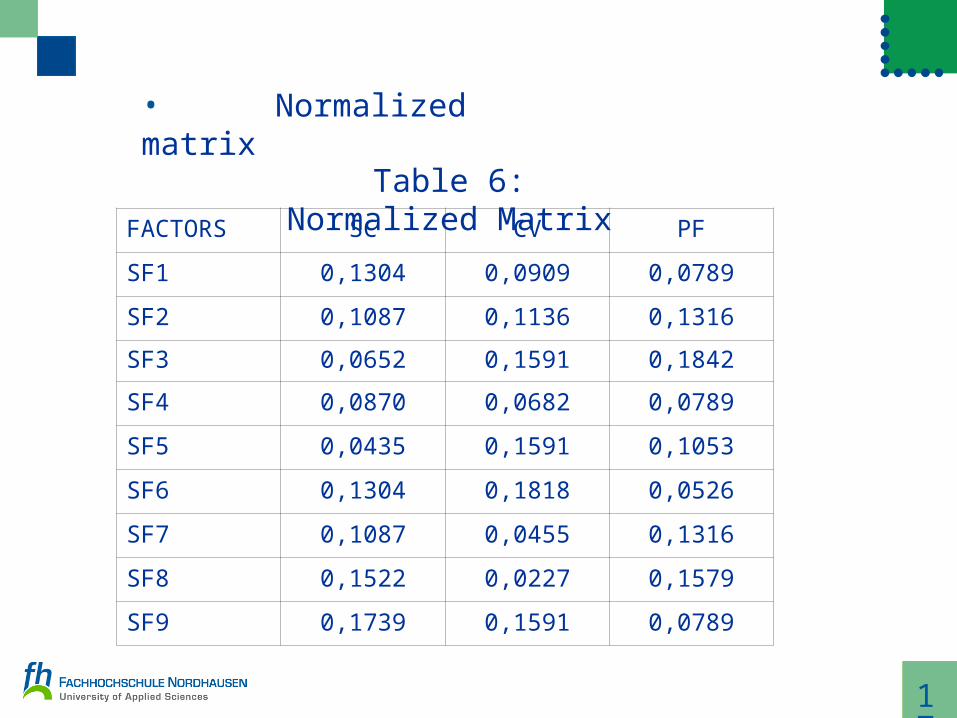
• Normalized matrix
FACTORS SC CV PF
SF1 0,1304 0,0909 0,0789
SF2 0,1087 0,1136 0,1316
SF3 0,0652 0,1591 0,1842
SF4 0,0870 0,0682 0,0789
SF5 0,0435 0,1591 0,1053
SF6 0,1304 0,1818 0,0526
SF7 0,1087 0,0455 0,1316
SF8 0,1522 0,0227 0,1579
SF9 0,1739 0,1591 0,0789
Table 6: Normalized Matrix
18
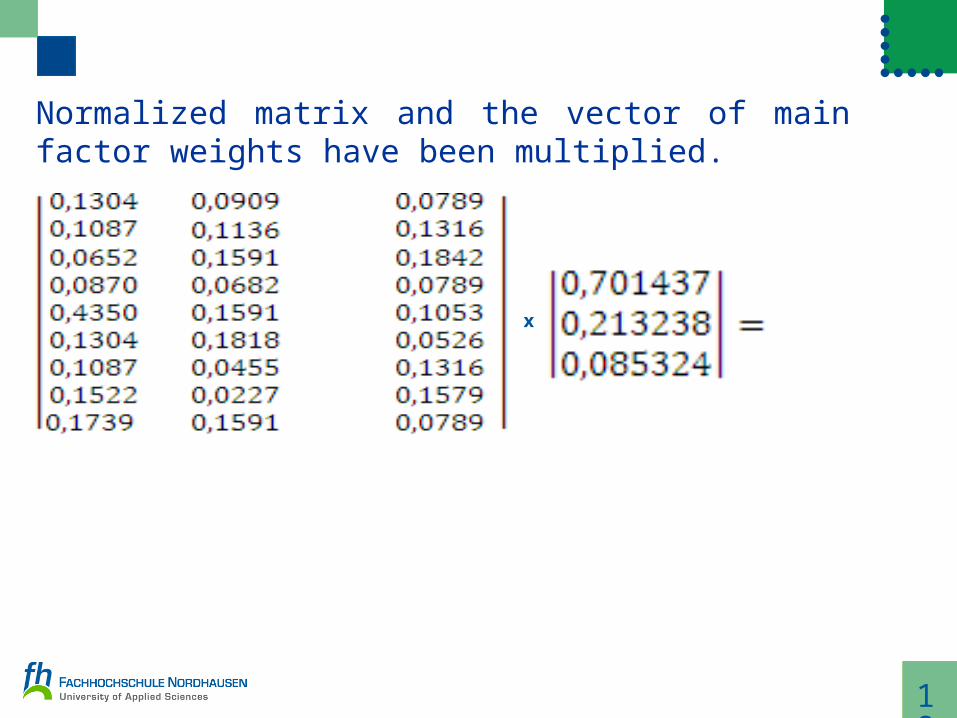
Normalized matrix and the vector of main factor weights have been multiplied.
x
19
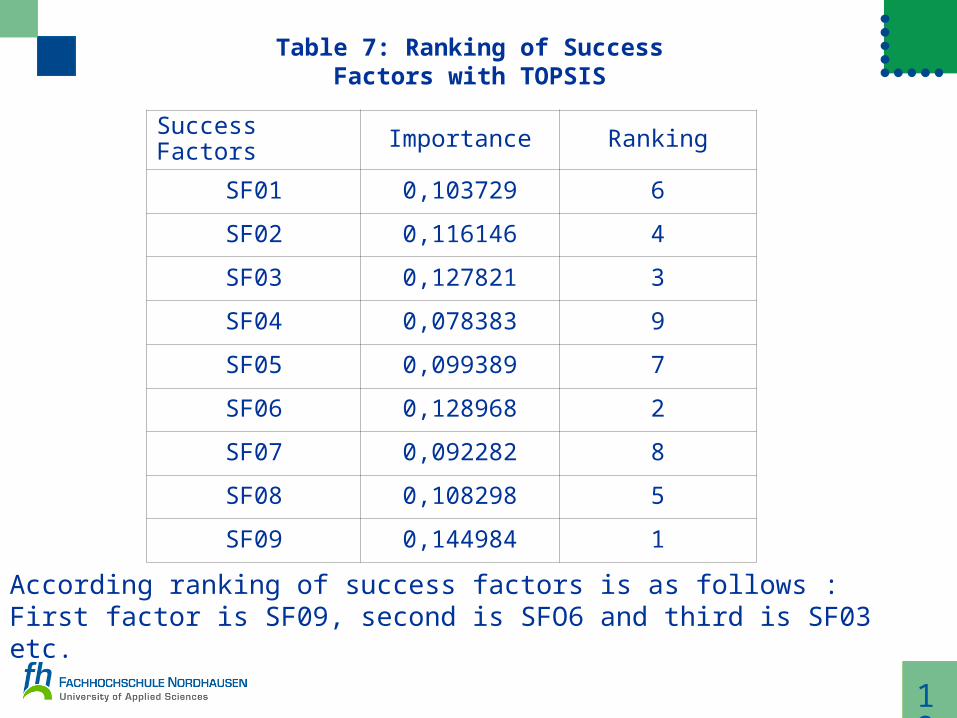
Success Factors Importance Ranking
SF01 0,103729 6
SF02 0,116146 4
SF03 0,127821 3
SF04 0,078383 9
SF05 0,099389 7
SF06 0,128968 2
SF07 0,092282 8
SF08 0,108298 5
SF09 0,144984 1
Table 7: Ranking of Success Factors with TOPSIS
According ranking of success factors is as follows : First factor is SF09, second is SFO6 and third is SF03 etc.
20
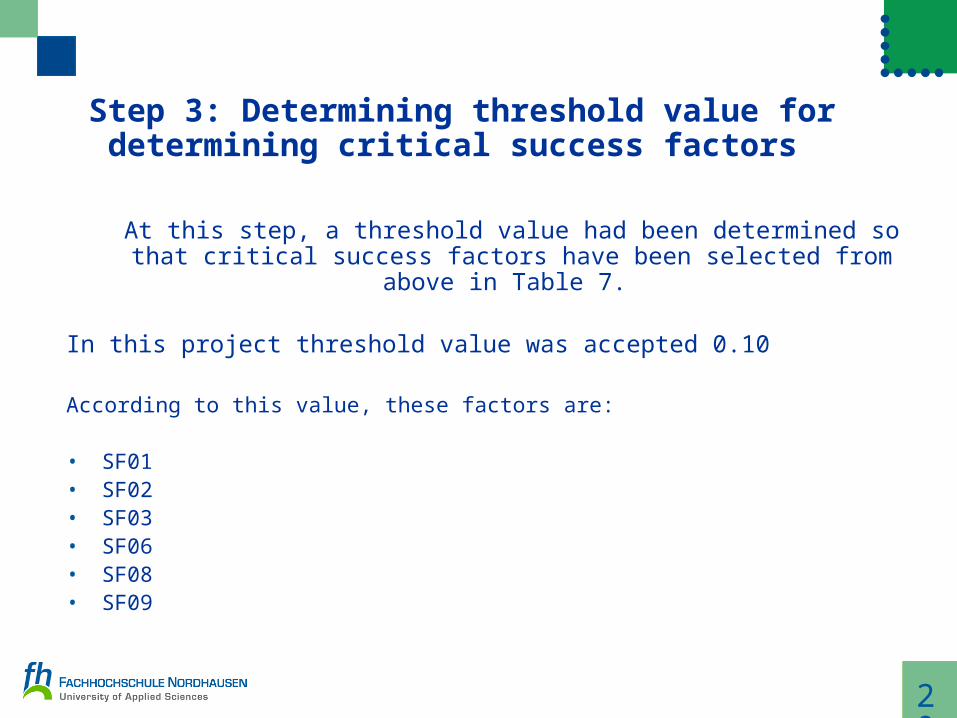
Step 3: Determining threshold value for determining critical success factors
At this step, a threshold value had been determined so that critical success factors have been selected from above in Table 7.
In this project threshold value was accepted 0.10
According to this value, these factors are:
• SF01• SF02• SF03• SF06• SF08• SF09
21
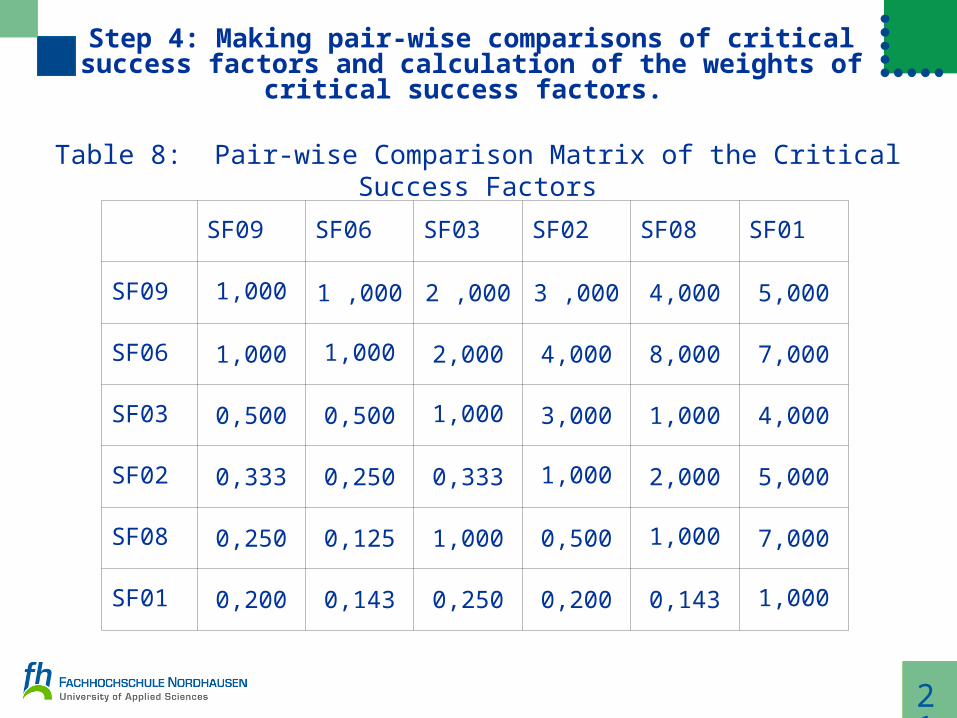
Step 4: Making pair-wise comparisons of critical success factors and calculation of the weights of
critical success factors.
SF09 SF06 SF03 SF02 SF08 SF01
SF09 1,000 1 ,000 2 ,000 3 ,000 4,000 5,000
SF06 1,000 1,000 2,000 4,000 8,000 7,000
SF03 0,500 0,500 1,000 3,000 1,000 4,000
SF02 0,333 0,250 0,333 1,000 2,000 5,000
SF08 0,250 0,125 1,000 0,500 1,000 7,000
SF01 0,200 0,143 0,250 0,200 0,143 1,000
Table 8: Pair-wise Comparison Matrix of the Critical Success Factors
22
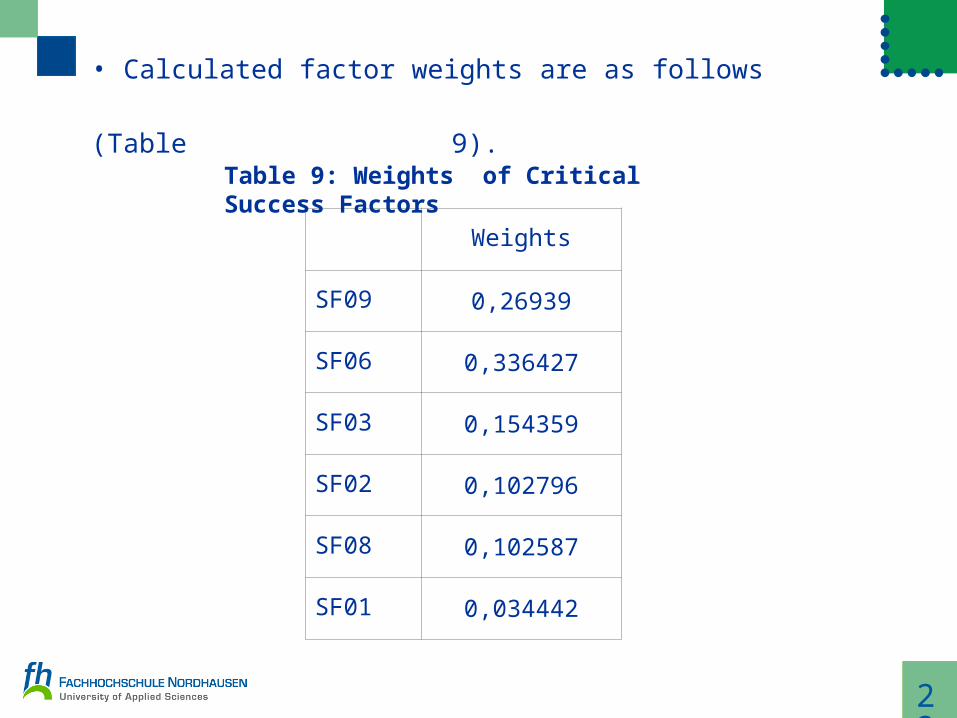
• Calculated factor weights are as follows (Table
9).
Weights
SF09 0,26939
SF06 0,336427
SF03 0,154359
SF02 0,102796
SF08 0,102587
SF01 0,034442
Table 9: Weights of Critical Success Factors
23
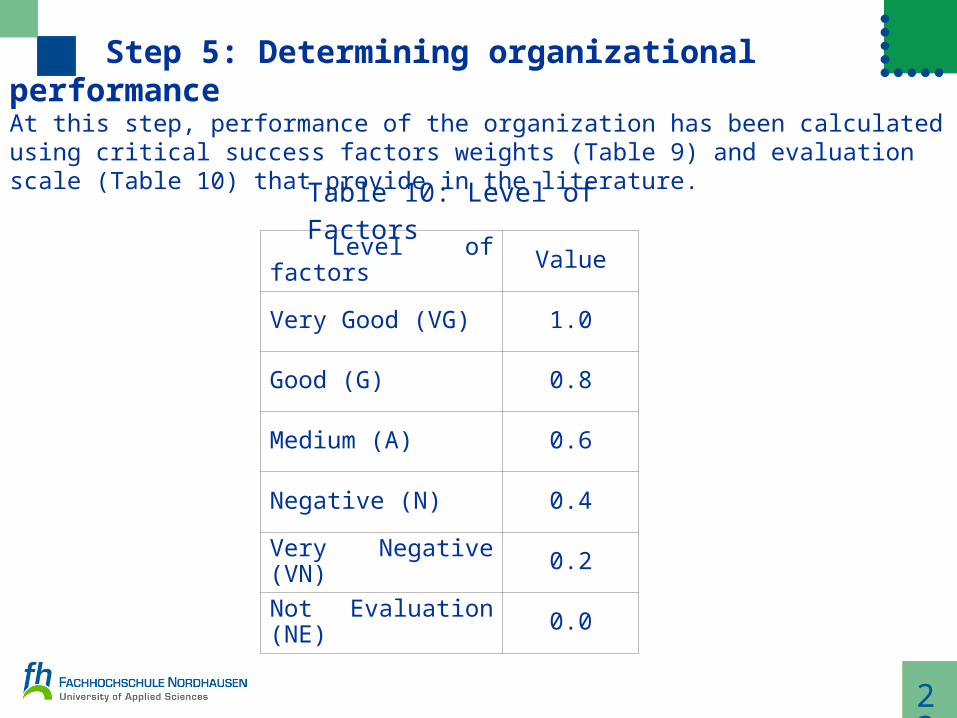
Step 5: Determining organizational performance At this step, performance of the organization has been calculated using critical success factors weights (Table 9) and evaluation scale (Table 10) that provide in the literature.
Level of factors Value
Very Good (VG) 1.0
Good (G) 0.8
Medium (A) 0.6
Negative (N) 0.4
Very Negative (VN) 0.2
Not Evaluation (NE) 0.0
Table 10: Level of Factors
24
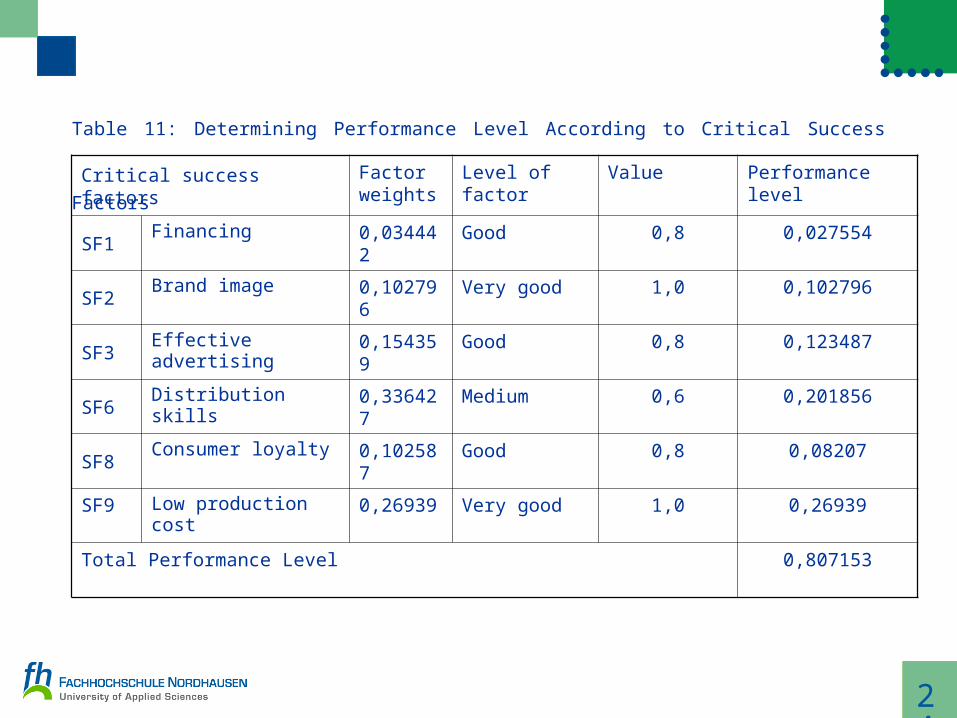
Table 11: Determining Performance Level According to Critical Success Factors
Critical success factorsFactor weights
Level of factor Value Performance level
SF1 Financing 0,034442 Good 0,8 0,027554
SF2Brand image 0,102796 Very good 1,0 0,102796
SF3Effective advertising 0,154359 Good 0,8 0,123487
SF6Distribution skills 0,336427 Medium 0,6 0,201856
SF8Consumer loyalty 0,102587 Good 0,8 0,08207
SF9 Low production cost 0,26939 Very good 1,0 0,26939
Total Performance Level 0,807153
25
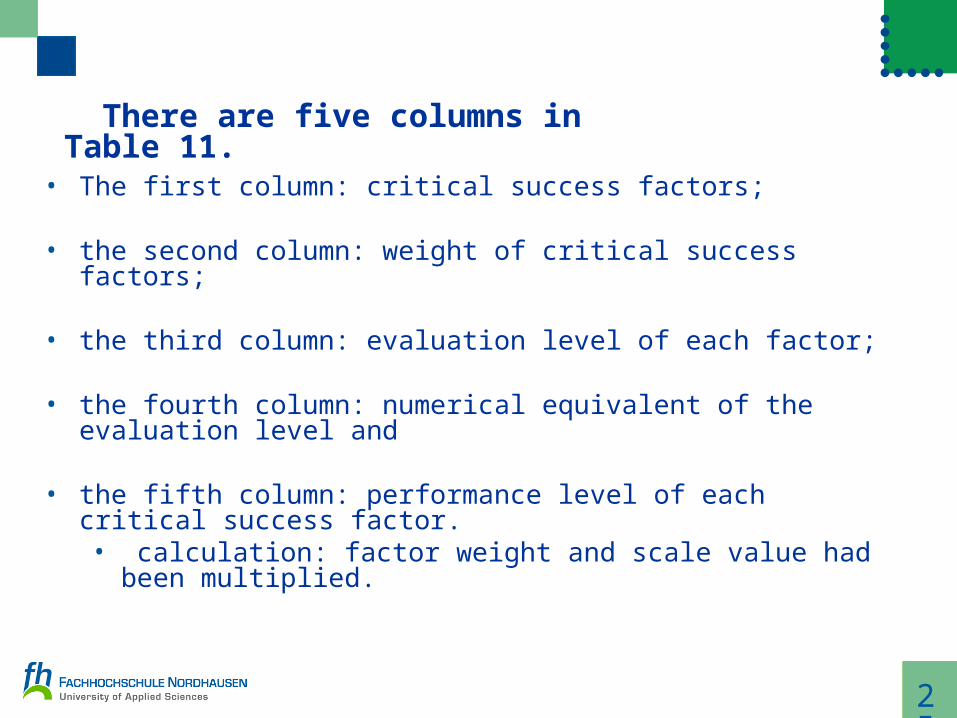
There are five columns in Table 11.
• The first column: critical success factors;
• the second column: weight of critical success factors;
• the third column: evaluation level of each factor;
• the fourth column: numerical equivalent of the evaluation level and
• the fifth column: performance level of each critical success factor. • calculation: factor weight and scale value had been
multiplied.
26
• In the last row, general performance level had been determined,
• The sum of performance level of each factor in fifth column was yielded general performance,
• This value takes a value between 0 and 1,
• If the value of the general performance level is close to 1, it means that organizational performance is excellent
27
• If the general performance level value is close to 0, this means that organizational performance is very bad,
• Of course, the decision and evaluation of organization management are also important,
• In other words, whether the level is considered sufficient or insufficient depends on the organizational management.
28
References
Caralli,R.A., 2004, The Critical Success Factor Method: Establishing a Foundation for Enterprise Security Management Technical Report.
Chow, T., Cao, D-C., 20007, A survey study of critical success factors in agile software projects, The Journal of Systems and Software.
Dağdeviren et al., 2009, Weapon selection using the AHP and TOPSIS methods under fuzzy environment, Expert Systems with Applications, 36(4), 8143-8151.
Daniel, D. R, 1961, Management Information Crisis, Harvard Business Review.
Hussey, D., (1998), Strategic Management; 4.ed., Butterwood Heinemann.
Hwang, C. L., & Yoon, K.,1981, Multiple attribute decision making: Methods and applications, A State of the Art Survey. New York: Springer-Verlag
29
Leidecker, JK., Bruno, A.V., (1984), “Identifying and using critical success factors”, Long Range Planning, 17, 23-32.
Ngai, E.W.T. Law, Wat, C.C.H. F.K.T. 200, Examining the critical success factors in the adoption of enterprise resource planning, Computers ın Industry, 59, 548-564
Park, K.S., Lee, J., 2009, A new method for estimating human error probabilities:AHP-SLIM, Reliability Engineering & System Safety,
Rockart, J.F. 1986, A Primer on Critical Success Factors" published in The Rise of Managerial Computing: The Best of the Center for Information Systems Research, edited with Christine V. Bullen. (Homewood, IL: Dow Jones-Irwin), 1981, OR, McGraw-Hill School Education Group..
Saaty, T.L., 1980, The analytic hierarchy process. New York:McGraw-Hill Inc.,
Ülgen, H., Mirze, S. K., 2007, İşletmelerde Stratejik Yönetim, Literatür Yayınları, İstanbul.