Embed Size (px)
Citation preview
1
Critical Electricity Pricing IssuesCritical Electricity Pricing Issues
DME Portfolio Committee23 May 2007
2
THE BRIEF
To address the committee on the following:
• Affordability, reliability and accesibility to electricity for all South Africans;
• The Eskom price increase of 18% - what informed this significant increase;
• The Eskom view on the pricing methodology developed by NERSA
3
20000
22000
24000
26000
28000
30000
32000
34000
36000
38000
40000
42000
19
88
19
89
19
90
19
91
19
92
19
93
19
94
19
95
19
96
19
97
19
98
19
99
20
00
20
01
20
02
20
03
20
04
20
05
20
06
20
07
Year
Pe
ak
De
ma
nd
an
d C
ap
ac
ity
(M
W)
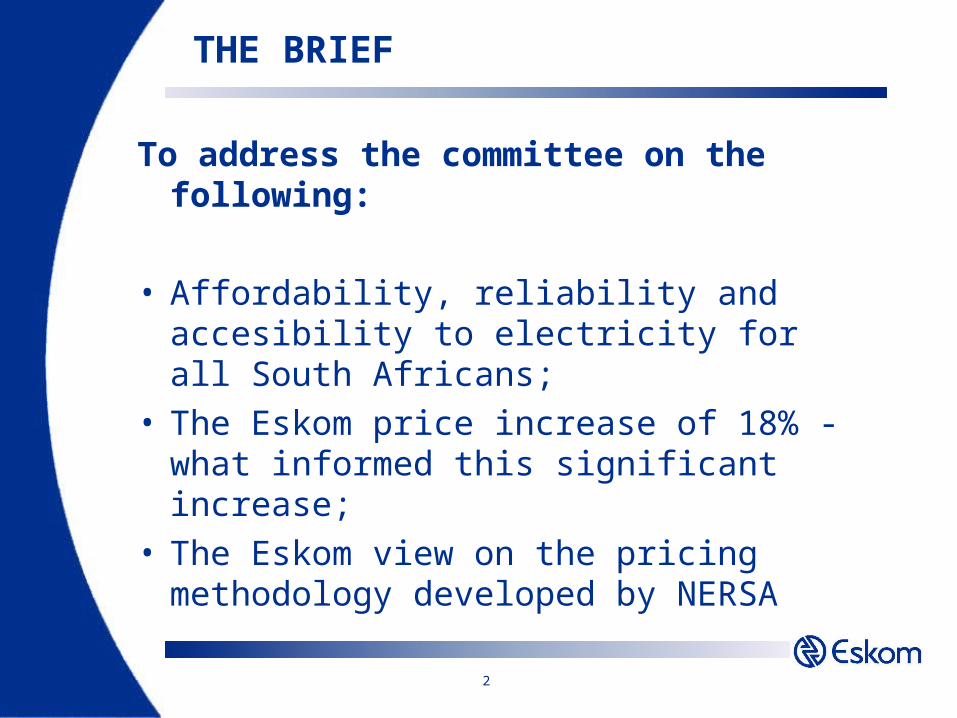
Peak Demand Expected Peak Demand
Installed Capacity (MW Sent-out) Operational Capacity (MW Sent-out)
Peak demand (MW)
Reserve margin = 25%
Reserve margin = 20%
Reserve margin = 16%
Reserve margin aspiration = 15%
Reserve margin
= 8-10%
4
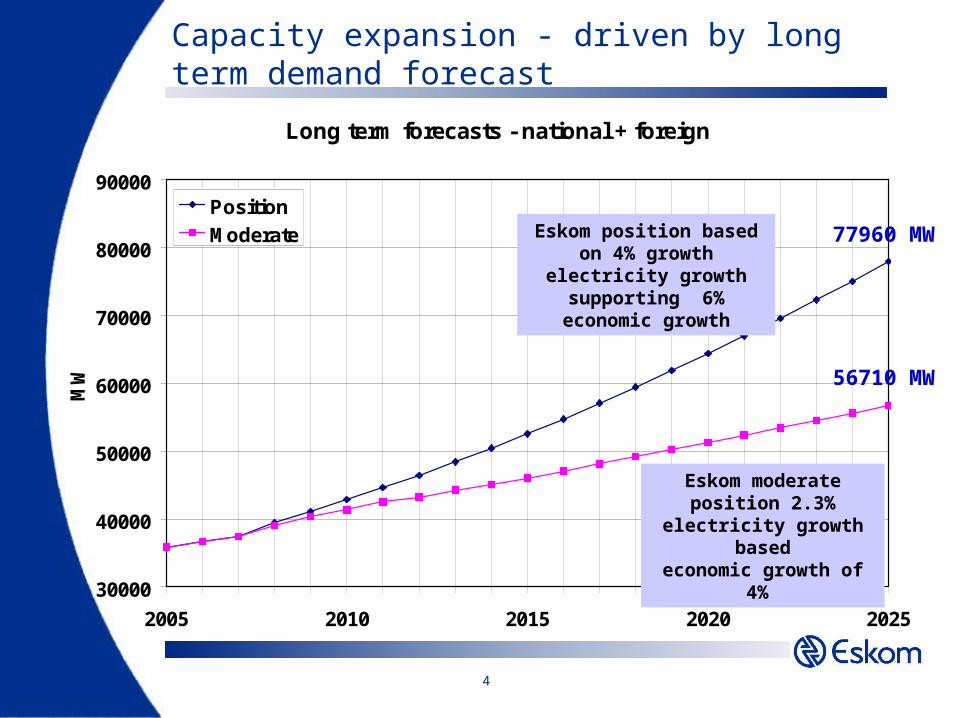
Capacity expansion - driven by long term demand forecast
Long term forecasts - national + foreign
30000
40000
50000
60000
70000
80000
90000
2005 2010 2015 2020 2025
MW
Position
Moderate Eskom position based on 4% growth electricity
growth supporting 6%economic growth
77960 MW
56710 MW
Eskom moderate position 2.3% electricity
growth basedeconomic growth of 4%

5
Capital Expenditure - R150bn
72% Mothballed stations 2 Coal base load stations Hydro and gas options Nuclear plant Refurbishment 2%
14% Lines and cables Network improvements Refurbishment
12% Network strengthening Cater for growth Refurbishment
Generation
Transmission
Distribution
Corporate
6
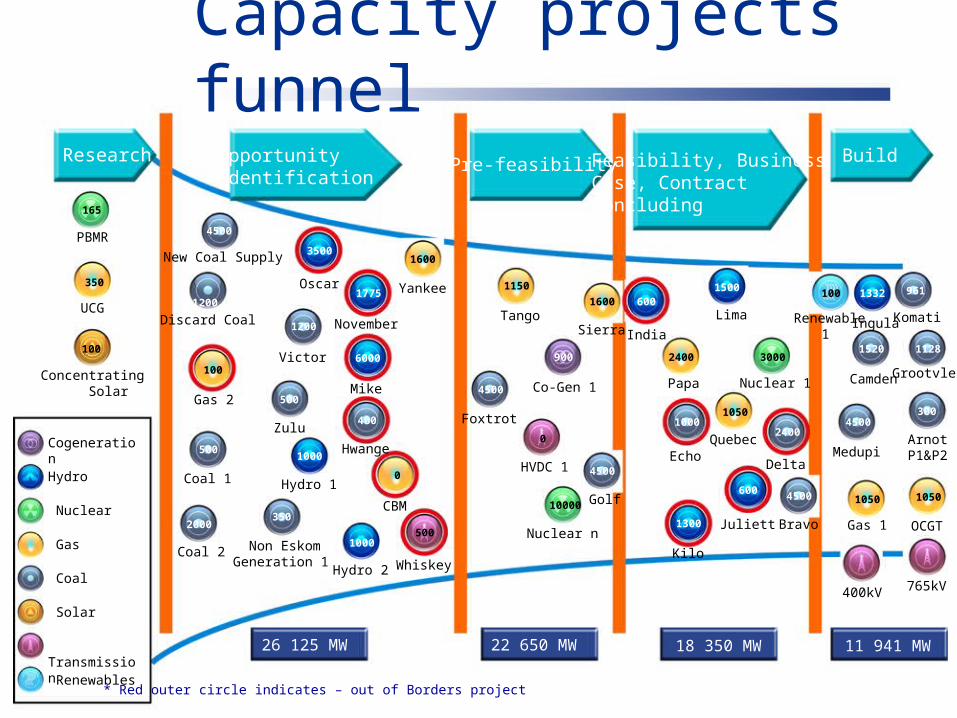
Research
PBMR
UCG
Concentrating Solar
CogenerationHydro
Nuclear
Gas
Coal
Solar
Transmission Renewables
* Red outer circle indicates – out of Borders project
OpportunityIdentification
New Coal Supply
Oscar Yankee
Discard Coal November
Victor
Gas 2
Zulu
Mike
Hwange
Coal 1 Hydro 1
CBM
Coal 2 Non EskomGeneration 1
Hydro 2 Whiskey
26 125 MW
Pre-feasibility
TangoSierra
Co-Gen 1
Foxtrot
HVDC 1
Golf
Nuclear n
22 650 MW
4500
35001600
1200
1775
1200
100 6000
500
400
500 1000
0
2000350
1000500
165
350
100
1150
1600
900
4500
0
4500
10000
Feasibility, Business Case, ContractConcluding
India
Lima
Papa Nuclear 1
EchoQuebec
Delta
Juliett
Kilo
Bravo
600 1500
2400 3000
1000 1050
2400
600
1300
4500
18 350 MW
Build
Renewable1
Ingula Komati
Camden Grootvlei
MedupiArnotP1&P2
Gas 1 OCGT
400kV 765kV
11 941 MW
100 1332 961
1520 1128
4500300
1050 1050
Capacity projects funnel

7
Generation Major Projects Major Generation Projects
Project Type Project Approva
l R billion
MW Approval Date
1st Unit Project Completio
n
Camden Coal 5.2 1 600 Dec-03 Jul-05 Mar-08
Grootvlei Coal 4.8 1 200 Dec-03 Sep-07 Oct-09
Komati Coal 6.1 1 000 Dec-04 Sep-08 Oct-11
Medupi Coal 78.6 4 500 Dec-05 Apr-11 Jan-15
Arnot Coal 1.0 300 Jun-05 Apr-06 Nov-10
Commercial wind Wind 1.1 100 Dec-06 Dec-09 Dec-10
Angerlik & Gourikwa (OCGT)
Gas 3.5 1 050 Jun-05 Jan-07 May-07
GAS 1 Gas 4.3 1 050 Aug-06 May-08 Sep-08
Ingula Pump storage
8.9 1 332 Mar-06 Mar-12 Dec-12
Kriel refurbishment Coal 1.6 - Dec-04 Nov-06 Nov-11
Matla refurbishment Coal 1.9 - Dec-06 Apr-09 Apr-14
Majuba Rail Railway 1.9 - Dec-04 N/A Dec-09
Bravo * Coal 84.8 5160 Mar-07 Mar-12 Dec-15
Total 203.6
* Awaiting PFMA approval

8
Transmission projects
BLOEMFONTEIN
DE AAR
KOMATIPOORT
RICHARD'S BAY
WITBANK
Namibia
Botswana
Mozambique
Swaziland
CAPE TOWN
DURBAN
EAST LONDON
PORT ELIZABETH
PRETORIA
DE AAR
Mercury
Perseus
Hydra
Gamma
Omega
Kudu
2009
2009
2009
2010
765 kV
400 kV
Matimba2009/10 for integration
of project Alpha
Marang
Dinaledi
Grassridge
Eros
Delphi
Neptune2010
2007
BEAUFORT WEST
Juno
Bloemfontein
2009
2009
9
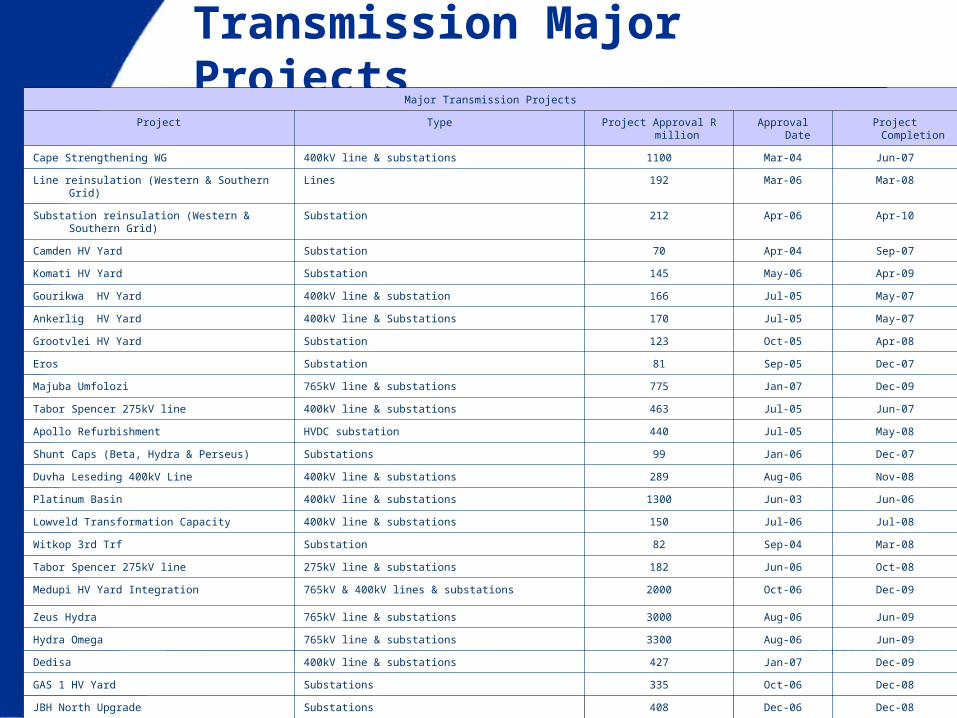
Transmission Major Projects
Major Transmission Projects
Project Type Project Approval R million
Approval Date Project Completion
Cape Strengthening WG 400kV line & substations 1100 Mar-04 Jun-07
Line reinsulation (Western & Southern Grid) Lines 192 Mar-06 Mar-08
Substation reinsulation (Western & Southern Grid)
Substation 212 Apr-06 Apr-10
Camden HV Yard Substation 70 Apr-04 Sep-07
Komati HV Yard Substation 145 May-06 Apr-09
Gourikwa HV Yard 400kV line & substation 166 Jul-05 May-07
Ankerlig HV Yard 400kV line & Substations 170 Jul-05 May-07
Grootvlei HV Yard Substation 123 Oct-05 Apr-08
Eros Substation 81 Sep-05 Dec-07
Majuba Umfolozi 765kV line & substations 775 Jan-07 Dec-09
Tabor Spencer 275kV line 400kV line & substations 463 Jul-05 Jun-07
Apollo Refurbishment HVDC substation 440 Jul-05 May-08
Shunt Caps (Beta, Hydra & Perseus) Substations 99 Jan-06 Dec-07
Duvha Leseding 400kV Line 400kV line & substations 289 Aug-06 Nov-08
Platinum Basin 400kV line & substations 1300 Jun-03 Jun-06
Lowveld Transformation Capacity 400kV line & substations 150 Jul-06 Jul-08
Witkop 3rd Trf Substation 82 Sep-04 Mar-08
Tabor Spencer 275kV line 275kV line & substations 182 Jun-06 Oct-08
Medupi HV Yard Integration 765kV & 400kV lines & substations 2000 Oct-06 Dec-09
Zeus Hydra 765kV line & substations 3000 Aug-06 Jun-09
Hydra Omega 765kV line & substations 3300 Aug-06 Jun-09
Dedisa 400kV line & substations 427 Jan-07 Dec-09
GAS 1 HV Yard Substations 335 Oct-06 Dec-08
JBH North Upgrade Substations 408 Dec-06 Dec-08
Total 15509

10
50% from retained earnings
50% from debt of which
At least 25% from the domestic market
Long tenors (matches our assets), best value, no currency risk
Up to 25% from international markets
Various instruments - Export Credit Agency, Bonds, Private placements
Funding strategy
11
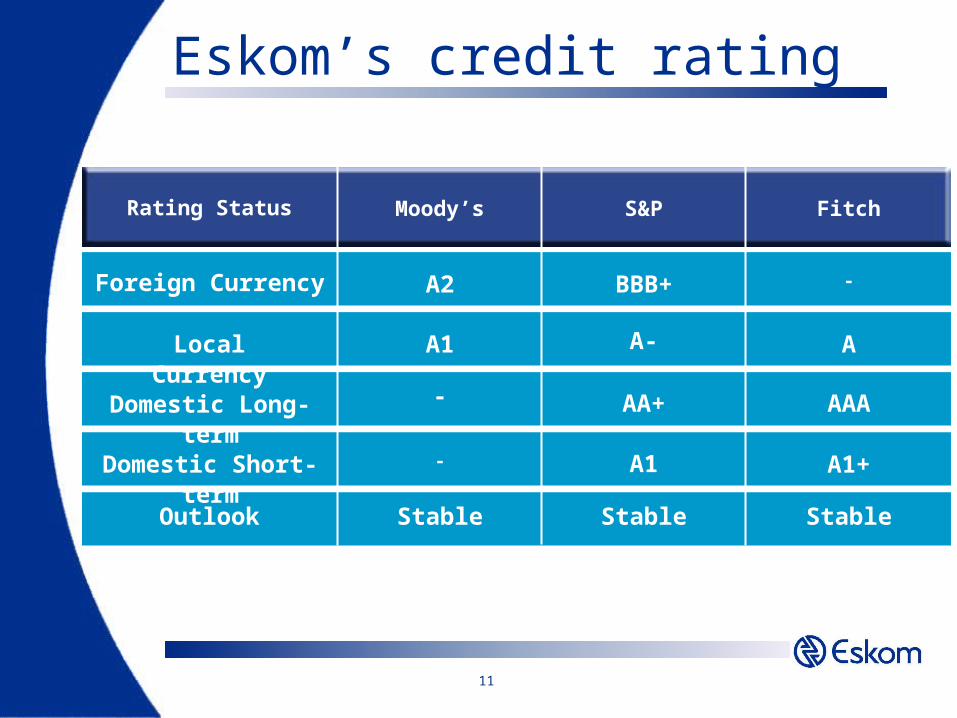
Rating Status Moody’s S&P Fitch
Foreign Currency
Local Currency
Domestic Long-term
Domestic Short-term
Outlook
A2
A1
-
-
Stable Stable Stable
BBB+
A-
AA+
A1
-
A
AAA
A1+
Eskom’s credit rating
12
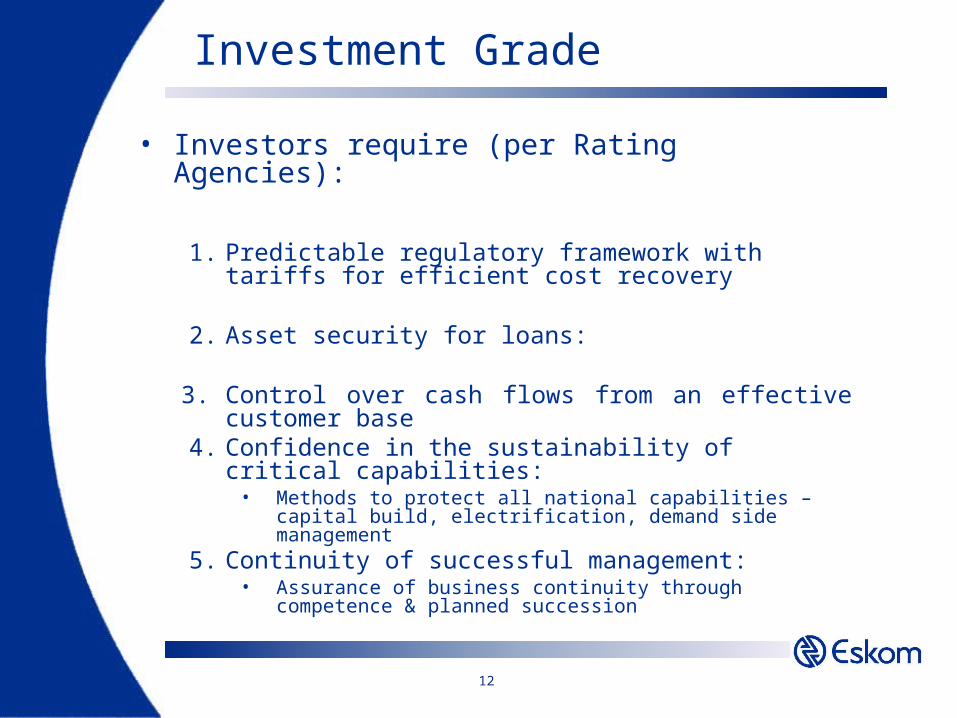
Investment Grade
• Investors require (per Rating Agencies):
1. Predictable regulatory framework with tariffs for efficient cost recovery
2. Asset security for loans:
3. Control over cash flows from an effective customer base
4. Confidence in the sustainability of critical capabilities:
• Methods to protect all national capabilities – capital build, electrification, demand side management
5. Continuity of successful management: • Assurance of business continuity through
competence & planned succession
13
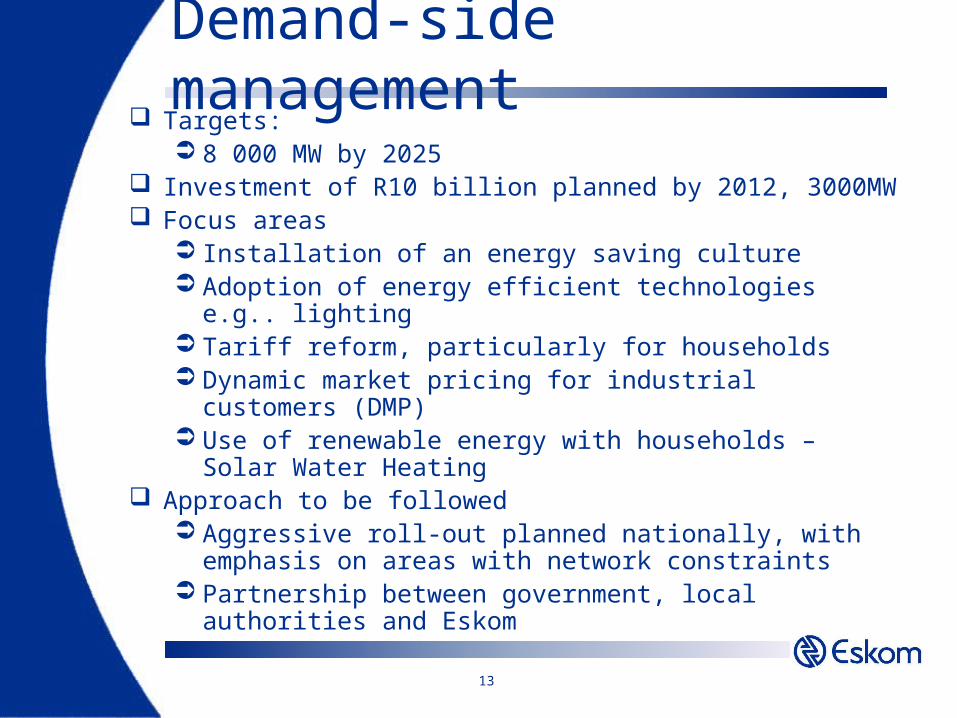
Demand-side management
Targets: 8 000 MW by 2025
Investment of R10 billion planned by 2012, 3000MW Focus areas
Installation of an energy saving culture Adoption of energy efficient technologies e.g..
lighting Tariff reform, particularly for households Dynamic market pricing for industrial customers
(DMP) Use of renewable energy with households – Solar
Water Heating Approach to be followed
Aggressive roll-out planned nationally, with emphasis on areas with network constraints
Partnership between government, local authorities and Eskom

14
Our competitive advantage will continue into the future
0
2
4
6
8
10
12
14
16D
enm
ark
Ital
y
UK
Net
her
lan
ds
Fra
nce
Bel
giu
m
Ger
man
y
Sp
ain
US
A
Fin
lan
d
Sw
eden
Can
ada
Au
stra
lia
So
uth
Afr
ica
US
cen
ts p
er k
Wh
Source NUS April 2006
Restricted and Confidential
South Africa 30% cheaper than Australia

15
Mining cost: Unpredictable cost inflation…
Most recent data from Stats SA
SA mining costs have increased by 25,7% since Oct. 2005.
SA coal costs (for SA consumption) have increased by 18,2% since Oct. 2005.
Stats SA’s coal cost index was increasing at only 3,3% (year on year) at the time Eskom lodged its revenue application to the NER in 2005.
0.00%
5.00%
10.00%
15.00%
20.00%
25.00%
30.00%
PPI Mining &Quarrying*
PPI Coal only
* Includes coal, metal ores, and other minerals
25.7%
18.2%

16
Price of Electricity in real c/kWh new
31
24
28
18 1821
19
24
18 18
23
20
0
5
10
15
20
25
30
35
'2006/7 '2007/8 '2008/9 '2009/10 '2010/11 '2011/12
cen
ts/k
Wh
New Entrance Gx New Entrance Total GTD
NERSA (no change) MYPD Rule Change
Restricted and Confidential
17
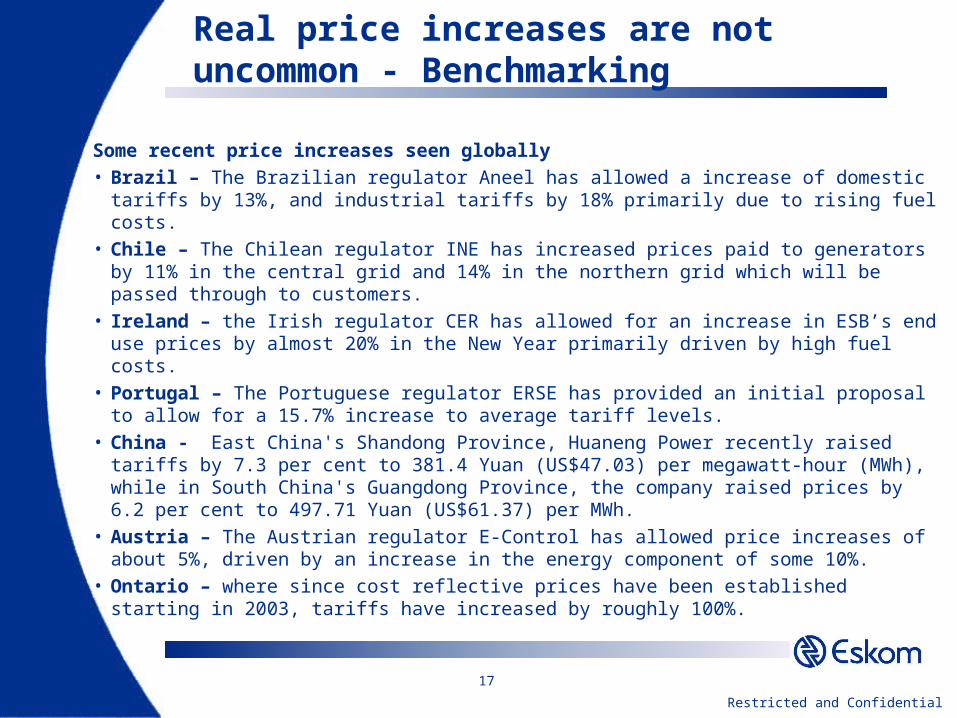
Real price increases are not uncommon - Benchmarking
Some recent price increases seen globally• Brazil – The Brazilian regulator Aneel has allowed a increase of domestic
tariffs by 13%, and industrial tariffs by 18% primarily due to rising fuel costs.• Chile – The Chilean regulator INE has increased prices paid to generators by
11% in the central grid and 14% in the northern grid which will be passed through to customers.
• Ireland – the Irish regulator CER has allowed for an increase in ESB’s end use prices by almost 20% in the New Year primarily driven by high fuel costs.
• Portugal – The Portuguese regulator ERSE has provided an initial proposal to allow for a 15.7% increase to average tariff levels.
• China - East China's Shandong Province, Huaneng Power recently raised tariffs by 7.3 per cent to 381.4 Yuan (US$47.03) per megawatt-hour (MWh), while in South China's Guangdong Province, the company raised prices by 6.2 per cent to 497.71 Yuan (US$61.37) per MWh.
• Austria – The Austrian regulator E-Control has allowed price increases of about 5%, driven by an increase in the energy component of some 10%.
• Ontario – where since cost reflective prices have been established starting in 2003, tariffs have increased by roughly 100%.
Restricted and Confidential
18
Key Strategic Issues
•Affordability•Industry viability•Internationally competitive prices
19
Conclusion Achievement of the capacity expansion programme objectives is non negotiable Eskom plan cater for higher economic growth Eskom always ensure a long term view of the industry Maintain our position of being the world’s lowest cost producer South Africa to remain an attractive investment destination for energy intensive industry

20
Restricted and Confidential
Thank YouThank You