Embed Size (px)
Citation preview
1
Continuous Improvement
Mapping the Process
Module 1.05
Lean Sigma Associates Ltd.
Accelerating Growth

2
Content
• Understand a process• The elements of a process• The proper level of detail• Types of process maps• Creating a process map
3
Objectives
Understand the need to map business processes Describe each symbol and its function Understand the different maps and how they are
used Create a process map (s)
4
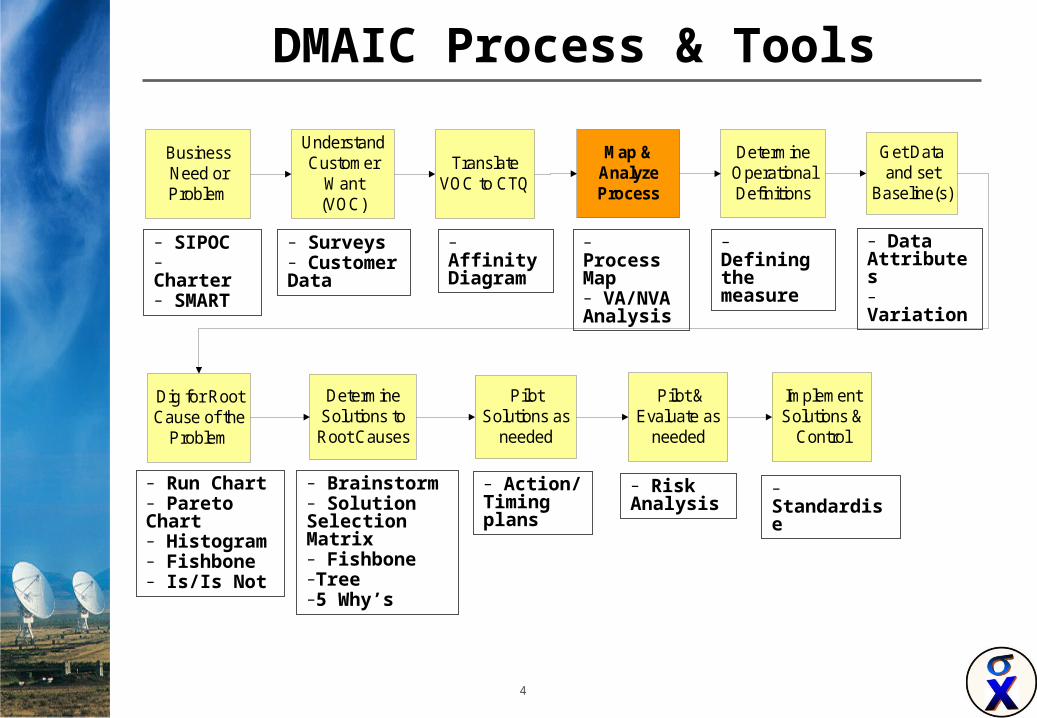
DMAIC Process & Tools
BusinessNeed orProblem
UnderstandCustomer
Want(VOC)
Map &AnalyzeProcess
TranslateVOC to CTQ
DetermineOperationalDefinitions
Get Dataand set
Baseline(s)
DetermineSolutions toRoot Causes
PilotSolutions as
needed
Pilot &Evaluate as
needed
ImplementSolutions &
Control
Dig for RootCause of the
Problem
– SIPOC– Charter– SMART
– Surveys– Customer Data
– Process Map– VA/NVA Analysis
– Run Chart– Pareto Chart– Histogram– Fishbone– Is/Is Not
– Brainstorm– Solution Selection Matrix– Fishbone–Tree–5 Why’s
– Risk Analysis
– Affinity Diagram
– Data Attributes– Variation
– Defining the measure
– Action/ Timing plans
– Standardise
5
Why Understand a Process
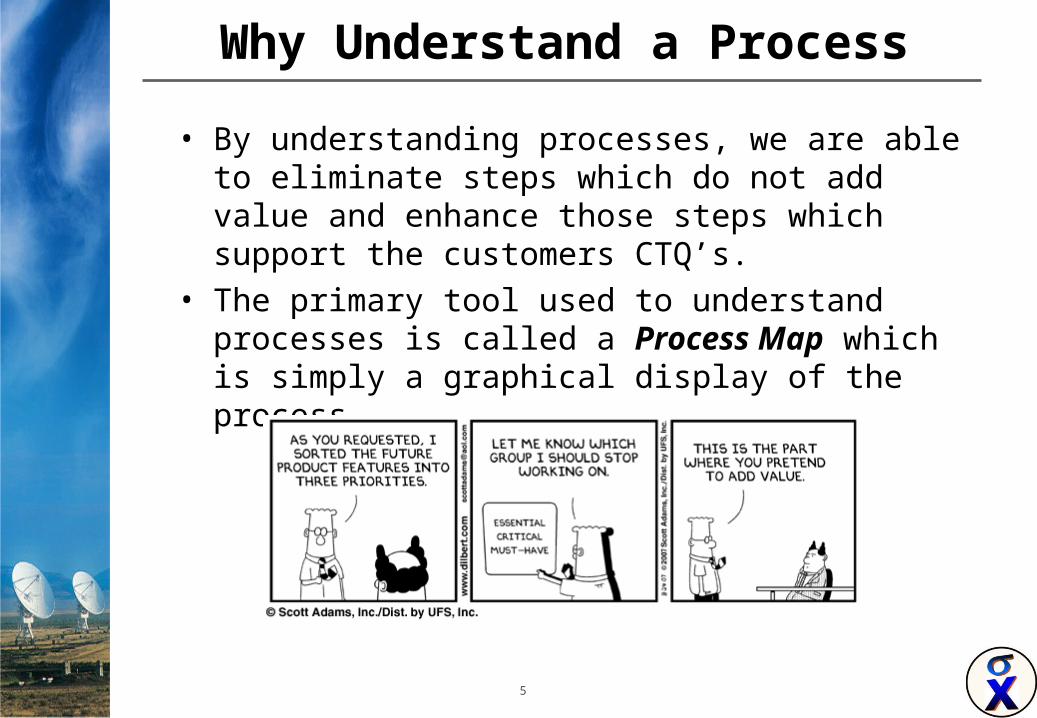
• By understanding processes, we are able to eliminate steps which do not add value and enhance those steps which support the customers CTQ’s.
• The primary tool used to understand processes is called a Process Map which is simply a graphical display of the process.
6
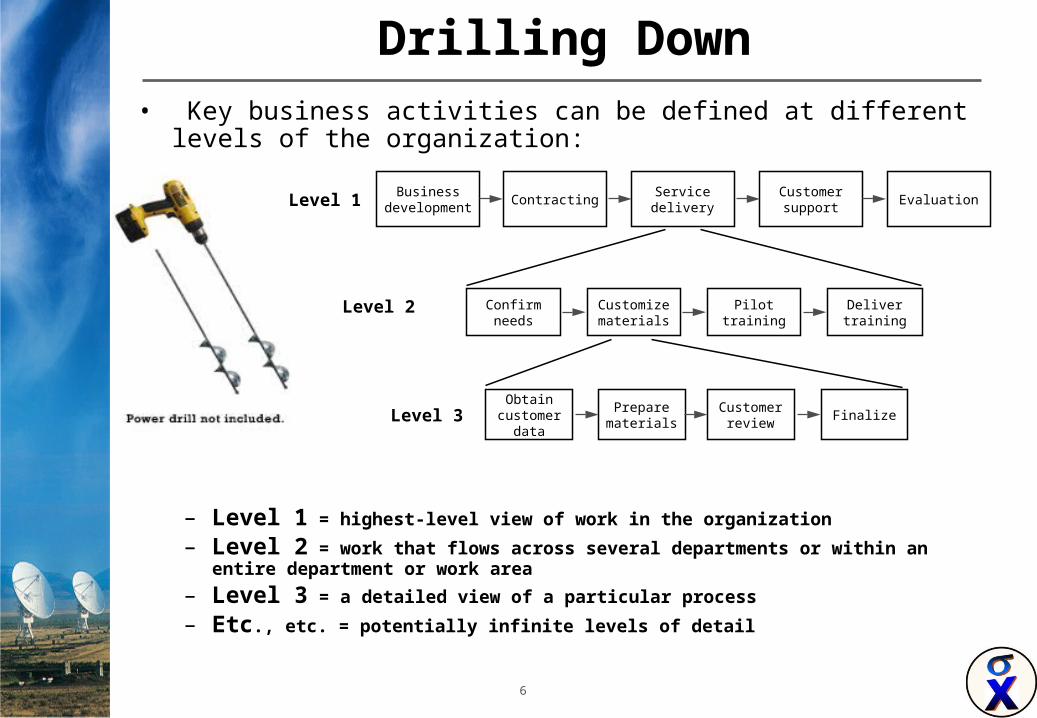
Drilling Down• Key business activities can be defined at different levels of the
organization:
– Level 1 = highest-level view of work in the organization
– Level 2 = work that flows across several departments or within an entire department or work area
– Level 3 = a detailed view of a particular process
– Etc., etc. = potentially infinite levels of detail
Businessdevelopment
ContractingServicedelivery
Customersupport
Evaluation
Confirmneeds
Customizematerials
Pilottraining
Delivertraining
Obtaincustomer
data
Preparematerials
Customerreview
Finalize
Level 1
Level 2
Level 3
7
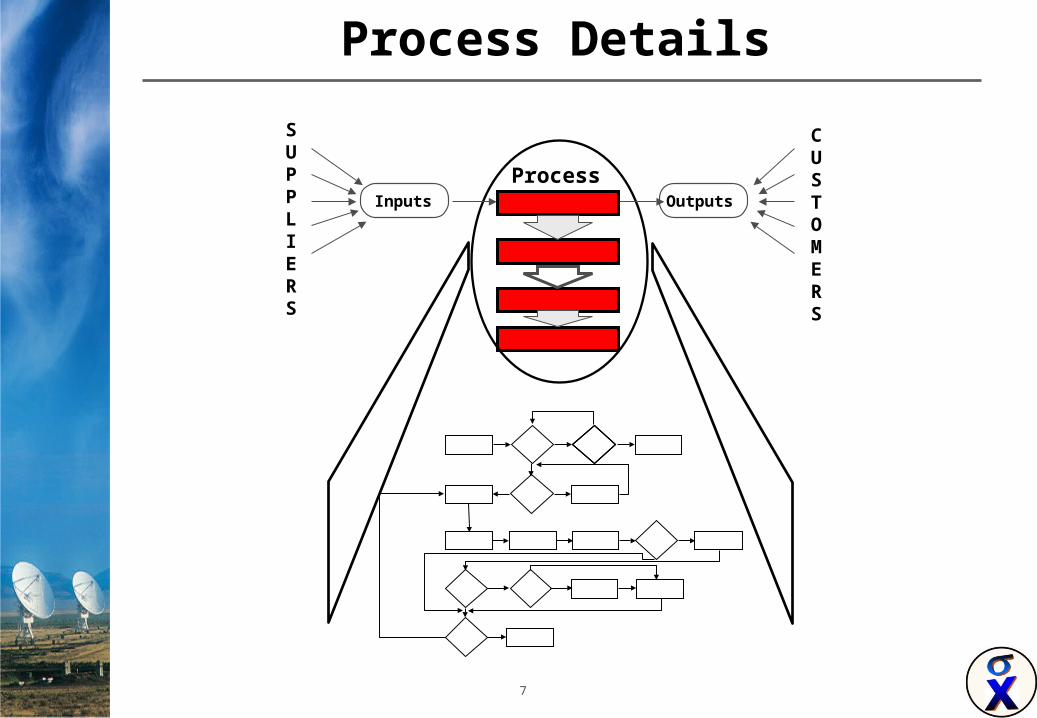
Process Details
SUPPLIERS
Inputs
CUSTOMERS
Outputs
Process
8
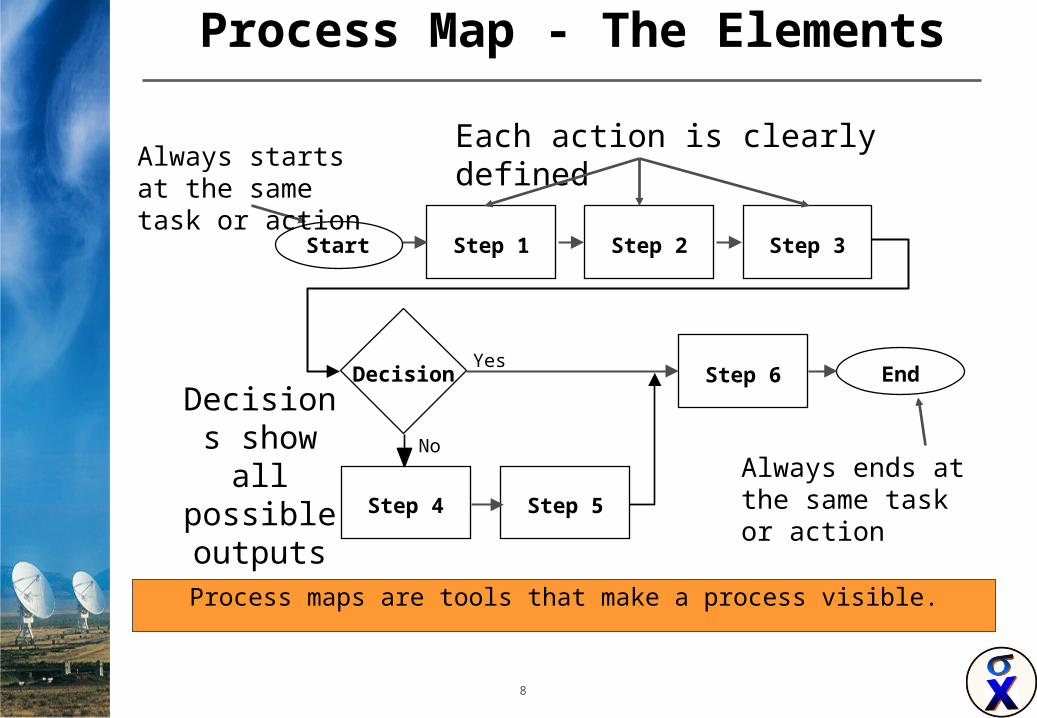
Process Map - The Elements
Start
EndDecisionYes
No
Step 6
Step 5Step 4
Step 3Step 2Step 1
Always ends at the same task or action
Each action is clearly defined
Decisions show all possible outputs
Always starts at the same task or action
Process maps are tools that make a process visible.
9
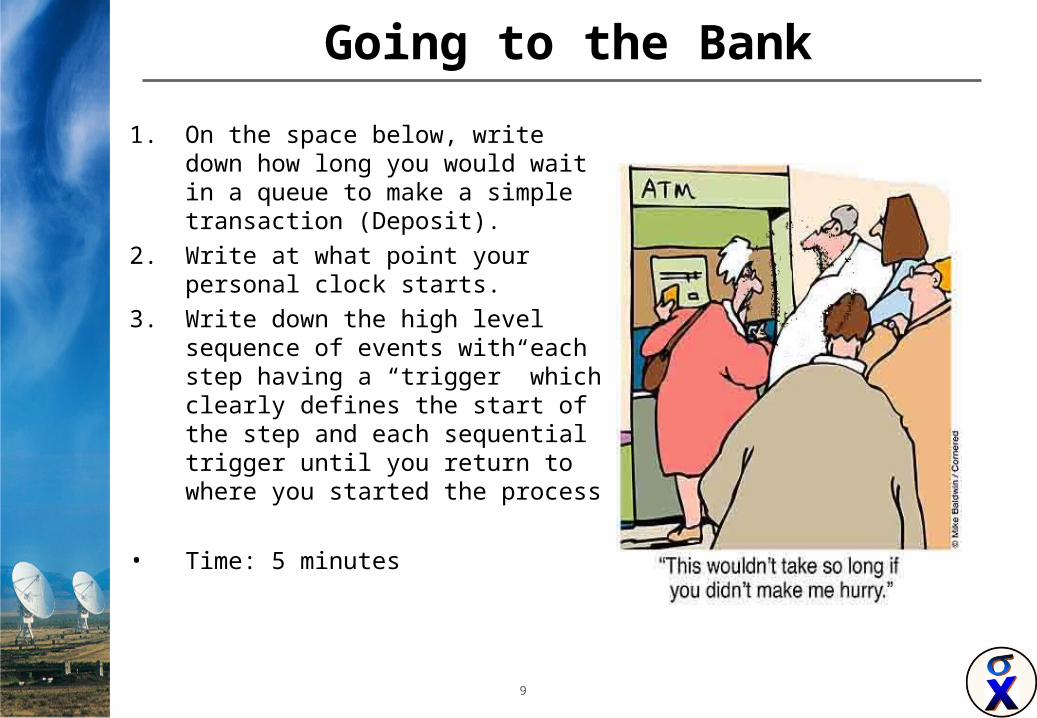
Going to the Bank
1. On the space below, write down how long you would wait in a queue to make a simple transaction (Deposit).
2. Write at what point your personal clock starts.
3. Write down the high level sequence of events with each step having a “trigger” which clearly defines the start of the step and each sequential trigger until you return to where you started the process
• Time: 5 minutes
10
Standard Symbols MatrixName Standard
(Y/N)Application Description Symbol
Decision Yes Primarily for Y/N decisions; however, can be used for multiple options based on the decision necessary.
Diamond
Refer to Other Process
Yes Use for other pre-defined processes that interact with the process. These other business as usual processes are not detailed since they are not changing as a result of the project.
Flag
Process Step Yes Identifies step in the process. Box
Database Yes Identifies the system or database completing the associated activity.
Disk
Termination No Identifies the end of the processes. Oval
Connector Yes Connects processes within the process. Include alpha label within each connector and a page number reference if the process connects to a different page. Include ‘From’ and ‘To’ in page connectors.
Circle
Metric Yes Labels the locations in a process flow diagram identifying a key process performance metric.
Measure

11
The Beginning
• Your starting point should be well defined, such as when the patient calls. This “trigger” or input is repeatable every time.
• How you determine the starting and stopping points for each task or ‘box’ is up to you and your team. Be sure to use logical triggers to separate each step. For making a patient appointment.
StartPhone rings
Step 1Answer phone
12
Step 1 to Step 2
Step 2Step 1
Step 1: (Answer phone) Phone rings, phone is answered, information is taken from patient, look for opening in schedule end step 1.
Step 2: Check schedule based on patients time frame, find date and check to see if it is acceptable to patient, end step 2
The end point of a step is the ‘trigger’ for the following step
13
Decision
Step 3Decision
No
Step 3a
Yes
Step 4
Step 3: Time acceptable to patient?, if yes go to step 4 if no go to step 3a
Decisions can be either yes/no or good/bad, and can have more than 2 possible outcomes. What about a decision based on payment type, how many possible outcomes are there?
14
Process Flow Development
• Process flows show the sequence of individual steps and decisions, and who is responsible for them.
• Each step should be specific and action oriented, generally including a verb.– Answer the phone, Make Appointment, Fulfill Service,
Send invoice, etc.• Symbols are used to illustrate the process flow, decision points,
and activities performed.• Process flows generally take considerable time to prepare, but
they are extremely useful in understanding a process prior to attempting improvements. They require input from people familiar with each area of the process.
15
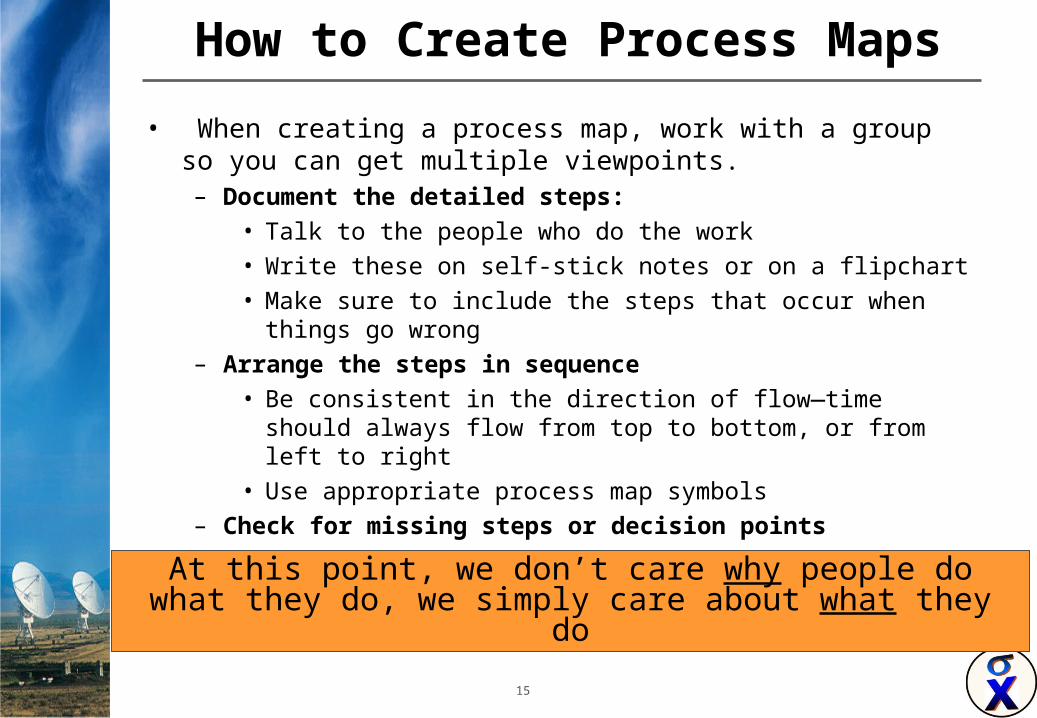
How to Create Process Maps
• When creating a process map, work with a group so you can get multiple viewpoints.– Document the detailed steps:
• Talk to the people who do the work
• Write these on self-stick notes or on a flipchart
• Make sure to include the steps that occur when things go wrong
– Arrange the steps in sequence
• Be consistent in the direction of flow—time should always flow from top to bottom, or from left to right
• Use appropriate process map symbols
– Check for missing steps or decision points
At this point, we don’t care why people do what they do, we simply care about what they do
16
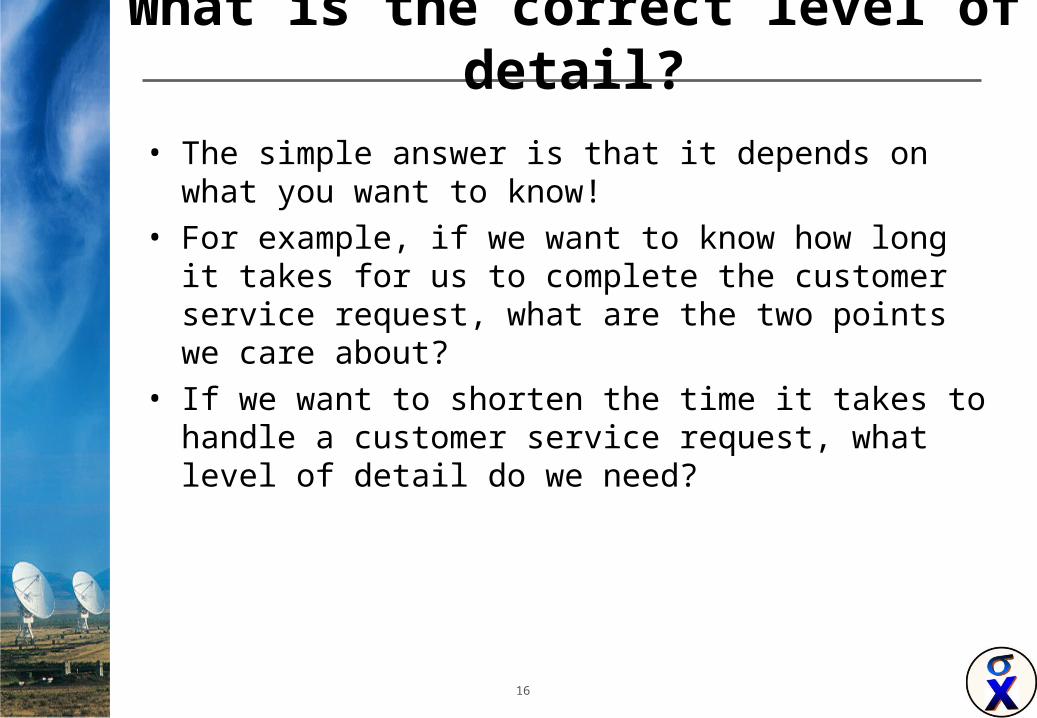
What is the correct level of detail?
• The simple answer is that it depends on what you want to know!
• For example, if we want to know how long it takes for us to complete the customer service request, what are the two points we care about?
• If we want to shorten the time it takes to handle a customer service request, what level of detail do we need?
17
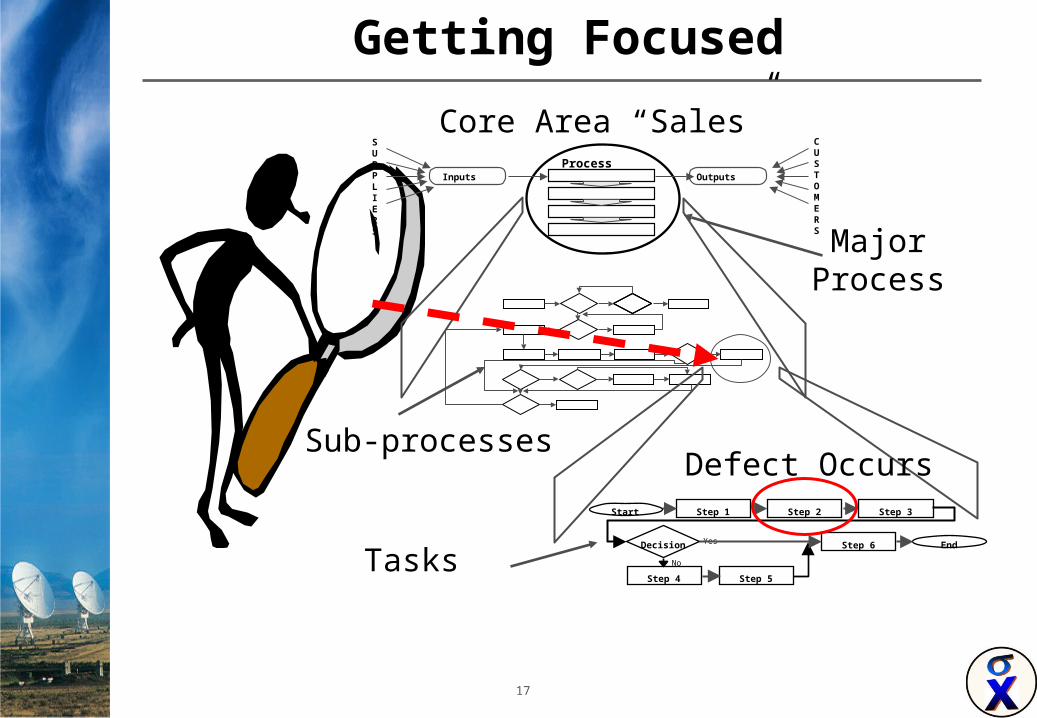
Getting Focused
SUPPLIERS
Inputs
CUSTOMERS
OutputsProcess
Start
EndDecision Yes
No
Step 6
Step 5Step 4
Step 3Step 2Step 1
Core Area “Sales”
Major Process
Sub-processes
Tasks
Defect Occurs
18
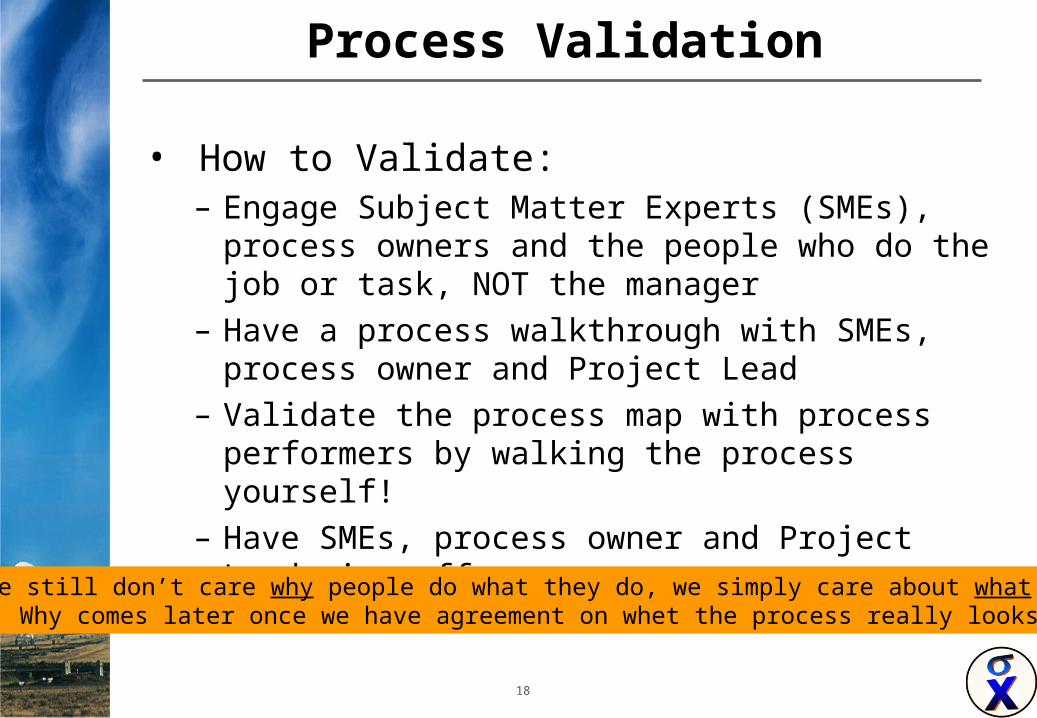
Process Validation
• How to Validate: – Engage Subject Matter Experts (SMEs), process
owners and the people who do the job or task, NOT the manager
– Have a process walkthrough with SMEs, process owner and Project Lead
– Validate the process map with process performers by walking the process yourself!
– Have SMEs, process owner and Project Lead sign-off on process maps
We still don’t care why people do what they do, we simply care about what they do.Why comes later once we have agreement on whet the process really looks like
19
Types of Process Maps
20
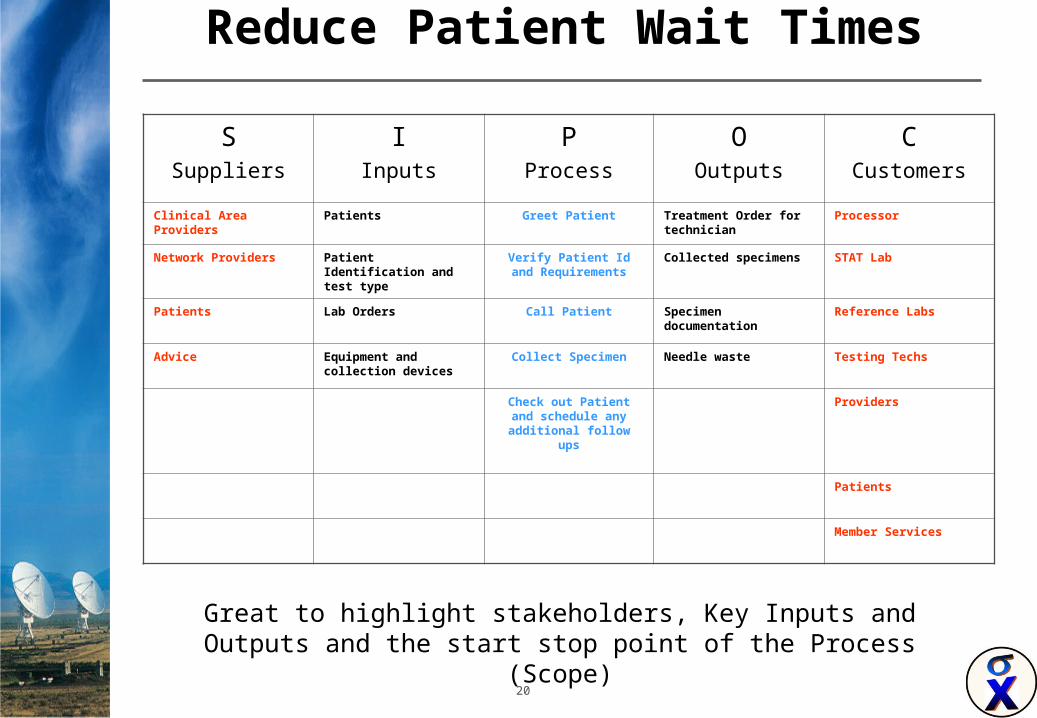
Reduce Patient Wait Times
SSuppliers
IInputs
PProcess
OOutputs
CCustomers
Clinical Area Providers Patients Greet Patient Treatment Order for technician
Processor
Network Providers Patient Identification and test type
Verify Patient Id and Requirements
Collected specimens STAT Lab
Patients Lab Orders Call Patient Specimen documentation Reference Labs
Advice Equipment and collection devices
Collect Specimen Needle waste Testing Techs
Check out Patient and schedule any additional
follow ups
Providers
Patients
Member Services
Great to highlight stakeholders, Key Inputs and Outputs and the start stop point of the Process (Scope)

21
Top Down Flowchart
RequestRequestPrepPrep
UnitUnitReviewReview
FunctionFunctionReviewReview
InternalInternalSourcingSourcing
ExternalExternalSourcingSourcing
InterviewInterview OfferOfferNewNew
EmployeeEmployeeOrientationOrientation
ReviewReview““Short”Short”
ListList
ReviewReviewStarSearchStarSearch
DataData
Post onPost onJobNetJobNet
ReviewReviewJobNetJobNet
ResponsesResponses
CoordinateCoordinateWithWith
Curr. Sup.Curr. Sup.
ChooseChooseJobJob
ClassClass
EnterEnterDescrip.Descrip.
EnterEnterDetailsDetails
EnterEnterCloseCloseDateDate
SubmitSubmittoto
publishpublish
22
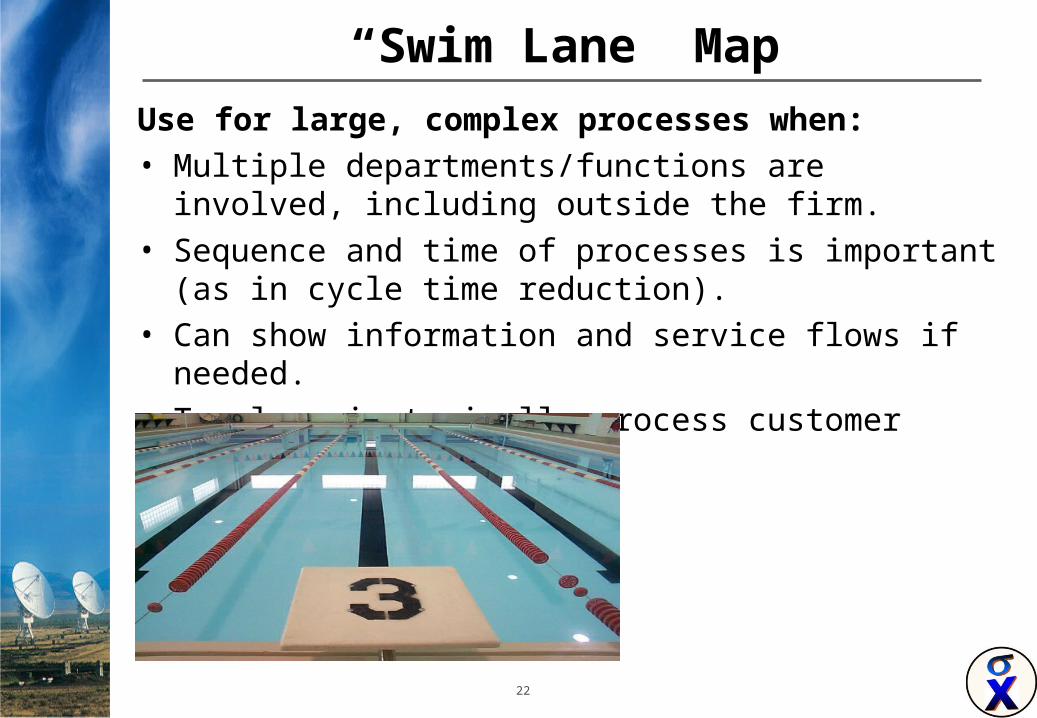
“Swim Lane” Map
Use for large, complex processes when:• Multiple departments/functions are involved, including
outside the firm.• Sequence and time of processes is important (as in cycle
time reduction).• Can show information and service flows if needed.• Top lane is typically process customer
23
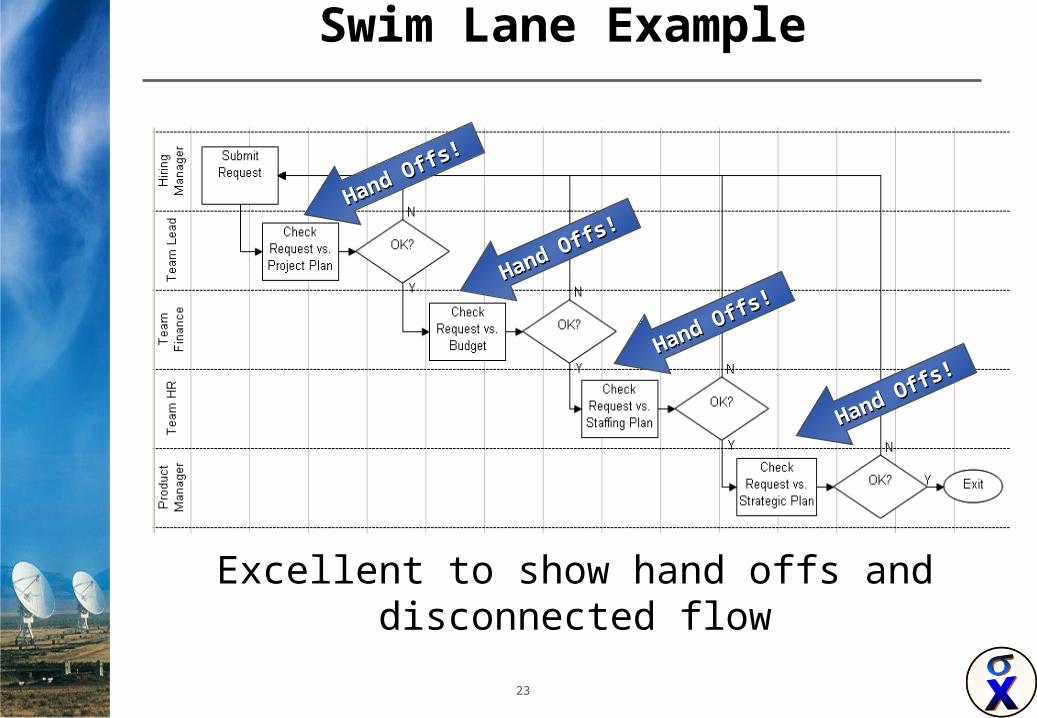
Swim Lane Example
Hand Offs!
Hand Offs!
Hand Offs!
Hand Offs!
Hand Offs!
Hand Offs!
Hand Offs!
Hand Offs!
Excellent to show hand offs and disconnected flow
24
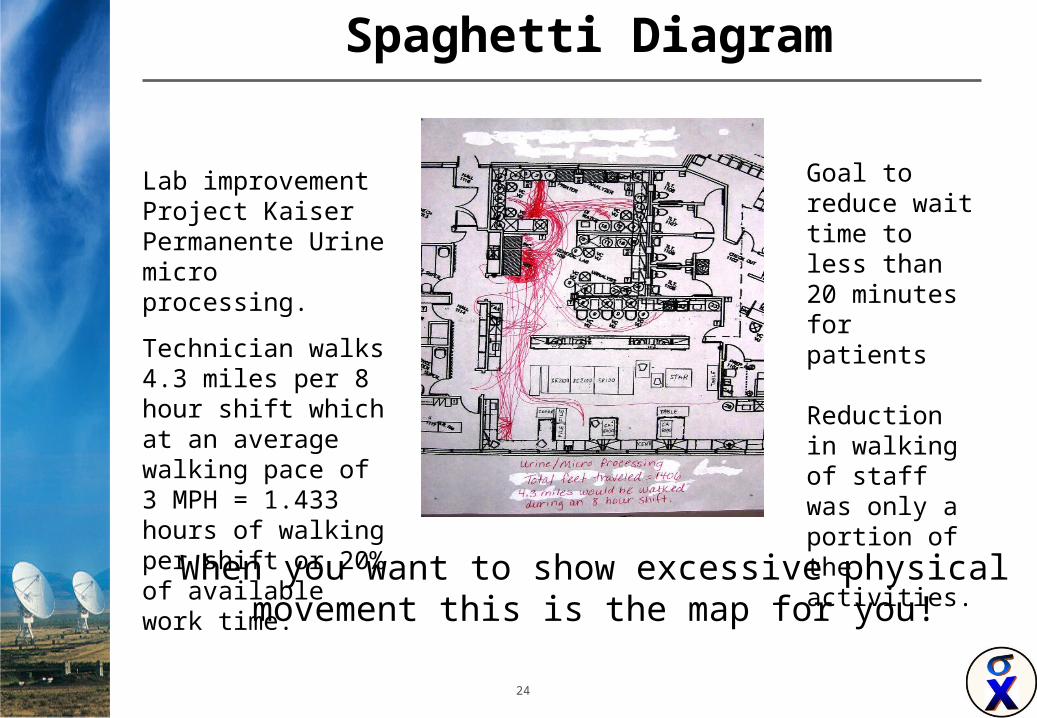
Spaghetti Diagram
When you want to show excessive physical movement this is the map for you!
Lab improvement Project Kaiser Permanente Urine micro processing.
Technician walks 4.3 miles per 8 hour shift which at an average walking pace of 3 MPH = 1.433 hours of walking per shift or 20% of available work time.
Goal to reduce wait time to less than 20 minutes for patients
Reduction in walking of staff was only a portion of the activities.
25
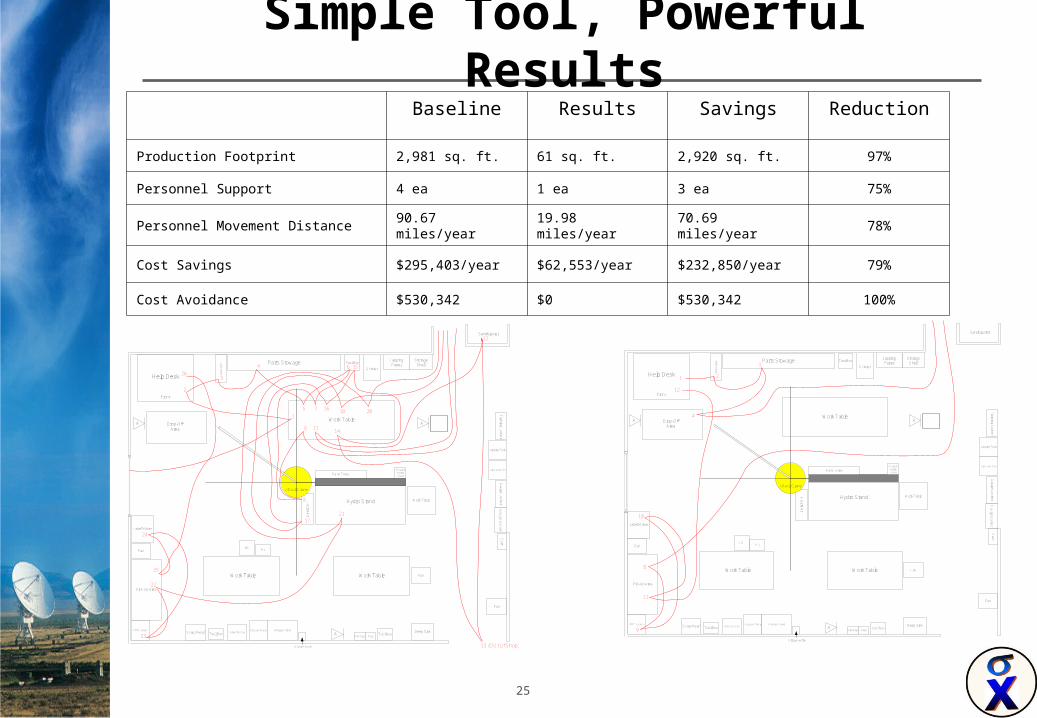
Simple Tool, Powerful Results
Tool Box
Pick-Up Area
Parts StowageGrinder
LappingPaper
StorageShelf
Asbestos Can
Fan
Scrap Metal
A
Work Table
Drop-OffArea
Work Table
HA
ZM
AT
Oily Rags RagsTool Box
Deep SinkA
FanHL PJ
Fan
Ga
ug
e L
ocke
r
Taps and Dies
Ca
rt
J-Davit Crane
Hydro Stand Work Table
Parts TotesPortableHydroStand
Label Maker
Ga
ug
e L
ocke
r
FME Locker
Lapping Tools
Sandblaster
A
Vacuum Pump Nitrogen Stand
Nitrogen Bottle
Job L
ocker
Front
Help Desk
Tool Box
Work Table
Tra
inin
g L
ocke
r
1 2
3
4
8
9
10
11
12
Tool Box
Pick-Up Area
Parts StowageGrinder
LappingPaper
StorageShelf
Asbestos Can
Fan
Scrap Metal
A
Work Table
Drop-OffArea
Work Table
HA
ZM
AT
Oily Rags RagsTool Box
Deep SinkA
FanHL
PJ
Fan
Ga
ug
e L
ocke
r
Taps and Dies
Ca
rt
J-Davit Crane
Hydro Stand Work Table
Parts TotesPortableHydroStand
Label Maker
Ga
ug
e L
ocke
r
FME Locker
Lapping Tools
Sandblaster
A
Vacuum Pump Nitrogen Stand
Nitrogen Bottle
Job L
ocke
r
Front
Help Desk
Tool Box
Work Table
Tra
inin
g L
ocke
r
1
2
3
4
5
6
7
8
9 11
12
13 (OUt of Shop)
14
15
16
17
18 20
21
22
23
24
25
26
Baseline Results Savings Reduction
Production Footprint 2,981 sq. ft. 61 sq. ft. 2,920 sq. ft. 97%
Personnel Support 4 ea 1 ea 3 ea 75%
Personnel Movement Distance 90.67 miles/year 19.98 miles/year 70.69 miles/year 78%
Cost Savings $295,403/year $62,553/year $232,850/year 79%
Cost Avoidance $530,342 $0 $530,342 100%
26
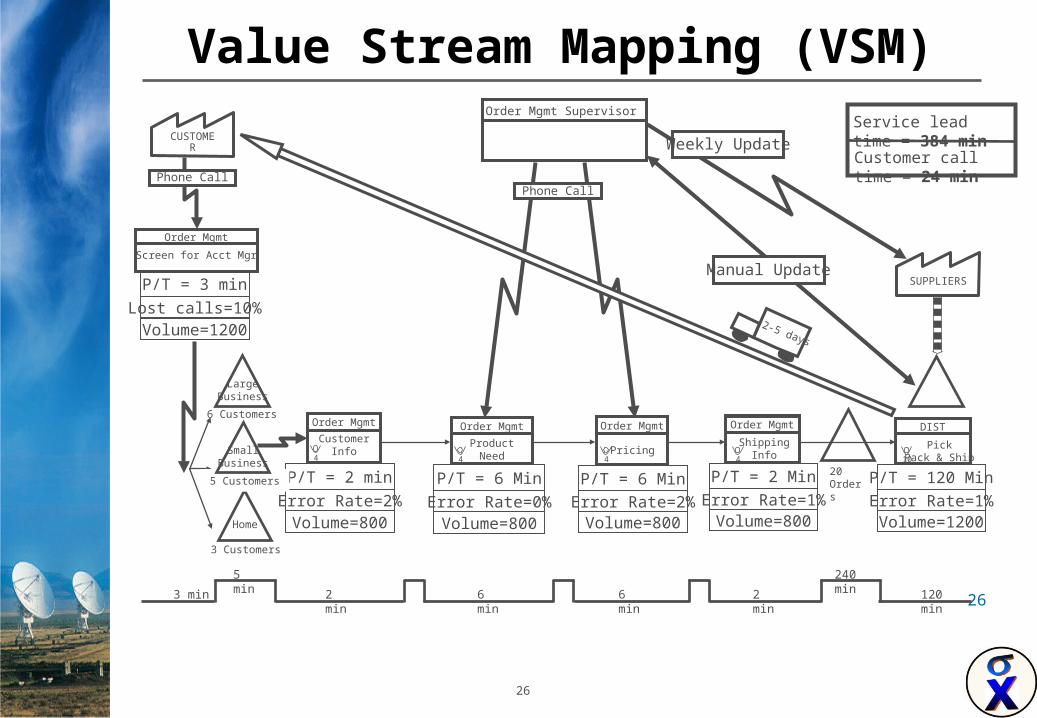
Value Stream Mapping (VSM)
26
Order Mgmt Supervisor
CUSTOMER
DISTOrder MgmtOrder MgmtOrder Mgmt Order Mgmt
Screen for Acct Mgr
Order Mgmt
P/T = 2 min
Error Rate=2%Volume=800
P/T = 6 Min
Error Rate=0%Volume=800
P/T = 6 MinError Rate=2%Volume=800
P/T = 2 Min
Error Rate=1%Volume=800
20 Orders
3 min
Phone Call
LargeBusiness
Home
6 Customers
5 Customers
3 Customers
SmallBusiness
CustomerInfo
4
ProductNeed4
Pricing4
ShippingInfo4
P/T = 3 min
Lost calls=10%Volume=1200
PickPack & Ship
P/T = 120 Min
Error Rate=1%Volume=1200
10
2 min
6 min
6 min
2 min 120 min
240 min
5 min
Customer call time = 24 min
Service lead time = 384 min
SUPPLIERS
2-5 days
Manual Update
Weekly Update
Phone Call
27
Technique
Initially, it is much more important that you use the process mapping tool to help you depict the process you are investigation, regardless of map symbol.
Later as your skills increase and there is a particularly good reason to make a particular type of map and/or symbols, stick to keeping things simple.
28
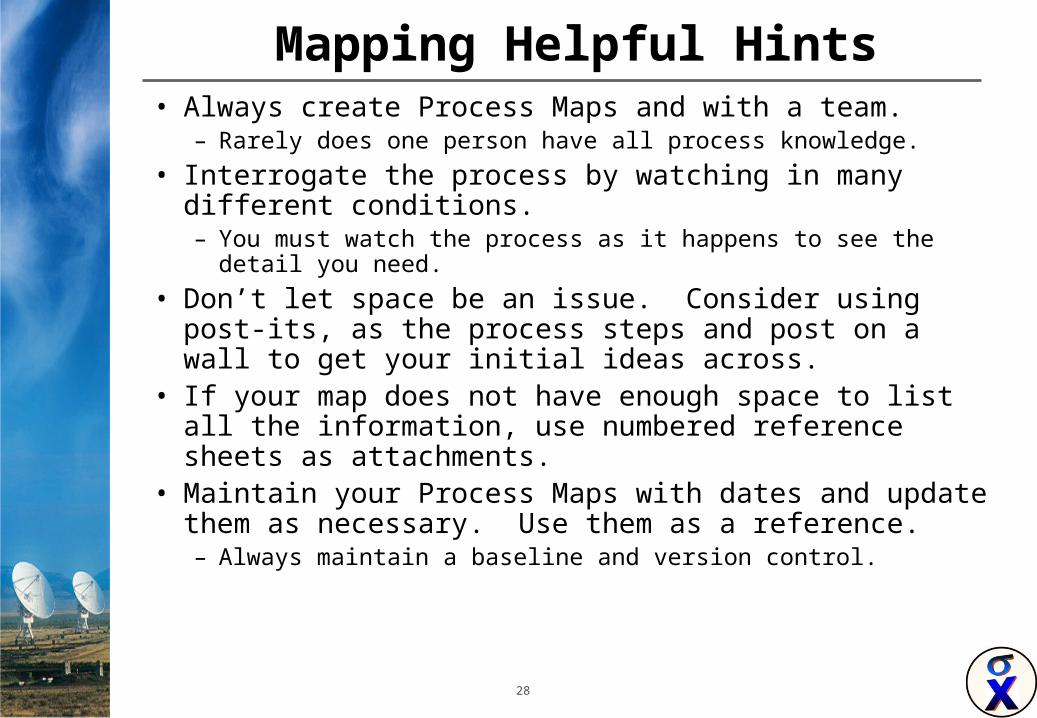
Mapping Helpful Hints• Always create Process Maps and with a team.
– Rarely does one person have all process knowledge.
• Interrogate the process by watching in many different conditions. – You must watch the process as it happens to see the detail you need.
• Don’t let space be an issue. Consider using post-its, as the process steps and post on a wall to get your initial ideas across.
• If your map does not have enough space to list all the information, use numbered reference sheets as attachments.
• Maintain your Process Maps with dates and update them as necessary. Use them as a reference. – Always maintain a baseline and version control.
29
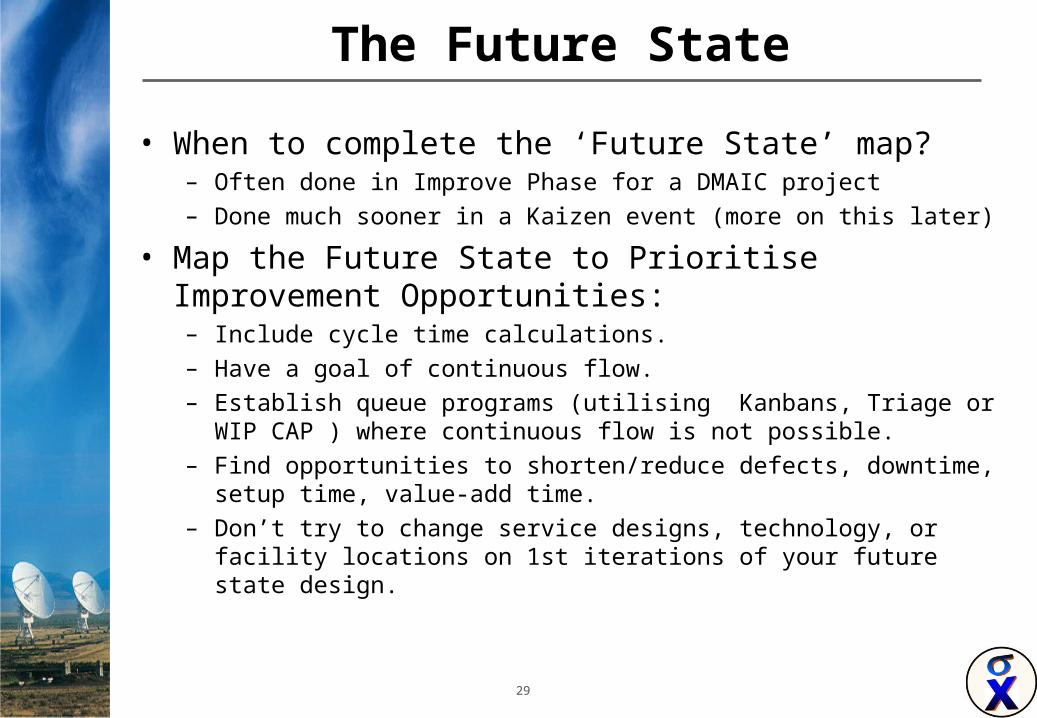
The Future State
• When to complete the ‘Future State’ map?– Often done in Improve Phase for a DMAIC project
– Done much sooner in a Kaizen event (more on this later)
• Map the Future State to Prioritise Improvement Opportunities:– Include cycle time calculations.
– Have a goal of continuous flow.
– Establish queue programs (utilising Kanbans, Triage or WIP CAP ) where continuous flow is not possible.
– Find opportunities to shorten/reduce defects, downtime, setup time, value-add time.
– Don’t try to change service designs, technology, or facility locations on 1st iterations of your future state design.
30
Questions About Future State
• What is the Takt Rate or cycle time?• Will I have a queue system or ship direct?• Where can I utilise continuous flow?• Where will I need replenishment pull systems?• At what single point will I schedule services?• How will I level the service mix at the
Bottleneck/Constraint?• What will be my project priority?
31
Use of Future State Map
• Prioritise Opportunities• “See” and Manage the Overall Material Flow• Communication of “the Future”• Create a Plan with Timeframes.
32
As Is, Future State, After
• In general you will have at the very minimum 3 process maps, but practicality and experience suggests that you will generate many more than that through the life of the project.
• The “As is” process map simply reflects the current state of the process, a snap shot always taken before any improvements have been started.
• Future State process map is one that you and your team generate to show what the process should look like if the documentation for how the process should be done actually happened.
• The After or “To Be” process map captures the process steps after improvement, ie. The new process.
• Once you have these maps you can compare or do a gap analysis to see where it is, to where it should be or will be. Remember, the goal is zero tolerance for waste as waste has a direct measurable cost to the business.
33
Creating Process Flows
Objective:– Create a process flow for Sigma Station.
Instructions:– Review the instructions and helpful hints from the previous
pages.
– ONLY using sticky notes:
• List each persons step in the process and label the white
paper from left to right
• Get copies of the ad request and the tools or templates you
use in Sigma Station
• List the steps on a sticky and fill in what you do to the
request as it goes through the process.
• Tape the tools templates and ad requests for each step
Time: 60 Minutes
34
Review and Transition
• In Process Mapping we learned:– How to define and map a process– Use symbols and determine the proper depth to evaluate– Know the different types of process maps– How to create a process map
• In Process Analysis, we will learn:– Define Value-Added– Describe the 7 types of waste & do a Value Analysis– Understand the fundamentals between Process Cycle Time, Work-In-Process
(WIP), and Throughput (Exit Rate)– Understand the concept of Process Cycle Efficiency and how it relates to Cycle
Time– Demonstrate the value of cycle time through exercises Understand and
calculate Process Cycle Time and Efficiency– Understand the difference between time traps and constraints and their effect
on capacity Process Analysis we will learn:


![(RON) 14AUG 0.95 1.01 1.05 1.05 1.05 1.04 2.3% PSB Industries [FR] 11.6x 1.3x … · 2017-08-14 · APS (RON) 0.95 1.01 1.05 1.05 1.05 1.04 2.3% 11.6x 1.3x ROaE À 8.2% 0.7% 0.8%](https://img.dokumen.tips/doc/110x75/5f7f1b4bb4b94c6a071b1181/ron-14aug-095-101-105-105-105-104-23-psb-industries-fr-116x-13x-2017-08-14.jpg)


![1.05 Mb [Download]](https://img.dokumen.tips/doc/110x75/587f2c131a28abb43f8bc435/105-mb-download.jpg)