Embed Size (px)
Citation preview

1
Constructing an Indoor Practice Facility at MSU: A Cost Benefit Analysis
Montana State University

2
Constructing an Indoor Practice Facility at MSU: A Cost Benefit Analysis
Introduction
Over the last couple of seasons, the Montana State University–Bozeman football program
has been quite successful on the field. The Bobcats won a share of the Big Sky Conference title
and made the NCAA FCS playoffs for both the 2010 and 2011 seasons. This success in 2010 led
to increased fan support and excitement about the program which prompted a fundraising effort
to expand the end zone of the existing football stadium at MSU. The private fundraising
campaign collected approximately $6 million. This was coupled with a loan from MSU which
allowed the $10 million project to commence in the summer of 2011. Interest in the team is near
an all-time high—nearly every game of the 2011 season was sold out.
Now that the stadium has been expanded, die-hard Bobcat football fans are suggesting
new projects for the athletic department to undertake in the future. A January 2012 thread on the
MSU Bobcat message board (bobcatnation.com) discussed two possibilities that the university
could undertake. One idea was to expand the east sideline stands and add skyboxes to match the
west side. This expansion would generate additional revenue for the stadium and cause the east
stands to match up with the new end zone. Another proposed idea was to build an indoor
football practice facility. This facility would be useful when the oft-inclement Bozeman weather
disrupts practice time in the latter part of the season. An indoor practice facility would consist of
a football field housed within a large warehouse-like building. Depending on the scope of the
facility, it could also include a running track, weight rooms, locker rooms, offices for the
coaching staff and administration, and possibly other features that would allow for the inclusion
of other sports. It would also allow the football team (and potentially other sports) to conduct
full practices at any time regardless of extreme weather events such as cold, snow, rain, wind, etc.

3
The facility would lead to the teams being better prepared for competition and hence have a
better chance of winning. A facility would also be a major recruiting tool for the coaches—they
could point to this facility as a symbol of MSU’s prestige and commitment to success. It would
increase the probability of landing higher quality athletes from around the country.
MSU football competes at the Division 1 level in the FCS (formerly 1-AA) subdivision.
Presently, indoor practice facilities are very rare at the FCS level (only six of the 126 teams have
such a facility). The FCS teams with a facility are Dartmouth, Maine, Northern Iowa, Penn,
Tennessee State, and Youngstown State. These schools (with the exception of Tennessee State)
are located in climates where late season weather could have an effect on practice time. The
teams with a facility are often competitive on a national scale. MSU would like to be a perennial
competitor at the national level and this is possible without a practice facility (the University of
Montana has accomplished this). However, the presence of a facility would do nothing but help
the competitiveness of MSU.
Due to the large costs of sports facilities, teams will often try to get the public to help pay
for them. The proponents argue that the facility will be a public good and benefit the community
as a whole. However, governments are not always very keen on paying for a team’s stadium.
For example, in April 2012 the Minnesota state legislature rejected a $975 million proposal to
help the Minnesota Vikings pay for a new stadium (Coss, 2012). Another current example is a
proposed basketball and hockey arena in Seattle. This facility has been met with heavy public
criticism as well. In these cases, it is not clear that the benefits a community will gain from the
facility outweigh the costs. These public proposals for team facility upgrades both failed and
succeeded at different times in history depending on public support. That is why a CBA would
be needed for the MSU facility as well; it would ensure that the project is socially beneficial.
4
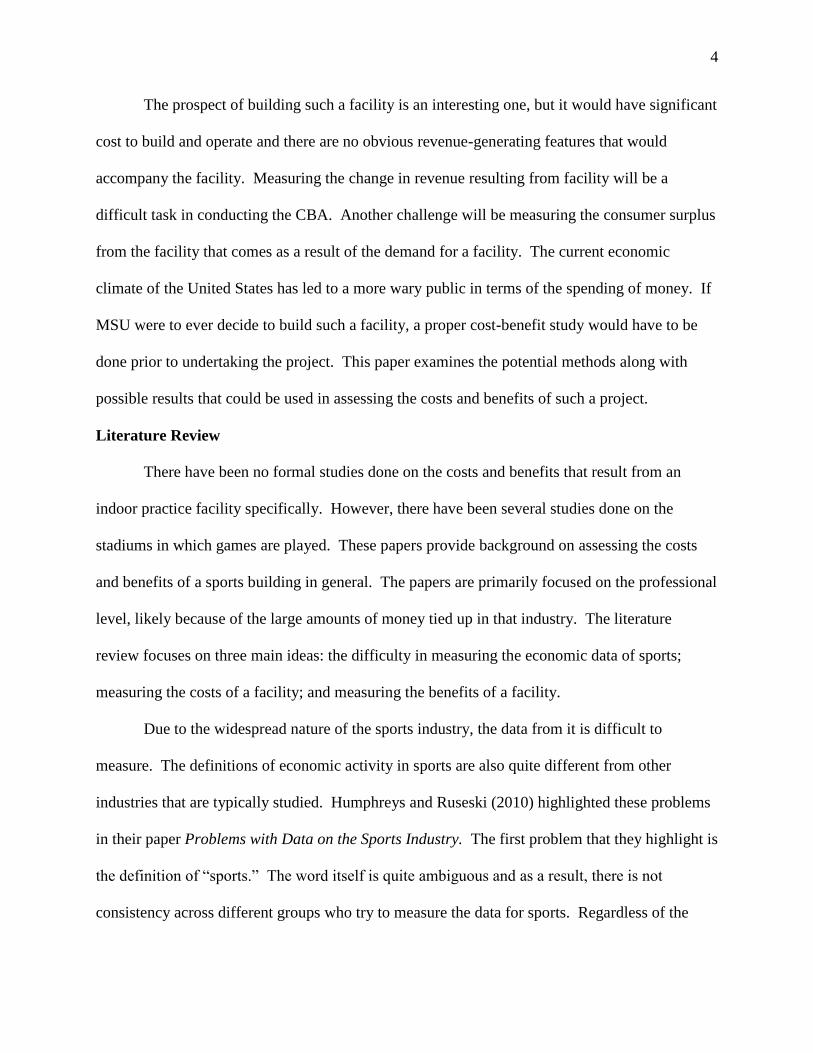
The prospect of building such a facility is an interesting one, but it would have significant
cost to build and operate and there are no obvious revenue-generating features that would
accompany the facility. Measuring the change in revenue resulting from facility will be a
difficult task in conducting the CBA. Another challenge will be measuring the consumer surplus
from the facility that comes as a result of the demand for a facility. The current economic
climate of the United States has led to a more wary public in terms of the spending of money. If
MSU were to ever decide to build such a facility, a proper cost-benefit study would have to be
done prior to undertaking the project. This paper examines the potential methods along with
possible results that could be used in assessing the costs and benefits of such a project.
Literature Review
There have been no formal studies done on the costs and benefits that result from an
indoor practice facility specifically. However, there have been several studies done on the
stadiums in which games are played. These papers provide background on assessing the costs
and benefits of a sports building in general. The papers are primarily focused on the professional
level, likely because of the large amounts of money tied up in that industry. The literature
review focuses on three main ideas: the difficulty in measuring the economic data of sports;
measuring the costs of a facility; and measuring the benefits of a facility.
Due to the widespread nature of the sports industry, the data from it is difficult to
measure. The definitions of economic activity in sports are also quite different from other
industries that are typically studied. Humphreys and Ruseski (2010) highlighted these problems
in their paper Problems with Data on the Sports Industry. The first problem that they highlight is
the definition of “sports.” The word itself is quite ambiguous and as a result, there is not
consistency across different groups who try to measure the data for sports. Regardless of the

5
exact definition used, the three measures that are often used for sports are total economic activity,
actual participation and attendance, and viewing and listening to the sports through different
media.
According to Humphreys and Ruseski (2010), the problem with measuring the direct
economic activity arises because the sport industry is not defined by the North American
Industrial Classification System (NAICS) and as a result, no data specific to sports is collected.
Also, at all levels of sports, the government is intertwined with the industry on the supply side;
they subsidize teams’ facilities and activities. This government involvement skews the data on
sports. On the demand side, much of the benefits come in the form of consumer surplus, which
is difficult to measure. Finally, much of the sports market involves non-traded goods and inputs
that have no market value (for example, consider the college athlete; there is no market value of
their labor, they are paid with education). All of these factors make the economic activity
measures for sports difficult to obtain.
Lastly, the Humphreys and Ruseski (2010) paper pointed out the difficulty in measuring
the economic activity derived from the viewing and listening to sports through various media.
There are issues that lead to skewed audience data. For one, the current viewership data does not
take into account for the length of time watched, merely whether or not the household watched
the event at all. Most other measures for economic data, factor in proportions (for example,
labor statistics distinguish between full-time and part-time labor). The sports data does not make
a similar distinction. Another issue arises from the multitasking environment of sports watching.
This makes the true opportunity cost of the activity difficult to assess. If a person cooks dinner
and watches sports at the same time, what should the person be measured as doing? Along with
these flaws (and others not mentioned), acquiring the data for viewership and listening is also

6
relatively expensive to obtain, making this measurement of sports data even more unpalatable.
Overall, sports data is expensive and difficult to obtain.
Sports facilities are often subsidized by local and state governments. When these
facilities are discussed before approval, the proponents have the tendency to underestimate the
costs to the public. In the paper Full Count: The Real Cost of Public Funding for Major League
Sports Facilities, Long (2005) discusses the ways in which the costs are often understated to the
public. First, the stadiums land and infrastructure costs are often not included in proposals.
These facilities are often constructed on public land. For some reason, the public does not
usually consider the cost of this land. The infrastructure costs are the additional public works
needed to make the facility possible, such as roads, sewer, and water. Second, the annual
operating costs are often unstated or ignored. Proponents often will bring up the benefits of
annual revenue and stadium naming rights without mentioning the costs. This misleads the
public into believing that the stadium will pay for itself after a certain number of years when it
simply is not the case. Lastly, the facility can cause a loss in property taxes to the city that is not
mentioned either. Even if these facilities are privately owned, there are tax exemptions available
because the owners can argue that they are intended for public use. Sports facilities costs’
should be fully accounted for before they are built, but they often are misrepresented.
The last portion of the literature review focused on measuring the benefits that result
from a sport facility. In the paper New Sports Stadiums, Community Self-esteem, and
Community Collective Conscience, Eckstein and Delaney (2002) asserted that building a stadium
rarely will benefit a city dollar-wise and because of that, proponents often have to turn to “non-
economic” methods to get support to build the facility. One such “non-economic” measure is the
community self-esteem derived from being a “big-league town.” The authors themselves were
7
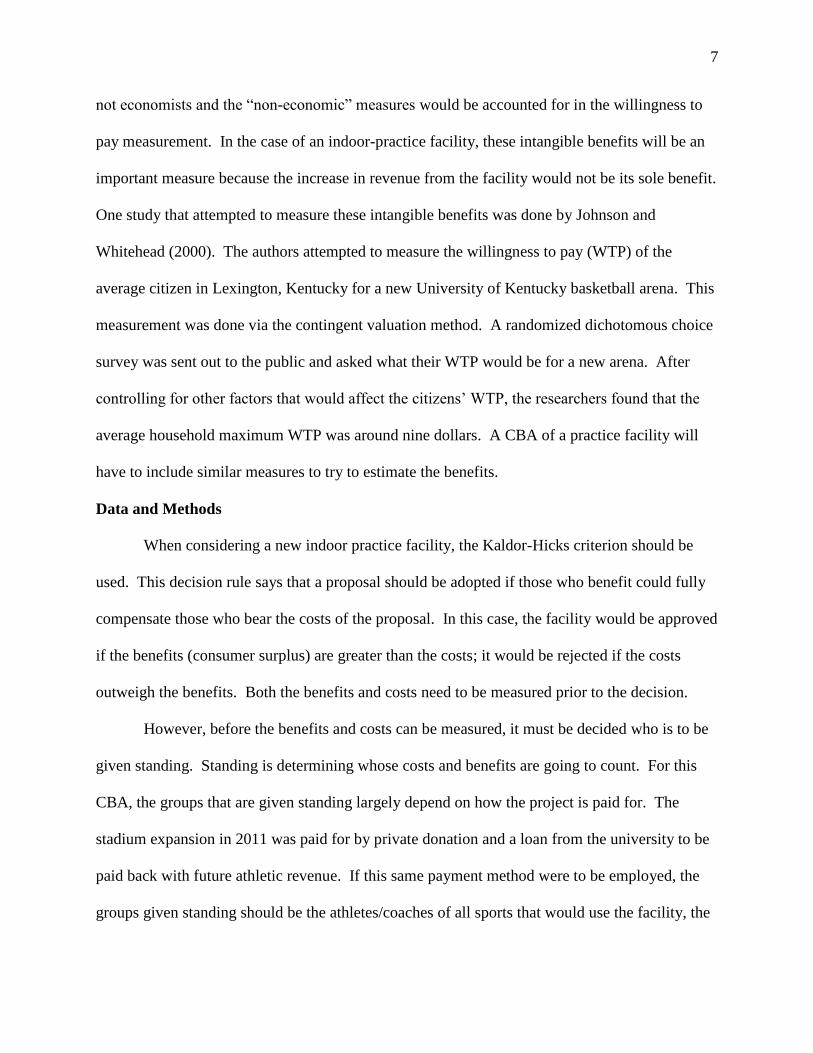
not economists and the “non-economic” measures would be accounted for in the willingness to
pay measurement. In the case of an indoor-practice facility, these intangible benefits will be an
important measure because the increase in revenue from the facility would not be its sole benefit.
One study that attempted to measure these intangible benefits was done by Johnson and
Whitehead (2000). The authors attempted to measure the willingness to pay (WTP) of the
average citizen in Lexington, Kentucky for a new University of Kentucky basketball arena. This
measurement was done via the contingent valuation method. A randomized dichotomous choice
survey was sent out to the public and asked what their WTP would be for a new arena. After
controlling for other factors that would affect the citizens’ WTP, the researchers found that the
average household maximum WTP was around nine dollars. A CBA of a practice facility will
have to include similar measures to try to estimate the benefits.
Data and Methods
When considering a new indoor practice facility, the Kaldor-Hicks criterion should be
used. This decision rule says that a proposal should be adopted if those who benefit could fully
compensate those who bear the costs of the proposal. In this case, the facility would be approved
if the benefits (consumer surplus) are greater than the costs; it would be rejected if the costs
outweigh the benefits. Both the benefits and costs need to be measured prior to the decision.
However, before the benefits and costs can be measured, it must be decided who is to be
given standing. Standing is determining whose costs and benefits are going to count. For this
CBA, the groups that are given standing largely depend on how the project is paid for. The
stadium expansion in 2011 was paid for by private donation and a loan from the university to be
paid back with future athletic revenue. If this same payment method were to be employed, the
groups given standing should be the athletes/coaches of all sports that would use the facility, the

8
students at MSU, and MSU boosters and alumni that could potentially donate to the program.
Other groups, such as viewing and listening audiences, will be ignored because of the cost and
unreliability of the information.
One major factor that would have a great effect on determining the costs of the facility is
the scope of the facility. The scope would also affect the benefits that the facility creates; more
benefits stand to be gained if more sports and activities can use the facility. Universities have the
choice of what features to include in their facility and MSU would face the same choice. For the
sake of this study, the facility used will have all of the appropriate features for a university of
MSU’s size. A maximum-scope facility would be used because the marginal costs of an
additional feature are relatively low when the facility already exists. If MSU were to put forth
the resources for any indoor facility, it would be most cost-effective to go all out and include all
of the reasonable features possible.
Now that the issue of standing has been determined, the methodology needs to focus on
calculating the costs of an indoor practice facility. The main determinants of the costs will
include the fixed initial construction costs and the variable per-year operating costs. In addition
to these obvious costs, the paper addressing the underestimation of costs of sports stadiums by
Long (2005) prompts the consideration of the costs of land, public infrastructure, and forgone
property taxes that are frequently glazed over in CBAs. These other cost factors will be properly
addressed in this paper.
Even if the scope of the facility were decided upon, calculating the initial construction
costs would be quite difficult. These costs can vary greatly based upon unforeseen problems that
arise during construction. That is why construction companies pay big bucks to their estimators.
Any facility that would be constructed would be bid on by a construction company and that
9
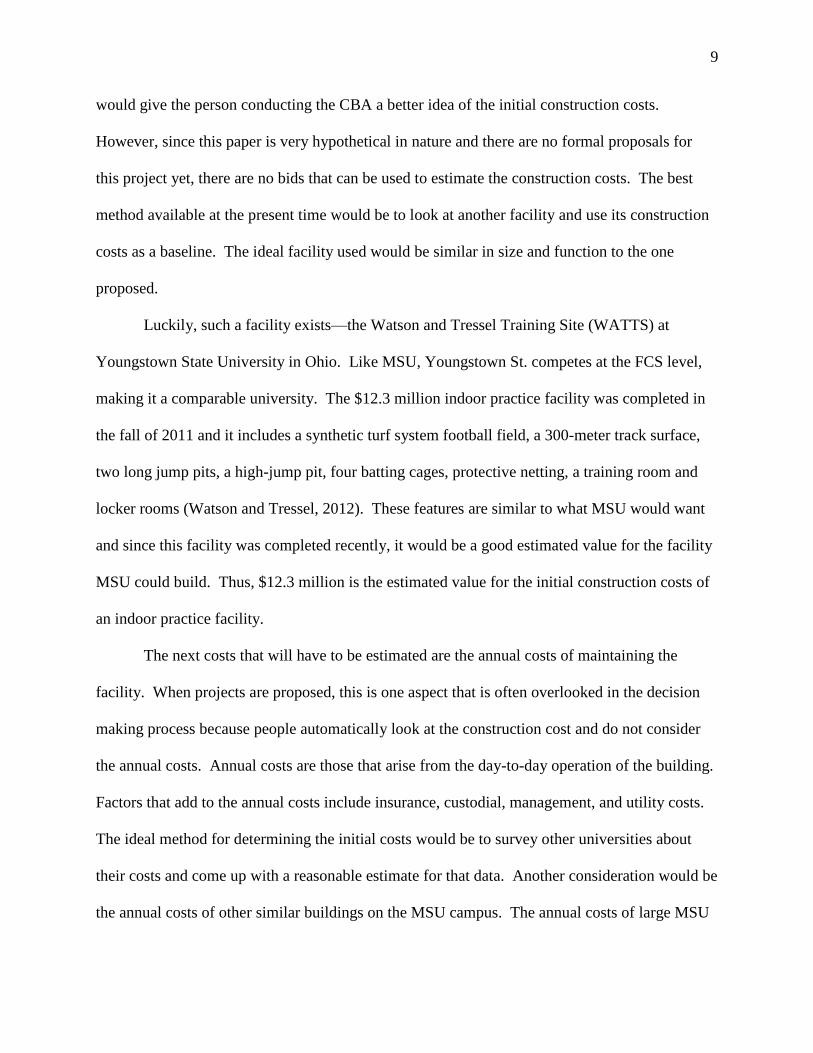
would give the person conducting the CBA a better idea of the initial construction costs.
However, since this paper is very hypothetical in nature and there are no formal proposals for
this project yet, there are no bids that can be used to estimate the construction costs. The best
method available at the present time would be to look at another facility and use its construction
costs as a baseline. The ideal facility used would be similar in size and function to the one
proposed.
Luckily, such a facility exists—the Watson and Tressel Training Site (WATTS) at
Youngstown State University in Ohio. Like MSU, Youngstown St. competes at the FCS level,
making it a comparable university. The $12.3 million indoor practice facility was completed in
the fall of 2011 and it includes a synthetic turf system football field, a 300-meter track surface,
two long jump pits, a high-jump pit, four batting cages, protective netting, a training room and
locker rooms (Watson and Tressel, 2012). These features are similar to what MSU would want
and since this facility was completed recently, it would be a good estimated value for the facility
MSU could build. Thus, $12.3 million is the estimated value for the initial construction costs of
an indoor practice facility.
The next costs that will have to be estimated are the annual costs of maintaining the
facility. When projects are proposed, this is one aspect that is often overlooked in the decision
making process because people automatically look at the construction cost and do not consider
the annual costs. Annual costs are those that arise from the day-to-day operation of the building.
Factors that add to the annual costs include insurance, custodial, management, and utility costs.
The ideal method for determining the initial costs would be to survey other universities about
their costs and come up with a reasonable estimate for that data. Another consideration would be
the annual costs of other similar buildings on the MSU campus. The annual costs of large MSU

10
facilities such as the Brick Breeden Fieldhouse and the Bobcat-Anderson Tennis Center could
give a good estimate of the annual costs of operating an indoor practice facility.
A cost per square foot estimate was obtained for a similar practice facility (Oregon
State’s). The estimated annual costs for this building were $1.57 per square foot (OSHBE
Meeting, 2000). This estimate is not perfect, but Corvallis, Oregon and Bozeman, MT are
located at relatively similar latitude and it will give a good approximation of per year costs for
the sake of this paper. If anything, it would be better to slightly overestimate the costs rather
than underestimate them. Thus, in order to account for climate and temporal differences the
baseline estimate of $1.57 per square foot was inflated to $1.75 per square foot. Next, a square-
footage estimate is needed for the new facility. The size of Youngstown St. WATTS was used
for the estimate, it is a 125,000 square foot building. This square footage estimate is relatively
large, but a larger number is better for obtaining a more conservative estimate. The estimate for
annual operating costs was determined by the following method:
($1.75/square foot) x (125,000 square feet) = $218,750 (Annual Costs Per Year)
In summary, using estimates from the WATTS facility the estimated initial construction cost for
the MSU facility is $12.3 million and the estimated annual costs are $218,750.
The last bit of discussion for the costs of the project focuses on the land costs and the
forgone property taxes that result from the building of sports facilities. Because MSU is a public
university, they have non-profit status and are thus exempt from paying property taxes. So the
case of foregone property taxes brought up in Long’s paper (2005) does not apply here. The
other costs to consider are the land and infrastructure costs. The project is still hypothetical so
the exact site of the facility is unknown at this point. One possible building site is the current
practice field (this site is shown in Exhibit 1). The university owns the land and it is in close

11
proximity to the Fieldhouse and the tennis center. The opportunity cost of the land would be
minimal because it is currently being used as an outdoor practice field for the football team. The
infrastructure costs would also be minimal because of its location in relation to the other
buildings; it would not require significant infrastructure investment from the community. Even
though these costs are often underreported, the site selection at MSU could minimize these costs.
For this paper, it will be assumed that these costs are included in the initial construction estimate.
The next step in the CBA is to measure the benefits that would arise from the
construction of the facility. One portion of the benefits that could be measured is the increased
revenue to the school that could result from the facility. If the facility creates a competitive
advantage for the team, it would lead to a better overall team (evidenced by an increased winning
percentage). A better team would cause increased fan support and a larger following. This
would lead to higher revenues for the MSU athletic department from higher ticket sales,
advertising revenue (from larger television and radio audiences), and merchandise sales. It seems
reasonable that there would be some amount of revenue increase that would benefit the
university as a result of the project, but what is a reasonable number to use?
To determine this number, the hedonic value of a practice facility would be calculated in
terms of winning percentage. The winning percentage of a team would be a function of many
different variables including historical success, location, stadium size, university size, practice
facilities, and others. The variable of interest in this function would be the presence of an indoor
practice facility. Using econometric methods on past football winning percentage data, the value
of the practice facility variable in terms of winning percentage could be estimated. For a simple
example, the Youngstown State football team improved from a 3-8 record in the season before
the WATTS facility was constructed to a 6-5 record in the following season. The facility is

12
obviously not the only factor that led to this increase; the hedonic value analysis would isolate
the variable’s effect.
In addition, a relationship between winning percentage and revenue would have to be
calculated. A 2011 study attempted to estimate this value for soccer clubs in the English Premier
League (Carmichael, McHale, & Thomas, 2011). This study estimated the revenue functions of
teams and it was determined that the winning percentage variable had a positive relationship with
revenue. A similar study could be done for college football revenues. The two estimated values
could then be used in this equation:
Revenue increase from the indoor facility = (Hedonic value of facility) x (Revenue
increase from a one point increase in winning percentage)
This method does not seem as if it would be the best for estimating this revenue increase.
However, this is a possible framework to begin to estimate the revenue benefits from the addition
of the facility.
Another benefit of the facility arises from its existence value. Boardman et al. (2011)
describes existence value as the value that an entity has simply because it exists. People can
stand to gain benefit from both its use and nonuse. These benefits would consist of factors such
as competitive advantage, utility, school pride, team prestige, and positive outside perception.
These factors would benefit the students as well as the teams. The WTP of those with standing
would capture this existence value. To estimate the WTP, a contingent valuation survey of all of
the people with standing would be used.
To elicit the WTP for those that might donate to the project (i.e. boosters and alumni) it
would merely consist of a fill in the blank survey. This could be done because the donation
would be voluntary and the donator would have a good idea of their willingness to donate.
13
However, such a survey would not elicit accurate responses for measuring the willingness to pay
for the athletes and students. Instead, a random-value dichotomous choice survey would be more
appropriate for these groups. This survey would consist of a random value that would elicit a yes
or no response from the survey taker. This is better because the survey takers would need some
initial guidance on reasonable willingness to pay amounts. An example survey question for an
MSU student would be: “Are you willing to increase your student athletic fee by $X for a new
indoor practice facility?” (where X is a random value that is from a range determined by the
survey creator). Then the response data would be used to estimate the average willingness to pay
for the group.
It is likely that the coaches and athletes of the sports that use the facility would have
different level of benefit that may not be properly captured in the same survey as the one given to
a normal MSU student. To try to capture this difference the question could be phrased
differently. The question could instead be: “would you be willing to have your
salary/scholarship reduced by $X for a new practice facility?” This would elicit a more accurate
response from this group because the costs to the survey taker would be more fully realized. The
aggregate willingness to pay from these groups with standing would be the total existence value
for the facility.
After both measures of benefit are determined, total benefits can be calculated in this way:
Total Benefit = (Benefit from increased revenue) + (Existence value) (See Exhibit 3)
Results
Unfortunately, due to time and resource constraints, a full CBA was not possible for this
project. However, one might speculate on what would be found if a CBA was undergone. The
costs of the facility would in theory be simple to calculate. At this point, there is no proposed

14
project so the costs of other similar facilities were used as an estimate. If there was an actual
proposal in place, the numbers would be calculated from construction bids and actual building
information instead. The costs of the project would consist of the sum of the initial construction
costs and a discounted sum of the annual costs over time. If the site was chosen to be at the
location in Exhibit 1, the land and infrastructure costs can be ignored for the reasons stated in the
prior paragraphs.
In Exhibit 2, the sum of the discounted stream of costs was calculated over various social
discount rates and periods of time. After performing this sensitivity analysis, a discount rate of 7%
over a period of 50 years was decided upon. The 7% rate was chosen because U.S. federal
policy dictates that CBAs of federal projects must be discounted at that rate (Guidelines and
Discount Rates, 2012). A period of 50 years was chosen because that seems like a reasonable
lifetime for the life of the facility. This discounted sum of annual costs ends up equaling
$3,018,913. Adding this figure to the initial construction costs of the WATTS center at
Youngstown State ($12.3 million); the total costs of the facility end up totaling $15.3 million
dollars.
Now that a cost for the project has been established, the benefits would have to be
determined. If the benefits are equal to, or exceed this $15.3 million mark, then the project
should proceed. However, the benefits are not directly measurable and no actual contingent
valuation survey was given. Thus, the possible benefits listed here are purely speculative. The
contingent valuation study for the city of Lexington, KY in regards to a new basketball arena,
came up with an average household willingness to pay of nine dollars (Johnson & Whitehead,
2000). With this in mind, the estimated willingness to pay for the average MSU student for the
new facility would be at least nine dollars. The reason this is a reasonable minimum is that the

15
entire city of Lexington was given standing. For this project, the group given standing is much
more specific (i.e. MSU students). It can be expected that a student body would have at least the
same amount of willingness to pay for a facility upgrade for their team as an entire city with a
populace not necessarily directly tied to the university. If the average willingness to pay for an
MSU student was nine dollars, then the annual benefit would be
($9 per student) * (14,153 (2012 enrollment) ) = $127,377 (benefit per year)
The discounted sum of these annual benefits (at 7% over 50 years) would be $1,757,898. This is
much lower than the discounted sum of the annual costs. If the annual costs of $218,750 were
funded by students alone, they would have to have a willingness to pay of $15.46 per student.
This number does not seem unreasonable because it would correspond to a $7.73 increase in fees
per semester.
The willingness to pay for the boosters and alumni is also highly speculative. The end
zone project that was completed in 2011 generated $6 million+ in donations (End Zone Donor
Roll, 2011). A practice facility is not as impressive as an upgraded stadium, but there would still
be some willingness to donate for this project. What that number is exactly is unknown.
However, it seems reasonable that this number would be less than $6 million. Therefore, $6
million could be used as an upper limit of the estimate for the willingness to pay for boosters and
alumni.
The last group to consider is the athletes and coaches that will benefit most directly from
this facility. Once again, this result is unknown. Looking at the benefits and costs thus far, we
can determine what the willingness to pay would have to be for this group. It would have to be
around $7-8 million dollars, depending on the exact willingness to pay of the boosters and
alumni. This group consists of a small group of people, and it seems unlikely that they would
16
stand to benefit by $7.5 million. The hedonic value of the facility in terms of winning
percentage (and also perhaps revenue) would be included in this benefit section too, but it would
not be proper to speculate on any sort of number without actually doing the study. Exhibit 3
attempts to summarize the costs and benefits considered in this analysis. As one can see, there
are several estimates that are unknown including the most important one: the net benefits and
costs.
Conclusion
The speculative nature of this CBA creates a difficulty in trying to conclude anything
concretely. The costs of building the facility seems quite large at this point in relation to the
benefits that would be gained. To carry out the full project based on this paper would foolish
and unwarranted. However, if the suggested methods were carried out properly and fully, the
costs and benefits of the project would be measurable and a proper conclusion could be reached.
Remember, if the CBA results in net benefits, then the project should be carried out.
However, in the hypothetical situation where the facility was already in existence, would
the annual benefits outweigh the annual costs? The initial construction costs are what lead to the
facility being unattainable. If a large, one-time donation was made and a facility suddenly
existed, then the only costs would be the annual costs to operate the facility. In that case, the
annual benefits would have to exceed the $218,750 dollar value. This scenario does seem
possible, especially if the building were constructed in such a way that it benefitted more than
just the football team directly. One option could be to use the facility as an indoor convention
center for large group meetings. Also, if intramurals could use the facility, that would result in an
increase the annual benefit. In these instances, the facility’s benefits could justify its operating
costs.

17
Another possible method that could be used in the analysis would be to conduct a
weighted CBA. This method is mentioned in the book by Boardman et al (2011). This would
consist of the analyst assigning different weights to the different groups that have standing. This
is done because different groups have different values for their elasticity of demand. In this case,
athletes likely have similar incomes to this non-football playing peers. Since their WTP is a
function of their income, that measure would be underestimated. In this case, we might assign
more weight to the athlete’s willingness to pay. This would result in a higher measured benefit
and perhaps a more accurate number for the CBA. This method is controversial because
determining the weights to use is largely arbitrary and any use of this method would require
extensive justification.
Even if this CBA were conducted properly, the results would have to be scrutinized
carefully. The results that stem from contingent valuation surveys are not necessarily indicative
of the true willingness to pay. According to Boardman et al (2011, p 231), existence values
(measured with a contingent valuation method) “should be estimated whenever possible, [but]
costs and benefits should be presented with and without their inclusion to make clear how they
affect net benefits.” Since most of the facilities benefits would stem from its existence value,
any result would be open for justified criticism.
Another area that could be explored would be the additional benefits that might result
from a higher football team winning percentage. One spillover could be the overall
improvement of all the teams in the athletic department. Football is the main money-maker in
college sports and successful football teams can aid in the improvement of other sports as well.
Increased success has also been shown to increase the undergraduate admission to universities as
well (McEvoy, 2005). If this were the case, MSU could either improve its total enrollment

18
number, or they could improve the quality of their students by being able to select from a larger
pool.
This proposal has touched on most of the topics that make CBA difficult. For one, the
benefits of this proposal were mainly existence values that are difficult to monetize. Picking
what benefits to measure, the social discount rate, and standing illustrated the difficulty that CBA
analysts face when they are forced to make subjective decisions to carry out their analysis. This
project has made clear the problems with ex ante analyses and the variability that comes from the
assumptions made. An analyst should always take great care in determining the assumptions
made and sensitivity analyses should be conducted to determine the impacts from the
assumptions.
The Montana State University Bobcat football program (and athletic department in
general) is on the rise, but they are not yet to the level where an indoor practice facility would be
socially justified. It is likely that the initial costs of the project would be too substantial to be
overcome by the benefits that the facility would create. However, in the future, this facility may
be a possibility if the program is at the level where building such a facility would be justified. It
seems as though the program at this stage should pursue options that will have immediate
revenue-generating benefits. At this point, Bobcat fans will just have to wait and see.

19
Exhibits
Exhibit 1: Possible site for the indoor practice facility.
Exhibit 2: Discounted Sum of Annual Costs: Calculated by ∑
Social Discount Rate (r) k = 50 Years k = 100 Years
5%
$3,993,483 $4,341,730
7%
$3,018,913 $3,121,399
9%
$2,397,868 $2,430,116

20
Exhibit 3: Summary of estimated costs and benefits. Unfortunately, no concrete conclusion can
be drawn from this analysis.
Costs
Initial Construction $12.3 million
Annual Operating Costs $3.0 million
Land and Infrastructure Negligible
Total $15.3 million
Benefits
Students $1.8 million
Boosters/Alumni <$6 million
Athletes/Coaches ?
Revenue increases ?
Total $7.8 million?
Net ???*
*Because the net costs and benefits are unknown, this paper cannot make a final
recommendation about this project.
21
References
Boardman, A., Greenberg, D., Vining, A., & Weimer, D. (2011). Cost Benefit Analysis Concepts
and Practice. Upper Saddle River, NJ: Prentice Hall.
Carmichael, F, McHale, I, & Thomas, D. (2010). Maintaining Market Position: Team
Performance, Revenue, and Wage Expenditure in the English Premier League. Bulletin
of Economic Research. Volume 63(4). Retrieved from 10.1111/j.1467
8586.2009.00340.x
Coss, Kevin. (April 17, 2012). Vikings’ stadium bill likely dead after it fails committee. The
Austin Daily Herald. Retrieved from
http://www.austindailyherald.com/2012/04/17/vikings%E2%80%99-stadium-bill-likely
dead-after-it-fails-committee/
Eckstein, R. & Delaney, K. (2002). New Sports Stadiums, Community Self-esteem, and
Community Collective Conscience. Journal of Sport & Social Issues. Volume 26(3).
Retrieved from http://jss.sagepub.com/content/26/3/235.refs.html
End Zone Donor Roll. Retrieved April 27, 2012 from http://www.montana.edu/EZ/donors.php
Guidelines and Discount Rates for Benefit-Cost Analysis of Federal Programs. Retrieved Apil
27, 2012 from http://www.whitehouse.gov/sites/default/files/omb/assets/a94/a094.pdf
Humphreys, B & Ruseski, J. (2010). Problems with data on the sport industry. Journal of Sports
Economics. Volume 11(1). Retrieved from http://jse.sagepub.com/content/11/1/60
Johnson, B. & Whitehead, J. (2000). Value of Public Goods From Sports Stadiums: The CVM
Approach. Contemporary Economic Policy. Volume 18(1). Retrieved from
http://onlinelibrary.wiley.com/doi/10.1111/j.1465-7287.2000.tb00005.x/abstract

22
Long, J. (2005). Full count: The real cost of public funding for major league sports facilities.
Journal of Sports Economics. Volume 6(2). Retrieved from
http://jse.sagepub.com/content/6/2/119
McEvoy, C. (2005). The Relationship Between Dramatic Changes in Team Performance and
Undergraduate Admissions Applications. The SMART Journal. Volume 2(1). Retrieved
from http://www.thesmartjournal.com/admissions.pdf
Watson and Tressel Training Site: Youngstown State. Retrieved April 27, 2012 from
http://www.ysusports.com/information/facilities/watts