Embed Size (px)
Citation preview
1
COMP 3503COMP 3503
Deductive Modeling with OLAPDeductive Modeling with OLAP
withwith
Daniel L. SilverDaniel L. Silver
2
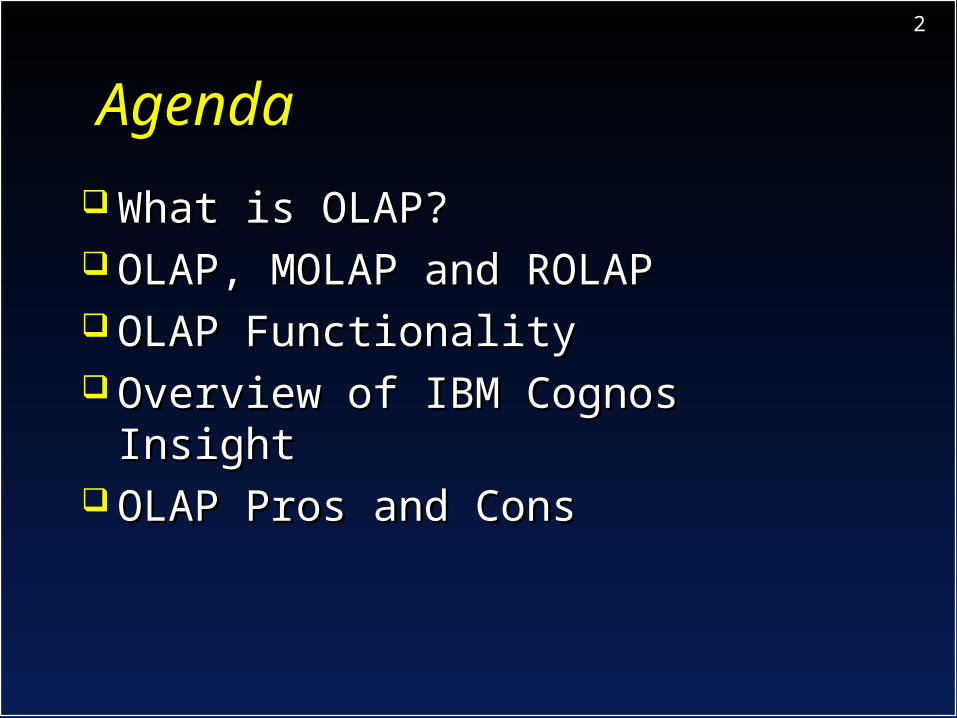
AgendaAgenda
What is OLAP?What is OLAP? OLAP, MOLAP and ROLAPOLAP, MOLAP and ROLAP OLAP FunctionalityOLAP Functionality Overview of IBM Cognos InsightOverview of IBM Cognos Insight OLAP Pros and ConsOLAP Pros and Cons

3
What is OLAP?What is OLAP?

4
On-Line Analytical On-Line Analytical ProcessingProcessing
OLAPOLAP Term coined by E.F. Codd in a document Term coined by E.F. Codd in a document
published in 1993 sponsored by Arbor published in 1993 sponsored by Arbor Software Corp (ESSBASE)Software Corp (ESSBASE)
In contrast to OLTP and traditional RDBMSIn contrast to OLTP and traditional RDBMS Defined requirements for databases and Defined requirements for databases and
tools to implement decision support and tools to implement decision support and business intelligence systems.business intelligence systems.
Has had a significant impact on the Has had a significant impact on the database and business software market.database and business software market.
5
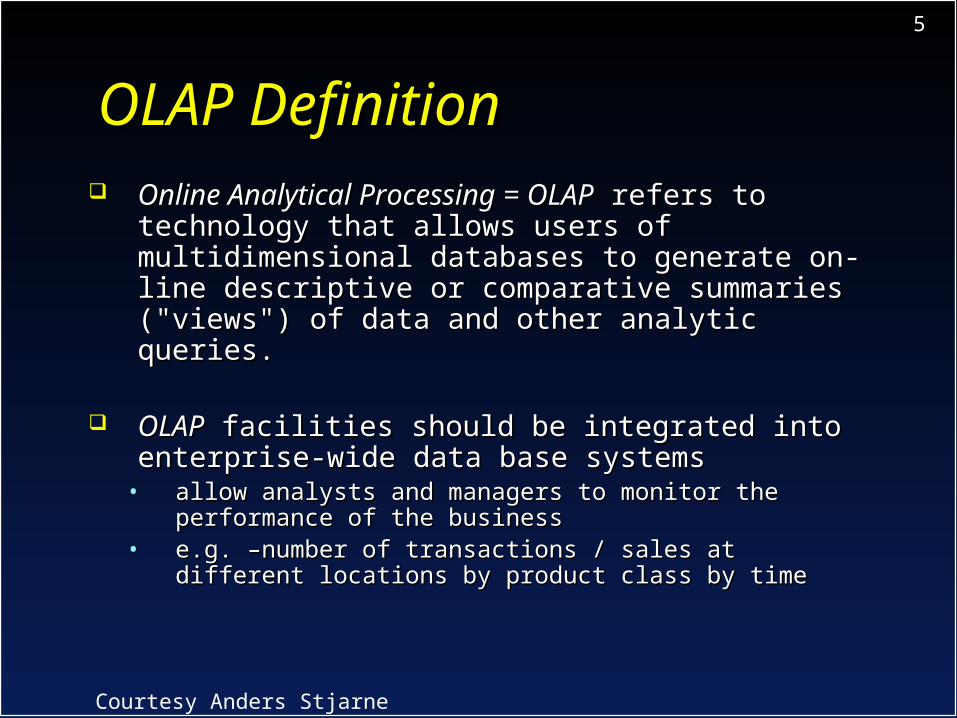
OLAP DefinitionOLAP Definition Online Analytical Processing = OLAPOnline Analytical Processing = OLAP refers refers
to technology that allows users of to technology that allows users of multidimensional databases to generate on-multidimensional databases to generate on-line descriptive or comparative summaries line descriptive or comparative summaries ("views") of data and other analytic queries. ("views") of data and other analytic queries.
OLAPOLAP facilities should be integrated into facilities should be integrated into enterprise-wide data base systems enterprise-wide data base systems
• allow analysts and managers to monitor the allow analysts and managers to monitor the performance of the business performance of the business
• e.g. –number of transactions / sales at different e.g. –number of transactions / sales at different locations by product class by timelocations by product class by time
Courtesy Anders Stjarne

6Multidimensional Multidimensional RequirementsRequirements
Example: Example: Sales volumeSales volume as a function as a function of of productproduct, , timetime, and , and geography.geography.
Pro
duct
Geogr
aphy
Time
Dimensions: Product, Geography, Time
Measure: ‘Sales Volume’
Courtesy Anders Stjarne
More than three dimensional data cube is referred to as a hypercube

7
Deductive Modelling and Deductive Modelling and AnalysisAnalysis
QuarterMonth
TypeCustomer
LineBrandNumber
CountryBranchSales Rep
QuantityCostMargin
Combination 1
QuarterMonth
TypeCustomer
LineBrandNumber
CountryBranchSales Rep
QuantityCostMargin
Combination 2
When?Time(1997)
Who?Customers(Channels)
What?Product(Type)
Where?Location(Region)
Result?Indicator
(Revenue)
Comprehensive Sales Analysis
Courtesy Anders Stjarne
8
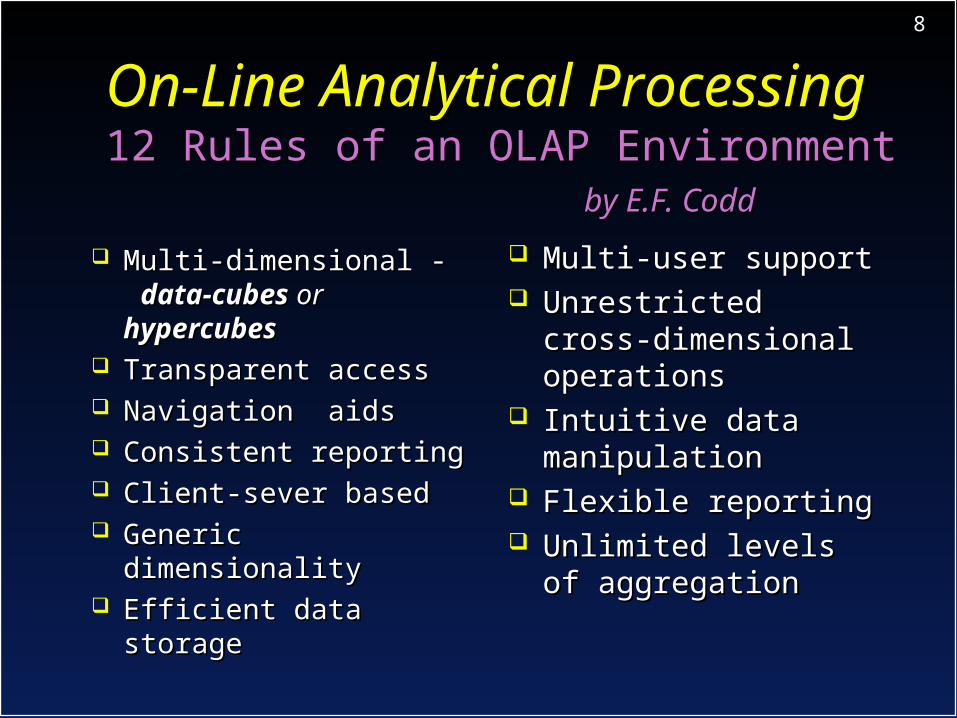
On-Line Analytical On-Line Analytical ProcessingProcessing12 Rules of an OLAP Environment12 Rules of an OLAP Environment by E.F. Coddby E.F. Codd
Multi-dimensional - Multi-dimensional - data-cubes data-cubes oror hypercubes hypercubes
Transparent accessTransparent access Navigation aidsNavigation aids Consistent reportingConsistent reporting Client-sever basedClient-sever based Generic Generic
dimensionalitydimensionality Efficient data storageEfficient data storage
Multi-user supportMulti-user support Unrestricted cross-Unrestricted cross-
dimensional dimensional operationsoperations
Intuitive data Intuitive data manipulationmanipulation
Flexible reportingFlexible reporting Unlimited levels of Unlimited levels of
aggregationaggregation

9
On-Line Analytical On-Line Analytical ProcessingProcessing Strong connection to multi-dimensional Strong connection to multi-dimensional
database (MDBMS) model database (MDBMS) model MOLAP MOLAP Data-cubes are typically constructed Data-cubes are typically constructed
off-line due to time required to build off-line due to time required to build indicesindices
Dimensions, values, and aggregations Dimensions, values, and aggregations are limited to that within data-cubeare limited to that within data-cube
On-line cube development has allowed On-line cube development has allowed RDBMS vendors to survive as major RDBMS vendors to survive as major players in OLAP market players in OLAP market ROLAP ROLAP

10
OLAP, MOLAP and ROLAPOLAP, MOLAP and ROLAP
11
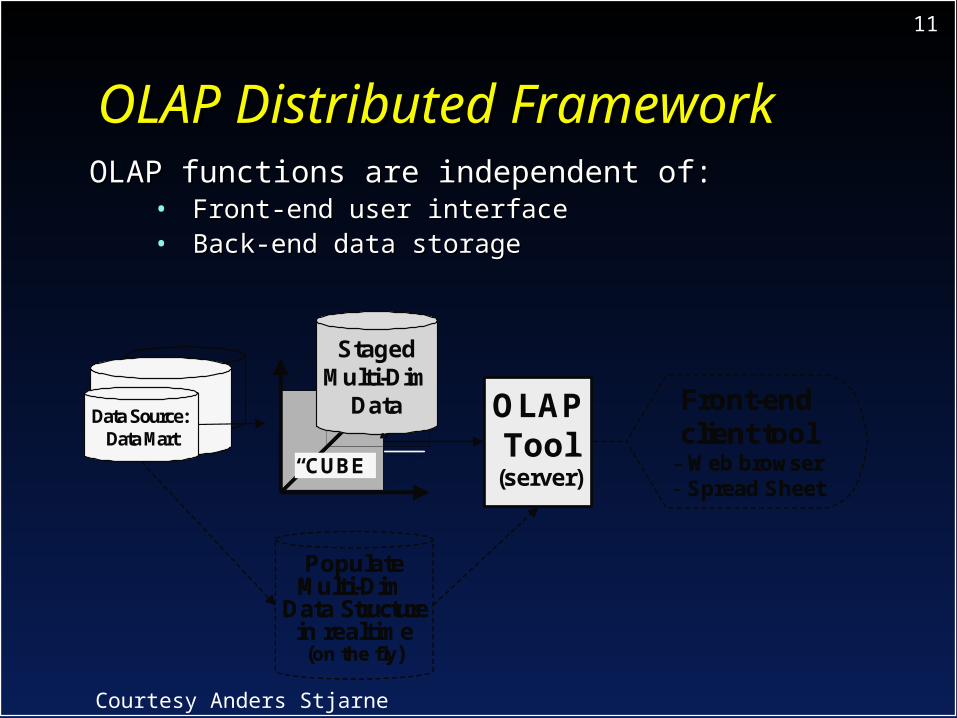
OLAP Distributed FrameworkOLAP Distributed FrameworkOLAP functions are independent of:OLAP functions are independent of:
• Front-end user interfaceFront-end user interface• Back-end data storageBack-end data storage
OLAPTool
Front-endclient tool
- Web browser- Spread Sheet
StagedMulti-Dim
DataData Source: Data Mart
PopulateMulti-Dim
Data Structurein realtime(on the fly)
(server)“CUBE”
OLAPTool
Front-endclient tool
- Web browser- Spread Sheet
StagedMulti-Dim
DataData Source: Data Mart
PopulateMulti-Dim
Data Structurein realtime(on the fly)
(server)“CUBE”
Courtesy Anders Stjarne

12
MDBMSMDBMS Relational versus Dimensional DataRelational versus Dimensional Data
• http://www.youtube.com/watch?v=FjKaRU5V1Rwhttp://www.youtube.com/watch?v=FjKaRU5V1Rw
ROLAP = Representing dimensional ROLAP = Representing dimensional data with RDBMSdata with RDBMS• Star SchemaStar Schema
o http://www.dwreview.com/OLAP/Introduction_OLAP.htmlhttp://www.dwreview.com/OLAP/Introduction_OLAP.html
• More details: More details: o http://www.youtube.com/watch?v=1Qdf5c_nmtw http://www.youtube.com/watch?v=1Qdf5c_nmtw o http://www.ciobriefings.com/Publications/WhitePapers/http://www.ciobriefings.com/Publications/WhitePapers/
DesigningtheStarSchemaDatabase/tabid/101/Default.aspx DesigningtheStarSchemaDatabase/tabid/101/Default.aspx
13
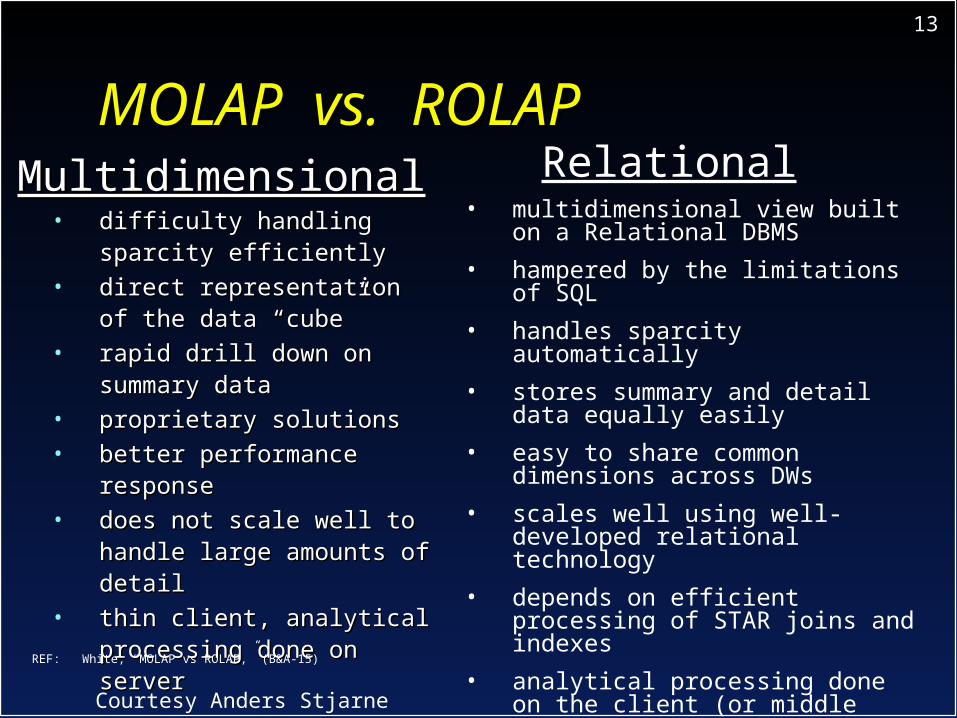
MOLAP vs. ROLAPMOLAP vs. ROLAPMultidimensionalMultidimensional• difficulty handling sparcity difficulty handling sparcity
efficiently efficiently • direct representation of the direct representation of the
data data ““cubecube””• rapid drill down on rapid drill down on
summary datasummary data• proprietary solutionsproprietary solutions• better performance better performance
responseresponse• does not scale well to does not scale well to
handle large amounts of handle large amounts of detaildetail
• thin client, analytical thin client, analytical processing done on serverprocessing done on serverREF: White, “MOLAP vs ROLAP,” (B&A-15)
Relational• multidimensional view built on a
Relational DBMS
• hampered by the limitations of SQL
• handles sparcity automatically
• stores summary and detail data equally easily
• easy to share common dimensions across DWs
• scales well using well-developed relational technology
• depends on efficient processing of STAR joins and indexes
• analytical processing done on the client (or middle server)
Courtesy Anders Stjarne
14
OLAP FunctionalityOLAP Functionality

15
On-Line Analytical On-Line Analytical ProcessingProcessing
Deductive Modeling with OLAP Deductive Modeling with OLAP Model is developed within the users mind as Model is developed within the users mind as
data is exploreddata is explored Verification or rejection is facilitated by Verification or rejection is facilitated by
multi-dimensional functions which display multi-dimensional functions which display data numerically and graphicallydata numerically and graphically
Best practices:Best practices:• Determine suspected variable interaction Determine suspected variable interaction • Verify/reject model through explorationVerify/reject model through exploration• Drill-down to refine model Drill-down to refine model • Maintain record of exploratory findingsMaintain record of exploratory findings
16
On-Line Analytical On-Line Analytical ProcessingProcessing
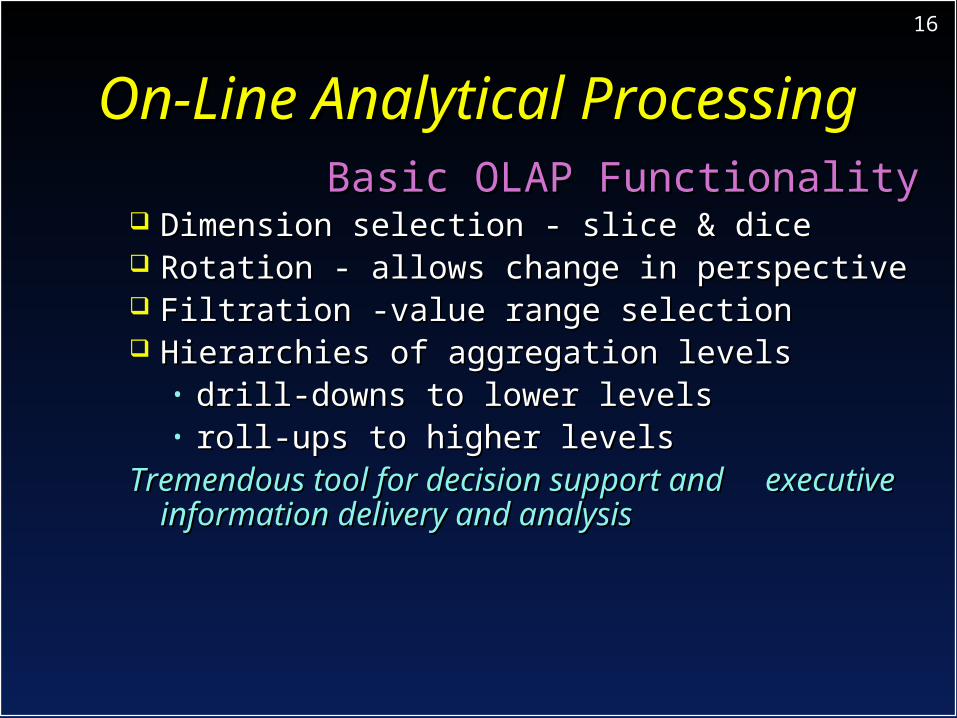
Basic OLAP FunctionalityBasic OLAP Functionality Dimension selection - slice & diceDimension selection - slice & dice Rotation - allows change in perspectiveRotation - allows change in perspective Filtration -value range selectionFiltration -value range selection Hierarchies of aggregation levelsHierarchies of aggregation levels
• drill-downs to lower levels drill-downs to lower levels • roll-ups to higher levelsroll-ups to higher levels
Tremendous tool for decision support and Tremendous tool for decision support and executive information delivery and analysisexecutive information delivery and analysis
17
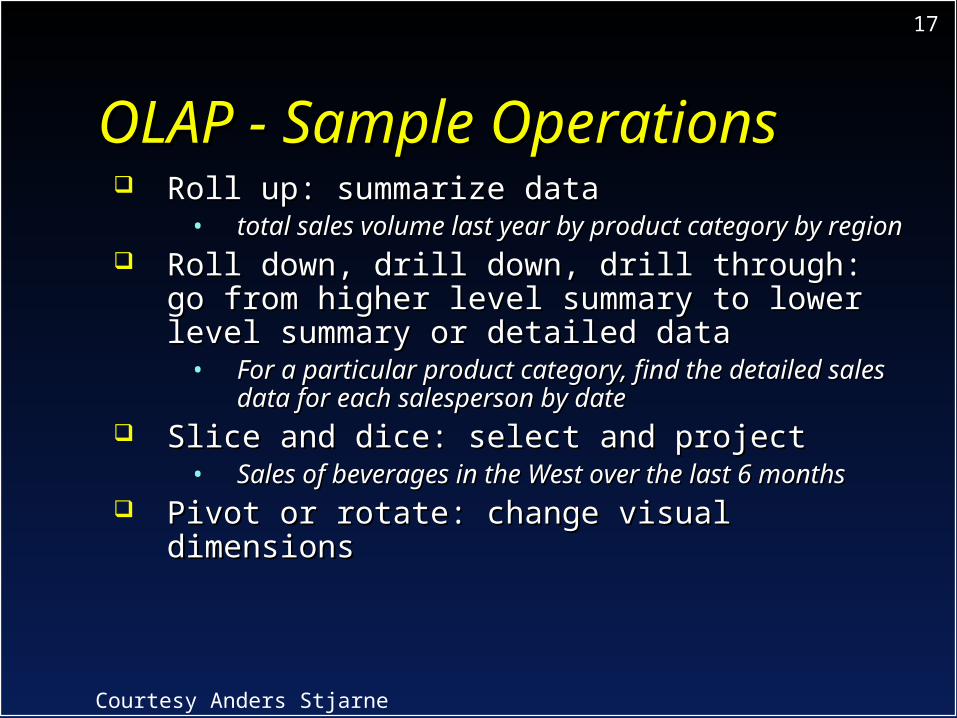
OLAP - Sample OperationsOLAP - Sample Operations Roll up: summarize dataRoll up: summarize data
• total sales volume last year by product category total sales volume last year by product category by regionby region
Roll down, drill down, drill through: go from Roll down, drill down, drill through: go from higher level summary to lower level summary higher level summary to lower level summary or detailed dataor detailed data
• For a particular product category, find the For a particular product category, find the detailed sales data for each salesperson by datedetailed sales data for each salesperson by date
Slice and dice: select and projectSlice and dice: select and project• Sales of beverages in the West over the last 6 Sales of beverages in the West over the last 6
monthsmonths Pivot or rotate: change visual dimensionsPivot or rotate: change visual dimensions
Courtesy Anders Stjarne
18
OLAP and Data MiningOLAP and Data Mining
The final results from OLAP The final results from OLAP exploration can lead to inductive data exploration can lead to inductive data miningmining
Data Mining techniques can be Data Mining techniques can be applied to the data views and applied to the data views and summaries generated by OLAP to summaries generated by OLAP to provide more in-depth and often more provide more in-depth and often more multidimensional knowledgemultidimensional knowledge
Data Mining techniques can be Data Mining techniques can be considered analytic extension of OLAPconsidered analytic extension of OLAP

19
Multi-dimensional CubesMulti-dimensional Cubes A cube is a structure that stores data multi-dimensionally and A cube is a structure that stores data multi-dimensionally and
provides:provides:• secure data accesssecure data access• fast retrieval of data.fast retrieval of data.
Cubes can be distributed across a network or to individual computers.Cubes can be distributed across a network or to individual computers.
CustomersChannels
Products
LocationsSales Reps
Time
CustomersChannels
Products
LocationsSales Reps
Time
20
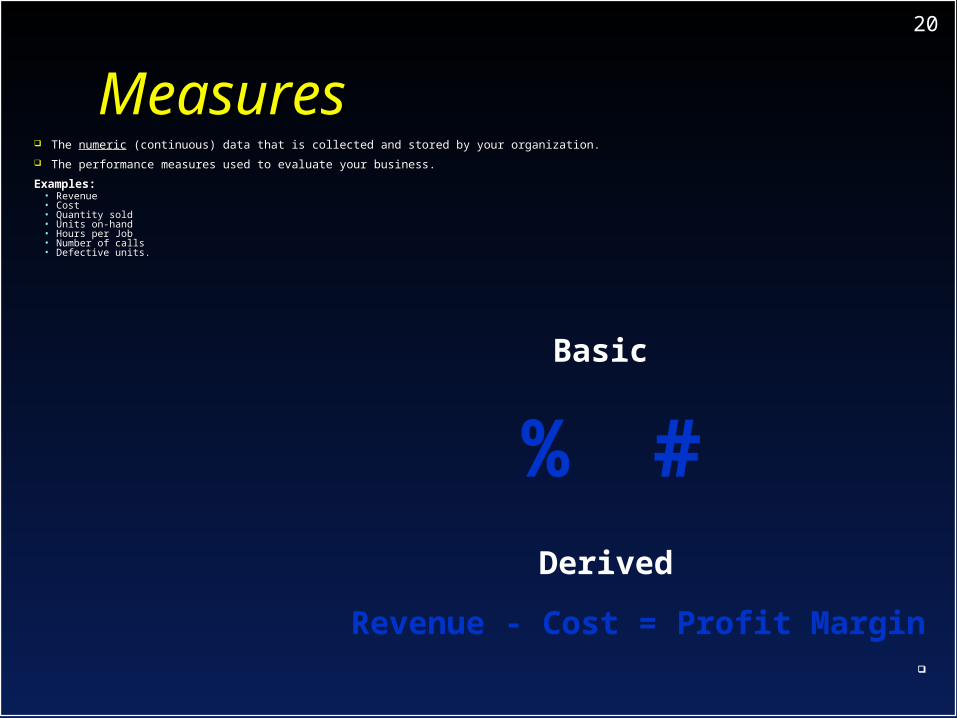
MeasuresMeasures The The numericnumeric (continuous) data that is collected and stored by your organization. (continuous) data that is collected and stored by your organization.
The performance measures used to evaluate your business.The performance measures used to evaluate your business.
Examples:Examples:• RevenueRevenue• CostCost• Quantity soldQuantity sold• Units on-handUnits on-hand• Hours per JobHours per Job• Number of callsNumber of calls• Defective units.Defective units.
#%
Revenue - Cost = Profit Margin
Basic
Derived
21
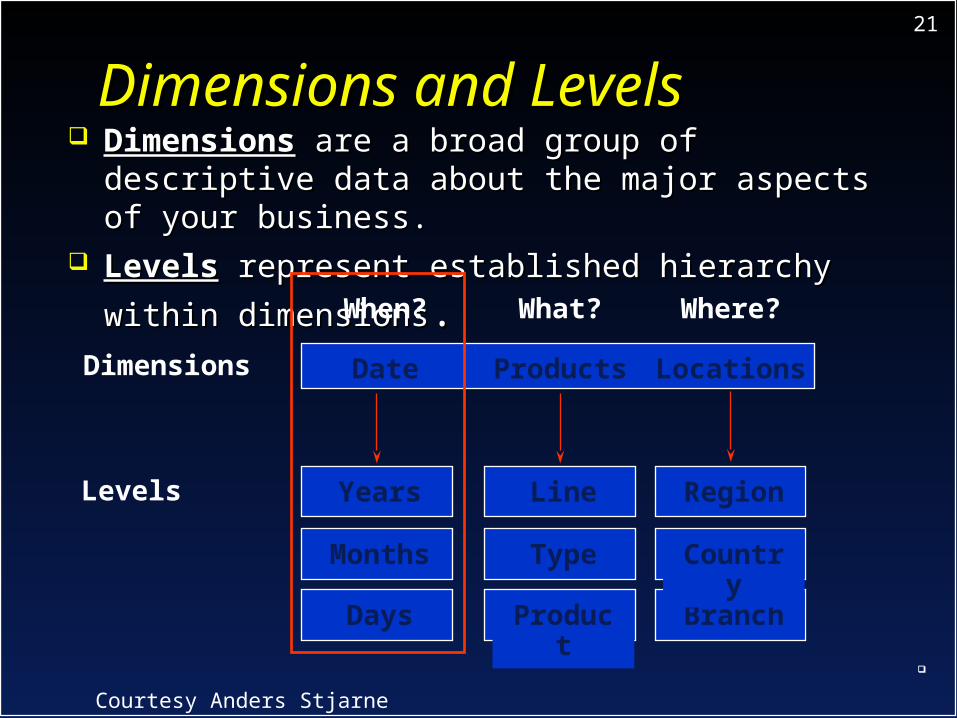
Dimensions and LevelsDimensions and Levels DimensionsDimensions are a broad group of descriptive are a broad group of descriptive
data about the major aspects of your business.data about the major aspects of your business. LevelsLevels represent established hierarchy within represent established hierarchy within
dimensionsdimensions..
Dimensions
Levels
When?
Date
What?
Products
Where?
Locations
Years
Months
Days
Line
Type
Product
Region
Branch
Country
Courtesy Anders Stjarne

22
Levels and CategoriesLevels and Categories•A A category iscategory is a data item that populates a level in a a data item that populates a level in a
dimension.dimension.
Levels
CategoriesDimension Locations
Region
Country
Branch
Europe
United Kingdom
London, U.K.
Manchester, U.K.
Courtesy Anders Stjarne
23
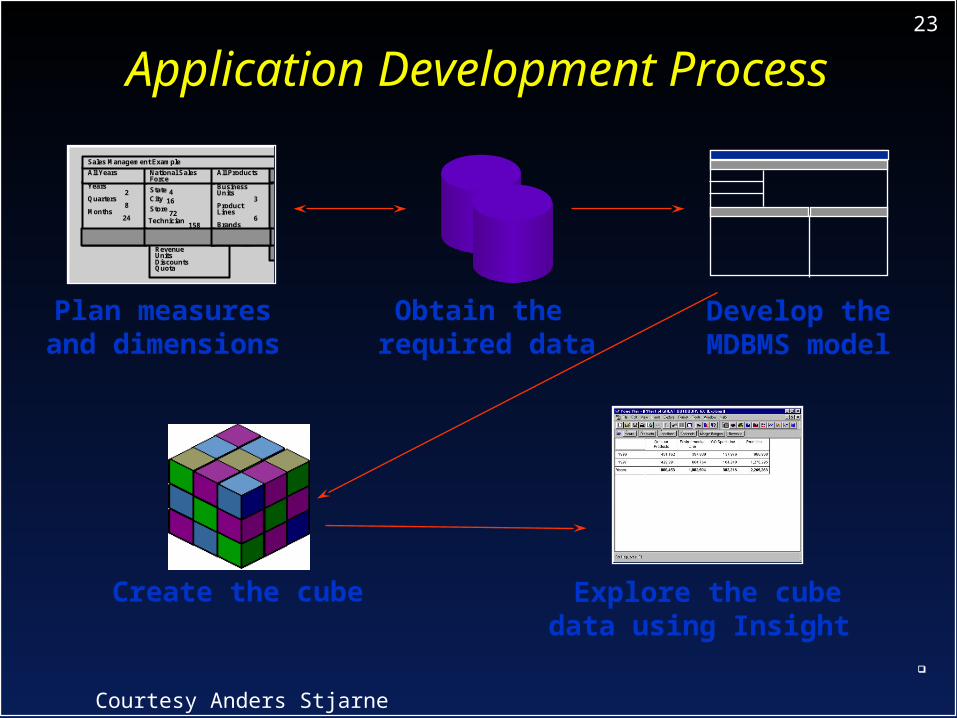
Application Development ProcessApplication Development Process
Plan measures and dimensions
Create the cube
RevenueUnitsDiscountsQuota
Years 2
Quarters 8
Months 24
State 4City 16Store 72
Business Units
3ProductLines
6Brands 18Products 125
All Years National SalesForce
All Products
Sales Management Example
Technician 158
Obtain the required data
Develop the MDBMS model
Explore the cube data using Insight
Courtesy Anders Stjarne

24
Basic OLAP OperationsBasic OLAP Operations• Selection (Filter) – within the range of a dimensionSelection (Filter) – within the range of a dimension• Scope – the range on a dimensionScope – the range on a dimension• Slice – Slice – a two dimensional a two dimensional ‘‘pagepage’’ from the cube from the cube
• Dice Dice – chopping up along the dimensions– chopping up along the dimensions
• Drill down analysis - Drill down analysis - to the detail beneath summary datato the detail beneath summary data
• Rollup/ ConsolidateRollup/ Consolidate• Rotate (Pivot) – change dimension orientationRotate (Pivot) – change dimension orientation
o Swap rows and columnsSwap rows and columnso Swap on or offSwap on or offo Change nesting orderChange nesting order
• Reach Through – to the source data detailReach Through – to the source data detail• Calculations / Derivation formulas on the measured factsCalculations / Derivation formulas on the measured facts
o Ratios, Rankings, etc.Ratios, Rankings, etc.o E.g., E.g., NetSales = GrossSales – Cost; NetSales = GrossSales*(1 - NetSales = GrossSales – Cost; NetSales = GrossSales*(1 -
Margin)Margin) REFS: INMON, Building, Ch. 7, p. 243; White, “MOLAP vs ROLAP,” (B&A-15)
Courtesy Anders Stjarne

25
Advanced OLAP Advanced OLAP OperationsOperations Trend analysis - over broad vistas of timeTrend analysis - over broad vistas of time
• handling time series data, time handling time series data, time calculationscalculations
Key ratio indicator measurement and Key ratio indicator measurement and trackingtracking
Comparisons - present to: past, plan, and Comparisons - present to: past, plan, and othersothers• competitive market analysiscompetitive market analysis
Problem monitoring - of variables within Problem monitoring - of variables within control limitscontrol limits
Alerts and Event-Driven Agent ProcessingAlerts and Event-Driven Agent ProcessingCourtesy Anders Stjarne

26
OLAP Pros and ConsOLAP Pros and Cons
27
On-Line Analytical On-Line Analytical ProcessingProcessing
Strengths of OLAP Strengths of OLAP Powerful visualization ability via GUIPowerful visualization ability via GUI Fast, interactive response timesFast, interactive response times Analysis of time seriesAnalysis of time series Deductive discovery of Deductive discovery of
clusters/exceptionsclusters/exceptions Many OLAP products available and Many OLAP products available and
integrated to DB productsintegrated to DB products

28
On-Line Analytical On-Line Analytical ProcessingProcessing
Weaknesses of OLAP Weaknesses of OLAP Does not handle continuous variablesDoes not handle continuous variables Does not automatically discover Does not automatically discover
patterns and models patterns and models Generation of a complex hypercubes Generation of a complex hypercubes
require some training and experiencerequire some training and experience Hypercube generation and update - Hypercube generation and update -
MOLAP Vs. ROLAPMOLAP Vs. ROLAP
29
On-Line Analytical On-Line Analytical ProcessingProcessing Products and SuppliersProducts and Suppliers
http://en.wikipedia.org/wiki/http://en.wikipedia.org/wiki/Comparison_of_OLAP_ServersComparison_of_OLAP_Servers
30
Overview of Overview of IBM Cognos Insight OLAPIBM Cognos Insight OLAP
Intro:Intro:http://www.youtube.com/watch?http://www.youtube.com/watch?v=ugczSGNVXlUv=ugczSGNVXlU
In In depth:depth:http://www.youtube.com/wathttp://www.youtube.com/watch?v=bNw89HUHKEkch?v=bNw89HUHKEk

31
TutorialTutorial
IBM Cognos InsightIBM Cognos Insight


![Data Visualization Daniel Silver March, 2014 [number of slides courtesy of Stan Matwin]](https://img.dokumen.tips/doc/110x75/56649db65503460f94aa884a/data-visualization-daniel-silver-march-2014-number-of-slides-courtesy-of.jpg)