Embed Size (px)
Citation preview

TAREB Energy, Enviroment and climate
1 Climat ic zones
The interaction of solar radiation with the atmosphere and the gravitationalforces, together with the distribution of land and sea masses, produces analmost infinite variety of climates. However, certain zones and belts ofapproximately uniform climates can be distinguished.
The global classification of climatic zones is:
1. cool zones
2. temperate zones
3. arid / sub- tropical zones
4. tropical zones
Figure 1.1 Global distribution of climatic zones [1]
Chapter 1 Energy Comfort and Buildings
1

TAREB Energy, Enviroment and climate
2 Climatic factors
The climate of a given place / region / area is the total composition of manyfactors defining the state of the atmosphere at that place.
Such factors include temperature, humidity (wetness / dryness), wind (speed,direction), atmospheric clarity (or dustiness) etc. Some of the major factorsinfluencing climate on a global scale will be further explained below.
2.1 Solar radiat ion
The sun is the major factor influencing climates. Almost all of the energyreaching the earth comes from the sun in the form of radiation.
2.1.1 Mode of action of
2.1.1.1 Solar power
The solar constant I0 is defined as the intensity of radiation reaching the uppersurface of the atmosphere. It varies slightly due to variations of the output ofthe sun itself and due to changes in the earth- sun distance.
Regardless of these effects the “standard” solar constant at the top of theatmosphere is defined as I0 = 1395 W/m².
The amount of radiation reaching the earth´s surface depends (among otherthings) on the location and the time. For example in Germany the maximum isapproximately 700 – 1000 W/m².
The resulting energy received per unit area is equally depending on locationand time and averages for example in Dortmund, Germany, 1055 kWh/(m²a).
Chapter 1 Energy Comfort and Buildings
2

TAREB Energy, Enviroment and climate
2.1.1.2 Posit ion of the sun
The Earth´s Axis of rotation (the line between the North and South Poles) istilted to the plane of the elliptical orbit and has a constant direction. The angleof tilt is a constant 23.5°.
If the axis of earth were perpendicular to the plane of the orbit, it wouldalways be the equatorial regions which were normal to the direction of solarradiation and therefore receive the maximum intensity. There would be nosummer / winter seasons.
Due to the tilted position, the area receiving the maximum intensity moves tothe North and to the South, between the tropic of Cancer and the tropic ofCapricorn, which is the main cause of seasonal changes.
Figure 1.2 Earth- sun- relationship [2]
Chapter 1 Energy Comfort and Buildings
3

TAREB Energy, Enviroment and climate
2.1.2 Inf luences of the sun ´s posit ion on the
2.1.2.1 Intensi ty of radiat ion
The earth- sun- relationship described before affects the amount of radiationreceived at a particular point on the earth´s surface three ways:
1) The angle of incidence effects that the intensity measured on normalsurfaces is distributed on a larger surface that is tilted. This is described bythe “cosine law”, as shown below.
Figure 1.3 Angle of incidence of the sun [2]
2) The longer the path of radiation through the atmosphere (due to lower solaraltitudes caused by the earth- sun- relationship), the higher is theatmospheric depletion. Atmospheric depletion (i.e. absorption, dispersionand reflection) creates a reduction factor of 0.2 to 0.7, generated by the theabsorption of radiation by ozone, vapours, smoke and dust particles in theatmosphere.
Chapter 1 Energy Comfort and Buildings
4

TAREB Energy, Enviroment and climate
Figure 1.4 Length of path through the atmosphere [2]
Figure 1.5 Passage of radiation through the atmosphere [2]
Chapter 1 Energy Comfort and Buildings
5

TAREB Energy, Enviroment and climate
3) The duration of sunshine varies also due to the earth- sun- relationship andinfluences the radiation at the earth´s surface. The varying length of thedaylight period between summer and winter in high latitudes is a well -known effect.
2.1.2.2 Thermal balance
The total amount of heat absorbed by the earth each year is balanced by acorresponding heat loss. Without this cooling the temperature of the earth andits atmosphere would increase day by day.
There are three processes of earth´s heat loss, as shown in the picture below:
Figure 1.6 Heat release from the ground and the atmosphere [2]
1. Long- wave- radiation to cold outer space (only 16% of this reradiationescapes to space, the rest is absorbed again in the atmosphere)
2. Evaporation: As liquid water changes into vapour and mixes with air, theearth´s surface is cooled.
3. Convection: Air heated by contact with the warm earth surface becomeslighter and rises to the upper atmosphere, where it dissipates its heat tospace.
Chapter 1 Energy Comfort and Buildings
6

TAREB Energy, Enviroment and climate
2.1.2.3 Sky condit ion
As described before, the amount of solar radiation passing through theatmosphere depends significantly on the amount of water vapour it contains.The presence or absence of clouds in the atmosphere relative to the total sizeof visible atmospheric hemisphere is usually expressed as a percentage.
For example a cloudiness of 50% would indicate that half of the skyhemisphere is covered by clouds.
The following picture shows different sky conditions. With special cameras youcan take such hemispherical pictures (imagine you lying on the ground,looking to the sky).
Figure 1.7 Sky condit ions ( 0%, ~80%, 100% cloudiness)
On the left picture, the hemisphere contains no clouds (0% cloudiness), on theright picture the cloudiness is 100 %. From the picture in the middle you canmeasure the sky´s and the clouds´ surfaces and thereby calculate the actualcloudiness factor.
2.2 Air temperature
Temperature is usually expressed in degrees Celsius ( °C ), but absolutetemperature is usually expressed in Kelvin (K), which is a SI-Unit (SI:International System of Units). The Kelvin scale starts at - 273.15 °C and goes bythe same steps as °C.
Therefore the freezing point of water (0 °C) is already 273.15 K.
This leads to the relation
Chapter 1 Energy Comfort and Buildings
7

TAREB Energy, Enviroment and climate
°C = K - 273,15 and K = °C + 273,15.
The differences between two temperatures is expressed in absolute values, i.e.Kelvin. For example: The difference between 10°C and 15 °C is 5 K, or thetemperature is rising by 3 K from 15°C to 18 °C.
In some English- speaking countries usually temperature is measured on theFahrenheit scale (°F) where the freezing point of water is 32 °F (0 °C).
The relation of the Fahrenheit scale to the SI-Unit Kelvin is described by
K = (°F + 459,67) / 1,8 and °F = K x 1,8 – 459,67.
This shows, that the difference between for example 20 °F and 21 °F equals only0,56 K.
Herewith you can make a conversion between the °C and the °F scale using theformula
°C = (°F - 32) / 1,8 and °F = °C × 1.8 + 32.
2.2.1 Measured quanti t ies
The most interesting measured quantities are � air temperatures and � surface temperatures. In the appraisal of climates the differences between minimum and maximumtemperature in any day can also be helpful.
2.2.2 Essential quanti t ies in solar influence
The air and surface temperatures of climates are particularly influenced by� solar radiation (Intensity [W/m²] and Duration [h])� winds (velocity [m/s], duration [h] and direction) caused by global weather
conditions� local influences, especially at ground level.
2.2.3 Mechanisms of heating and cooling
In detail temperatures are influenced by the following mechanisms:� Solar radiation heats the atmosphere (through absorption by water vapour,
dust, CO2, etc) and the ground � The energy absorbed by the ground and other surfaces is transformed into
infra- red (IR) radiation� The IR radiation emitted by the ground cools the ground. This effect
diminishes with growing cloudiness.� The IR radiation emitted can be absorbed by the atmosphere again. This
heats the atmosphere and the ground.
Chapter 1 Energy Comfort and Buildings
8

TAREB Energy, Enviroment and climate
� With increasing levels of CO2 and other absorbing “greenhouse” gases theheat becomes trapped in the atmosphere and causes the “greenhouseeffect” (see section 3.2.1 below).
� The warm air above warm grounds rises. This effect leads to an airmovement at ground level which is called thermal lift. This thermal liftdissipates energy and cools the ground.
� Evaporation of water cools the atmosphere immediately above the areawhere it evaporates. Winds may modify this situation by transporting themoist air somewhere else. At ground level humid surfaces (water bodies,fountains, plants etc.) pass vapour to the air.
The impact of cloud conditions on temperatures is shown in the followingdiagram.
Figure 1.8 Impacts of cloudiness on temperatures [3]
2.2.4 Other inf luencing parameters
Climate is also influenced by other parameters, such as� Topography / Slope towards the sun:
Plains, inclinations, valleys and mountain peaks have differentabsorptions, wind situations etc.
� Vegetation:
Chapter 1 Energy Comfort and Buildings
9

TAREB Energy, Enviroment and climate
Trees act against prevailing temperature layering by mixing the air.Furthermore shading and evaporation by trees as well as fromvegetation and crops have a cooling effect.
� Dry pavements:The warming effect of different surfaces depends on their colour(reflection / absorption / emittance) and thermal storage capacity.
� Water surfaces:Water surfaces reflect some radiation and water is evapourated at thesurface, cooling the body of the water. At the same time water tores alot of thermal energy due to its good thermal capacity. As a result,water bodies have a balancing influence on the climate of a locality andeven larger areas when they act in conjunction with other factors (esp.wind).
Figure 1.9 Different urban surfaces (dry pavements, water surfaces) influencingthe climate
Chapter 1 Energy Comfort and Buildings
10

TAREB Energy, Enviroment and climate
� The Heat island effect:Due to different wind situations, surfaces, thermal storage ofbuildings, industrial and transport activities and other anthropogenicfactors there is a significant difference between city- and ruraltemperatures.
Figure 1.10 Urban Heat - Island Profile
2.3 Winds
Air movement is another important part of climate, in local as well as in globaldimensions. Through the action of winds the different climatic zones interactwith each other..
2.3.1 Quanti t ies of measurement
The first important vaeiable is the windspeed, usually measured in m/s. Freewind velocities are normally recorded in open flat country at a height of 10 m.Measurements in urban areas are often taken at a height between 10 and 20m to avoid obstructions. Velocities near the ground are lower than the freewind speed.
The other important consideration is the wind direction. This is usuallygrouped into eight: the four cardinal (N., E., S. and W.) and four semi- cardinalcompass points (NE., SE., SW. and NW.). Occassionally these 8 are furthersubdivided into 16 (e.g. NNW, WNW, NNE etc)
Chapter 1 Energy Comfort and Buildings
11

TAREB Energy, Enviroment and climate
The exact direction can be described in a degree- scale, where North usually is0 ° growing clockwise. This degree scale is called the bearing or azimuth.
2.3.2 Data sources
Wind data can be received from special literature such as standards, TestReference Years (TRY) and other weather data files.
From for example hourly data statistics on wind direction a picture of theprevailing (i.e. Most likely) wind direction can be deduced and a “wind rose”showing the likelihood of winds from different directions can be compiled.Average windspeeds and their distribution can be computed as well aspredictable daily or seasonal shifts.
2.3.3 Global dif ferences in air pressure
Winds are basically convection currents in the atmosphere, tending to even outthe differential heating of various zones. The pattern of movements ismodified by the earth´s rotation.
Figure 1.11 Global wind pattern [2]
2.3.4 Result ing weather systems
The global wind patterns described before, result in four different zones:
Chapter 1 Energy Comfort and Buildings
12

TAREB Energy, Enviroment and climate
� Tropical or equatorial zones between the tropics of Cancer andCapricorn with strong thermal air movements, NE-winds north of theEquator and SE-winds south of the Equator. There is little seasonal anddiurnal (daily) of temperatures in these areas, and humidities are oftenhigh.
� The Inter- tropical convergence zone, with calms and unsteady winddirections. Within this zone the wind patterns shift seasonally fromnorth to south and back again. Most arid (dry) areas are found in theselatitudes and there tends to be a relatively large seasonal and diurnaltemperature swing.
� Mid- latitude westerlies between 30 ° and 60 ° N and S, where SW-winds (northern hemisphere) and NW-winds (southern hemisphere)dominate as a physical reaction (“Coriolis force”) to the tropic airmovements.
� Polar winds, thermally induced, from colder to warmer zones (NE- orSE-winds).
Figure 1.12 Seasonal shift of the inter - tropical convergence zone [2]
2.3.5 Local situat ions close to the ground
The topography and type of ground cover affects the wind speed gradient.
Near to the ground the wind speed is always less than higher up, but with anuneven ground cover the rate of increase in speed with height is much morethan with an unbroken smooth surface, such as water.
Wind speed can be reduced after a long horizontal barrier for example by 50%at a distance of ten times the height and by 25 % at a distance of twenty timesthe height.
Chapter 1 Energy Comfort and Buildings
13

TAREB Energy, Enviroment and climate
Figure 1.13 Wind velocity gradients for dif ferent topographies [2]
2.4 Humidity
In addition to temperatures and winds, humidity is the third importantparameter in climate. It appears as vapour and rainfall. Rainfall is measured inmm/a
2.4.1 Rainfal l quanti t ies
Depending on the climatic zone and regional influences the periodical rainfallquantities vary a lot.
� The mean global rainfall is about 860 mm/a.
� The minima in warm- dry zones are < 250 mm/a.
� The maxima appear in warm- humid zones. They may reach or exceed 2000mm/a .
Chapter 1 Energy Comfort and Buildings
14

TAREB Energy, Enviroment and climate
Figure 1.14 Global rainfal l quantit ies [1]
2.4.2 Magnitudes of inf luence
As described before, evaporation is powered by insolation. This means thathigh temperatures cause intense evaporation which leads to intense rainfalls.This can cause high humidity in warm zones near the equator. However manyhot dry areas also have high levels of solar radiation, this can dry the soil andthe air giving low humidities and big temperature ranges where littlevegetation is present.
2.4.3 How relative humidi ty works.
The humidity of the air is often expressed as the “relative humidity”. This canbe a difficult concept because relative humidity depends as much on the airtemperature as on the actual amount of water vapour present in the air. Athigher temperatures, air can contain more water vapour, than at coldtemperature.
For example:� Imagine 1 m³ of air at a temperature of 20 °C. Let this air contain 7.36 g of
water vapour per kg of dry air. This means, the absolute humidity (AH) is7.36 g/kg.
� The relative humidity (RH) is only 50%, because the saturation (100 %relative humidity, RH) of 20 °C- warm air is at 14,9 g/kg.
Chapter 1 Energy Comfort and Buildings
15

TAREB Energy, Enviroment and climate
� If the air (20 °C, 50 % RH) is heated to 30 °C, the AH stays the same (7.36g/kg), but the RH reduces to approx. 28 %, because saturation of 30 °C-warm air is at 27.5 g/kg. These correlations are non- linear!
Humidity can be absorbed until the saturation for the actual air temperature isreached.
During the day (especially in the morning), as the lowest layer of air is beingheated by the ground surface, evaporation increases, the vapour can beassimilated by the warm air. Winds even out the differences in air temperatureand humidity between lower and higher air layers.
As long as temperature is rising and the absolute humidity keeps its level, therelative humidity decreases.
In the evening and during the night, the situation is reversed. Especially on aclear night with still air, as the lowest layer cools, its relative humidityincreases, the point of saturation is soon reached and with further cooling theexcess moisture condenses out in the form of dew.
When the air reaches the dewpoint temperature fog will start to form, and ifthere is no further rapid cooling and no air movement, a thick layer of fog candevelop near to the ground.
Chapter 1 Energy Comfort and Buildings
16

TAREB Energy, Enviroment and climate
Figure 1.15 Example of daily course of relative humidi ty in January and July [3]
3 CONTEXT
3.1 ENVIRONNENTAL CONSCIOUS DESIGN
An awakening to environmental problems began at the end of the twentiethcentury, both on the part of the public and private decision makers, and fromthe general public. In particular concerns arose about:
� the destruction of the ozone layer,� climate change caused by greenhouse gas emissions,� management of waste,� pollution of water resources,� storage of the radioactive products,� decrease in natural resources,� attacks against bio- diversity,� etc...
Chapter 1 Energy Comfort and Buildings
17

TAREB Energy, Enviroment and climate
Militancy of some ecological organizations led to decisions at the internationallevel:
� 1972 Stockholm : first international conference on the environment,� 1987 protocol of Montreal : protection of ozone layer by the prohibition
of some refrigerants,� 1992 Rio : introduction of the concept of sustainable development,� 1997 protocol of Kyoto : the fight against climate change.
and to the introdution of environmental legislation and changes in industrialpractice.
However, much remains to be done:� in information and education,� in the training of professionals,� in the development of technologies which respect the environment, � in the creation of, and the respect for, a legal framework,� in the research and the development of new technologies.
3.2 GREENHOUSE EFFECT
Among the environmental impacts of human activities, the emmission ofgreenhouse gases is a significant threat in the medium term. The constructionsector is strongly involved there (Fig 1.16) because of its energy consumption(responsible for about 20% of the emissions):
� when manufacturing constitutive materials (extraction, transformation,transport...),
� when the construction is built (building worksite),� during use (heating, air- conditioning, lighting...).
Chapter 1 Energy Comfort and Buildings
18

TAREB Energy, Enviroment and climate
Figure 1.16 greenouse gas emissions by sector (Ademe / PNICC)
Though the greenhouse effect is one aspect of the environmental impact ofhuman activities. It is not obviously the only one to be considered within thefield of "sustainable development".
3.2.1 mechanism
The greenhouse effect is a natural mechanism caused by the presence ofvarious gaseous compounds in the Earth's atmosphere.
A large part of solar energy, mainly short wave infra- red and visible radiation,arrives on the ground through the atmosphere (weak reflexion and weakabsorption). A fraction of this radiation is reflected by the ground and goesback in space, the remaining part is absorbed by the ground, which leads to itsheating and that of the very low layers of the atmosphere (Fig. 1.17).
Figure 1.17 Radiation exchanges in the atmosphere (Manchester university)
Then, the heated ground emits long wave energy by radiation. This radiationpasses through the atmosphere, where some gases are not very transparent tolong infra- red radiation. Thus a part of the radiation from the ground isabsorbed or returned towards the ground instead of disappearing in space.
Chapter 1 Energy Comfort and Buildings
19

TAREB Energy, Enviroment and climate
This phenomenon is similar to that of a greenhouse, the glazed cover acting inthe same way: letting though the visible radiation from the sun and absorbingthe infra- red radiation from the ground.
There is a lot of greenhouse effect gases, but in the Earth's atmosphere, themore important are the water vapor (content 3 to 4%) and carbon dioxide(content 0.03- 0.04%).
Gas Greenhousecontribut ion
H2O water vapor 55%CO2 carbon dioxide 39%CH4 methane 2%N2O nitrous oxide 2%O3 ozone 2%
Table 1.1 Greenhouse contr ibut ions
The contribution of water vapor is considered separately, because humanactivity does not have a quantifiable influence on it. However carbon dioxideplays an essential role in causing the greenhouse effect (Fig 1.18).
Figure 1.18 contribut ions to dif ferent greenhousse gases by source (Ademe / CITEPA)
3.2.2 Temperature on the ground
The average temperature of the Earth on the ground level is directly related tothe energy balance between the absorbed solar radiation and the infra- redradiation emited by the ground (Fig 1.19).
Chapter 1 Energy Comfort and Buildings
20

TAREB Energy, Enviroment and climate
Figure 1.19, heat balance of the atmosphere and the ground (C.N.R.S)
Overall we should be thankful for the greenhouse effect. Without it, thebalence temperature of the ground would be minus18 [°C]. With the currentcomposition of the atmosphere, it is about 15 [°C] (NOTE this is an averagethroughout the year and over the whole surface of the Earth. The temperatureis obviously variable around this value according to the place and time).
3.2.3 Greenhouse effect gas content
The carbon dioxide content of the atmosphere results from a balance between(Fig 1.20):
� CO2 emissions : natural chemical conversions of vegetation and earth,salting out of the oceans, volcanic activity, forest fires and so on. TheCO2 created by human activity is added to these natural releases,primarily through the combustion of fossile fuels (gas, coal, oil),
� CO2 absorptions : storage by photosynthesis in vegetation, dissolvingin the oceans. These are called the "carbon sinks".
Chapter 1 Energy Comfort and Buildings
21

TAREB Energy, Enviroment and climate
Figure 1.20, the carbon cycle (Ademe / I.P.C.C)
3.2.4 Evolutions
The carbon dioxide content of the atmosphere has not always been rthe same.Samples from the deep ices of the poles (Fig 1.23) makes it possible to goback up to more than 500 000 years and to highlight the correlation between:
� CO2 content, measured in the microbubbles of air included in the ice,� the temperature, determined by the nature of crystallization during the
formation of the ice, the isotopic composition of water and the oxygencontent (fig 1.21)
Chapter 1 Energy Comfort and Buildings
22

TAREB Energy, Enviroment and climate
Figure 1.21 1.22. Changes in the composit ion of the atmosphere over time (UniversitéLaval / I.P.C.C / Ademe)
Chapter 1 Energy Comfort and Buildings
23

TAREB Energy, Enviroment and climate
Figure 1.23, taking an ice core (Ademe / IFRTP)
This correlation is well found by the coupled modeling of the heat balance andcarbon dioxide balance of the Earth (Figs 1.21 and 1.22).
Figure 1.24 Recent changes in CO2 content of the atmosphere (Université Laval / I.P.C.C)
However, the human activity seems responsible for a fast rise in CO2
concentration ("anthropic" production). Thus, in one and half centuries, the
Chapter 1 Energy Comfort and Buildings
24

TAREB Energy, Enviroment and climate
greenhouse gas content has increased approximately of 30% from 280 ppm to360 ppm, (a "ppm" being a part per million, or one millionth volume). This hasled to a rise of 0,6 [°K ] in the average temperature and an increase of the sealevel of from 10 to 25 [cm] (e.g. A 1 [°K] increase of the average temperatureat La Rochelle since 1946).
This variation is very new in its speed and its scale, because the temperatureof the Earth did not change more than 4 [°K] between glacial and hot periods,over the last 400 000 years.
The 1990s were the hottest decade of 20th century (Fig 1.25). Models predictan incease in the average temperature of from 1,5 to 5,8 [°K] during the 21stcentury, concurrent with a CO2 concentration ranging between 500 and 1000ppm. Strong uncertainty still results from an incomplete account of the oceansand from uncertaintities about the future emissions scenario (Fig 1.26).
Figure 1.25 changes in the global mean temperature over the last 150 years (UniversitéLaval / I.P.C.C)
Chapter 1 Energy Comfort and Buildings
25

TAREB Energy, Enviroment and climate
Figure 1.26 Predicted increases in global temperatures according to various scenarios(Université Laval / I.P.C.C)
According to the Intergovernmental Group on Climate Evolution (G.I.E.C, 2002report), the foreseeable consequences are:
� a rise of the ocean levels of from 0,1 to 1 [m] (thermal dilatation,continental ice melting),
� an important change in the climate,� an impact on fauna and flora : displacement of populations or
disappearance, no species being able to accept without damage so fastenvironmental evolutions.
For France, the average variation in temperature is estimated around +2 [°K],but it could strongly fall (- 4 [°K]) on the Atlantic coast because of theweakening of the Gulf Stream. Strong marine erosion is expected andsubmerging of the land. More rain is expected in winter (but no snow under1500 [m]) and more drought in summer. Globally, rainfall will increase in thenorthern part and decrease in the south. Marshy land could becomewidespread.
On the whole Earth, climate change could generate 150 million "climaticrefugees".
Chapter 1 Energy Comfort and Buildings
26

TAREB Energy, Enviroment and climate
3.3 REDUCTION OF THE EMISSIONS
3.3.1 Balance of the emissions
All the greenhouse effect gases do not have the same influence on globalwarming. Carbon dioxide is taken as reference to establish the capacity forglobal heating (Global Warming Potential G.W.P). By considering the effectsover the same time (generally of a century), one can establish the followingequivalences:
GAS G.W.P100
CarbonDioxide CO2
1
méthane CH4 21NitrogenOxide N2O
310
H.F.C 140 to11700
P.F.C 6500 to9200
SF6 23900
P.F.C : Perfluorocarbonates
Table 1.3. Global Warming Potential of different greenhouse gases
From this equivalence coefficient, we can enter an emission in "equivalentCO2".
However this methodology of "relative" G.W.P is often discussed because ittakes little account of the lifetime of the gas in the atmosphere. Thus, theaction of methane is it significant, but only over a short time scale becausemethane disappears in 12 years approximately (rain, dissociation,recombination, absorption) whereas the action of CO2 can last up to 200 years.Thus over one century, the total effect of CO2 is not taken into account,whereas the total effect of the CH4 is considered. It is the same for certainrefrigerants (R13A : 14 years) whereas the very prolonged action of certainhalocarbons (up to 50 000 years) is also not correctly reflected.
That gives place to discepances on the value of the G.W.P (Picture 1.3.a), itwould be thus better to introduce an "absolute" G.W.P bearing on the radiativeeffect cumulated during all the lifetime of gases. Such values (in[ W/m
2.year.ppm ]) are sometimes used.
Table 1.4 PRG over different time periods (I.P.C.C)
Chapter 1 Energy Comfort and Buildings
27

TAREB Energy, Enviroment and climate
Carbon combination:
C + O2 → CO2
gives 44 [g] of carbon dioxide (12+2x16) for 12 [g] of carbon. The ratio:
���������� ��� ���
is used as a basis for the definition of "the carbon equivalent":
1 Ton CO2 ⇔ 0,2727 Ton Carbon
The evaluation of the emissions in "carbon equivalent" could be used as abasis for a future environmental tax.
3.3.2 Inequali t ies in emissions
It has been computed that an emission of 500 [ kg ] of carbon equivalent percapita and per year (1,8 ton of equivalent CO2) can enter the carbon cyclewithout causing a continuous increase in the greenhouse effect.
All the developed countries are over this limit (Table 1.5).
Country Annual emmissions in CO2 equivalent (CO2,CH4, N2O) (millions of Tonnes)
1990 1998
Germany 1201 1012
Italy 515 541
Spain 301 325
UK 759 684
Sweden 69.5 63.3
France 632 641
EU 4159 4015
USA 5903 6514 (1997)
Canada 591 675 (1996)
Japan 1175 1280 (1997)
Russia 2999 2111 (1994)
Table 1.5 annual carbon emmissions by country (CITEPA 2003)
Chapter 1 Energy Comfort and Buildings
28

TAREB Energy, Enviroment and climate
The average emission of the industrialized countries is around 5 tons ofequivalent CO2 per year and per capita, it is only 0,4 ton in third countries(Table 1.6 and Figure 1.27).
Table 1.6 Carbon emmisions per head by country (CITEPA 2003)
Figure 1.27 Carbon emmissions per head and gross national product (units?) (Ademe /EnerData)
Chapter 1 Energy Comfort and Buildings
29

TAREB Energy, Enviroment and climate
15% of the Earth's population emit 50% of greenhouse gases (World Bank), or25% of the population emit 75% of greenhouse effect gases (CITEPA).
France is in a median situation with its partners, with an average emission of2000 [kg] of carbon equivalent per capita and per year.
3.3.3 Engagements
The "Earth Conferences", firstly it in Rio in 1992, concretised the internationalawakening with respect to climatic change.
The aim of the Kyoto protocol (1997) is to decrease greenhouse gas emissionsfor 38 industrialized countries (Table 1.7). For 2010, the European Union (15countries) will have to decrease its emissions by 8% compared to 1990(objective to be reached between 2008 and 2012). India and China, largepotential emitters, do not have obligations until 2012.
Table 1.7 changes in Carbon emmissions for European countr ies suggested by theKyoto agreement (Ademe)
Chapter 1 Energy Comfort and Buildings
30

TAREB Energy, Enviroment and climate
Figure 1.28, Graphical represetation of Kyoto changes
France "supported" by its hydroelectric and nuclear electricity generation willhave to stabilize its emissions at the level of those of 1990. Taking intoaccount the growth envisaged for this period, an improvement of the totalenergy efficiency of fossile fuels of about 20% that will be necessary to obtainthis result (Figure 1.29).
Figure 1.29 changes in French CO2 production in the years 1990 - 2001 (Ademe /CITEPA)
Den Hagen Conference (2000) did not completely succeed in defining methodsof setting Kyoto protocol. In Bonn (2001), the international community laiddown these methods, in spite of the withdrawal of the United States ofAmerica.
In Marrakech (2001), the legal rules necessary to the ratification and theeffective setting of the Protocol were adopted.
With the obligations of reduction of emissions, a "market of emission licence"between industrialized countries and developing countries was authorized. Inthe same way, excessive emissions could be compensated by non- pollutingindustrial investments (except nuclear power) in a developing country.
The current evolution of the global CO2 emissions remains very unfavourable.The International Energy Agency records that from 1990 to 2000, the increasewas +13%, and that, on this rate, it will reach +29% instead of the desiredreduction of 5,2% for all industrialized countries.
3.3.4 Actions
There are many actions which can be put in place, for example:� to increase the proportion of renewable energies (low or zero
emissions) in the production of electricity and heating,� to improve the energy efficiency for industrial processes and energy
Chapter 1 Energy Comfort and Buildings
31

TAREB Energy, Enviroment and climate
production,� better control of industrial processes,� to promote energy saving, which is the main to reduce greenhouse gas
emissions.
That needs at least:� more constraining regulations, on the European and National level,� an new research and development policy,� tax incentives or targeted financial assistances, or taxes on the
emissions,� information and education of the populations.
Today, the achievement of French comitments seems difficult to reach withoutan intensification of existing efforts.
3.3.5 Polemic
The climatic change is always the subject of a polemic between scientists onthe one hand, and politicians on the other hand.
From a scientific point of view, the report of global warming is currentlyrecognised by almost the whole research community. But differences appearon the influence of the CO2 human emissions over and above the naturalvariation of the climate. The warming effect on climate are also the object ofdifferent hypotheses, from the worst catastrophia to an unconditionalconfidence in the adaptive capacity of nature (and humans).
From a political point of view, one cannot neglect the influence of industriallobbies (oil and mining companies, nuclear industry). In addition, thefulfillment of the Kyoto protocol will have a social and financial cost (of asmuch as 1000 billion dollars), and a questioning of the consumerist way oflife, which will be accepted with difficulty by the inhabitants of industrializedcountries.
Finally, beyond uncertainties, the environmental benefit of Kyoto protocolremains weak, since the estimated influence on the average temperature in2100 would be only 0,15 [°K], which would only delay the warming effect by 4or 5 years. The United States of America for example, consider the effortdisproportionate compared to the anticipated result.
Even if the alarmist vision of warming consequences would be contradicted byreality, it is necessary in any case:
� to reduce cost of heating by energy saving
Chapter 1 Energy Comfort and Buildings
32

TAREB Energy, Enviroment and climate
� to preserve limited fossil fuel resources,� to avoid air pollution,� to develop alternative technologies.
The more so if we hope that humanity will exceed 2100...
4 BUILDINGS AND ENVIRONMENT
4.1 TIME SCALE
In most of cases, a building will have a lifetime of 50 to 100 years. To becomplete, environmental impacts analysis must consider the whole "life cycle"of the building. Three periods have to be differentiated:
4.1.1 per iod of construction work
It is a quite short period (one to two years), but it can have importantenvironmental consequences. There are all the nuisances of the building site(noise, dust, disturbance of urban traffic), and the impact of manufacturingand transporting materials to the building site (materials working out, waterconsumption, pollution and wastes of building site),
4.1.2 per iod of use
This is the longest period, in which the Interaction with the environmenthappen principally through the technical facilities (space heating, air–conditioning, sanitary installations) and the managment of domestic waste.Remember also that during this period there will be retrofitting to replaceworn out items and upgrade the building.
The environmental aspect of retrofitt ing should be considered in the same wayas during the construction period, taking into account that they often include aphase of demolition and that they provide the opportunity to modify someinitial choices (improvement of the insulation, change of heating system, andso on).
4.1.3 per iod of demoli t ion
This is a very short period, that may develop some important environmentalpolution. These can be reduced by any choices made at the conception(recycling or biodegradable materials, possibility of an organized"deconstruction").
However, the long lfe of buildings means that the techniques which will beavailable at the time of the demolition are not fully understood at the designstage (or of the new appeared constraints, as for example the use of abestos).
4.2 SPACE SCALE
Chapter 1 Energy Comfort and Buildings
33

TAREB Energy, Enviroment and climate
A building presents three distinct spaces, for which the environmentalparameters are different:
4.2.1 Indoor space
This is in this space that we will create a controlled climate which has tocorrespond to many and interdependant criteria of comfort (thermal,acoustical, light) and health. This aspect is very important as human beingsspend the major part of their life in these artificial spaces.
4.2.2 Urban space
This is the immediate surroundings of the building. At this scale, there aremany environmental aspects to be considered (local atmospheric pollution,noise, management of wastes, water resources, and so on). The relations withthe city will also appear at this scale too (urban micro- climate for example).
4.2.3 Earth space
The global effects are located on this scale. It includes the use of raw materialsfor the manufacture of products for construction and the use of fossil energystocks. It includes the impact on the climate of greenhouse gas emissions, orof halogenous gases destroying the ozone layer.
4.2.4 Conclusion
The analysis of environmental impacts have therefore to consider these threespaces, otherwise there is a risk of some transfers of pollution between them.That is the case for example of the use of electricity for space heating, whichconsiderably improves the indoor environment, but results in a planetaryenvironmental impact (weak final output power plant, management of nuclearwastes).
For more detail on environmental impacts of buildings see chapter 5 of thenotes to Core Module 2 Low Energy Architecture.
5 ENERGY IN BUILDINGS
5.1 ENERGY TARGETS
Consideration of the complete set of environmental parameters on the wholelife- cycle and within all the space scales, still remains very difficult. Someevaluation tools are being developed, but a lot of information is not alwaysavailable.
For example, it is the case for embodied energy in construction products(Figure 1.30):
Chapter 1 Energy Comfort and Buildings
34

TAREB Energy, Enviroment and climate
� extraction of raw materials,� working out of the construction products,� using of it.
Figure 1.30 relative embodied energy of different building materials (Liebard et DeHerdre / L.E.S.O)
This energy has a direct influence on the building CO2 emissions, even beforeuse (Table 1.8).
Table 1.8 comparison of a tradit ional building and one with materials having lowembodied energy (Liebard et De Herdre / E.H.T / Mines de Paris)
The energy necessary for construction and for the destruction of the buildingand the embodied energy in materials, is imperfectly quantified, but it remainssmall in comparaison with the amount of the energy consumed during theperiod of use. For example, the embodied energy of mineral wool used for the
Chapter 1 Energy Comfort and Buildings
35

TAREB Energy, Enviroment and climate
insulation is equivalent to the energy saved by insulation during just onewinter month.
Among the identified targets of a building environmental quality, we candefine three important related targets (Table 1.9 and Fig 1.31):
� management of energy,� hygrothermal comfort,� good indoor air quality.
Chapter 1 Energy Comfort and Buildings
36

TAREB Energy, Enviroment and climate
Table 1.9 considerations for the external and internal environment of buildings(Association "H.Q.E")
Chapter 1 Energy Comfort and Buildings
37

TAREB Energy, Enviroment and climate
Figure 1.31 Targets for a good building (Association "H.Q.E")
5.2 ENERGY MANAGEMENT
In France (but in the European Union too), the energy consumption of thebuilding sector represents more than 40% of the final energy (Picture 3.2.a etPicture 3.2.b), of which 2/3d for the space heating, the air- conditioning anddomestic hot water, and 1/3d for the lighting and domestic appliances (Picture3.2.c).
Chapter 1 Energy Comfort and Buildings
38

TAREB Energy, Enviroment and climate
Chapter 1 Energy Comfort and Buildings
39

TAREB Energy, Enviroment and climate
Table 1.10 , table 1.11, figure 1.32 (Ministère de l'économie, des finances et del'industrie)
Figure 1.33 Energy use by building type and source (Ademe)
Chapter 1 Energy Comfort and Buildings
40

TAREB Energy, Enviroment and climate
Figure 1.34 Changes in energy use (France) (Ministère de l'économie, des finances et del'industrie)
Note the important part played by electricity in energy production, fuel andgas being strongly in competition (Fig 1.35).
Figure 1.35 changes in energy source (France) (Ademe)
If we consider the impact at the local or worldwide scale of this energyconsumption, around 20% of the greenhouse emissions (Fig 1.36), we can see
Chapter 1 Energy Comfort and Buildings
41

TAREB Energy, Enviroment and climate
the importance of its management to getting a decrease (stabilization) in itsenvironmental consequences (pollution, depletion of resources).
Figure 1.36 energy source and associated CO2 in dif ferent building types (Ministère del'économie, des finances et de l' industr ie)
Note : using "Tons of Oil Equivalent" (T.O.E) makes it possible to add andcompare energies from different origins (Table 1.12).
Table 1.12 (Ministère de l'économie, des finances et de l' industr ie)
Chapter 1 Energy Comfort and Buildings
42

TAREB Energy, Enviroment and climate
5.3 HYGROTHERMAL COMFORT
The energy consumption for space heating and air- conditioning is directlydependent of the indoor conditions set in the building (Picture 3.3.a).
Figure 1.37 dependenc of energy use on indoor temperature (Simulation sur Codyba)
For example, in permanent heating, reducing by 1 [°C] the indoor temperature(from 20 [°C] to 19 [°C] for example) generates an energy saving generallyhigher than 10%.
In the same way, programming a reduced temperature at night, or duringunoccupied periods, constitutes an effective means to save energy withoutharming the users comfort.
An accurate estimate of the indoor conditions is one part of consumptionmanagement. Various tools, such as standard EN-ISO 7730 make possible tochoose set point values according to clothing level of the occupants (Fig 1.38).Section 2 of these notes discusses ideas aboiut provision of comfort andindoor air quality.
Chapter 1 Energy Comfort and Buildings
43

TAREB Energy, Enviroment and climate
Figure 1.38 combinations of conditions for comfort according to ISO 7730 (OSI/ISOGeneva)
5.4 INDOOR AIR QUALITY
Preserving an acceptable indoor air quality requires the knowledge of:
� the nature and the action of the contaminants found in the buildings,
Chapter 1 Energy Comfort and Buildings
44

TAREB Energy, Enviroment and climate
� the allowable thresholds, taking into consideration the combined actionof contaminants and the duration of the exposure,
� the methods available to maintain the indoor conditions withinacceptable limits.
This last aspect generally requires the use of natural or mechanical ventilation.An efficient understanding of these mechnanisms allows the occupant:
� to minimize the energy consumption of the ventilation,� to optimize the outdoor air flow rate, which has among other things,
the consequence of reducing energy consumption for space heating orair- conditioning.
Many installations use an air flow, which varies according to the production ofpolluting emissions (Picture 3.4.a).
Figure 1.39 changes in venti lat ion rate to suit occupancy (Cetiat)
We indeed notice that in a building, the occupancy schedule can strongly varyduring a day, making it unecessary to maintain the maximum ventilation airflow rate (Fig 1.40).
Chapter 1 Energy Comfort and Buildings
45

TAREB Energy, Enviroment and climate
Figure 1.40 daily changes in occupancy (Revue Clim Pratique)
Control can be based on (Table 1.12):
� a flow program related to the occupation schedule of the building (clockwith possible override),
� counting the number of occupants (swivel input /output),� a presence- detector in the building (detector on the type used for
security control),� an indicator of the pollution level in of the building, like humidity
(hygroadjustable ventilation) or of the air content of carbon dioxide(probe of air quality).
Chapter 1 Energy Comfort and Buildings
46

TAREB Energy, Enviroment and climate
Table 1.12 a matr ix of requirements for good IAQ in different types of building (Cetiat)
Fans using a variable speed motor make it possible to make important savingsin electrical energy. The power consumption for a fan is roughly proportionalto the cube of the airflow. Thus dividing the flow by 2 divides electricityconsumption by 8.
6 ENERGY RESOURCES
6.1 FOSSIL ENERGIES
To satisfy the energy needs of buildings, we can use many types of energy.
Fossil fuels are those which are created through a long term process (millionsof years) by the storage of combustible material underground. For instance:
� vegetation is transformed into coal varying from the lignite (the lesselaborated) to the anthracite (the most pure),
� planktons: this transformation has given either oil or natural gas.
From an environmental point of view, the use of fossil fuels presents two mainproblems:
� depletion of limited reserves (Table 1.13), and the local impact ofmining,
� greenhouse gas (CO2) emissions into the atmosphere (Table 1.14).
Chapter 1 Energy Comfort and Buildings
47

TAREB Energy, Enviroment and climate
Table 1.13 reserves of fossil fuels and their duration (U.F.I.P / C.E.A)
Table 1.14 emmissions by fuel type (Ademe)
However the environmental impact of fossil fuels can be reduced by:� an improvement in fuel quality (e.g. reducing the sulphur content of
oil),� an increase in the energy efficiency of equipment (Table 1.15). For
medium size boilers, a regulation sets a minimal output efficiency(Table 1.16),
� optimising control of equioment for instance by a centralized BuildingManagement System.
Table 1.15 fuel efficiency of defferent equipment (U.F.I.P)
Chapter 1 Energy Comfort and Buildings
48

TAREB Energy, Enviroment and climate
Table 1.16 Output efficiency of heating appliances (Directive européenne 92/42, arrêtédu 9/5 /94)
6.2 RENEWABLE ENERGIES
6.2.1 Déf ini t ion
Any energy source which is naturally available in unlimited quantities with apermanent source of replacement is called a “renewable energy” source.Examples are:
� solar energy,� wind energy ,� biomass (which is renewed by rgrowing the vegetation),� hydraulic energy,� geothermal energy.
The replacement is not necessarily immediate (e.g. 1 year for straw, 20 to 50years for wood, several centuries for the geothermics) but it will appear intime.
By contrast coal, gas and petroleum are not renewable, because the conditionsof their creation do not any longer exist.
6.2.2 Interest
The interest in the use of renewable energies lies in:� the non- use of limited reserves (sustainable development),� in an almost nil contribution to the atmospheric pollution, at the local
and the planetary scales.
This last point is debatable: the collection of solar, hydraulic and wind energyrequires collection devices whose complete life- cycle needs consideration(e.g.fabrication, possible requuirement for electric batteries, demolition ofinstallation, use of heavy embodied energy materials as aluminium and so on).
In the case of the biomass, either by wood combustion or methane biogascreated by the transformation of waste materials, there is an emission ofcontaminants in the atmosphere, therefore an impact at the local scale.However, the impact at the earth scale remains quite small, because thereleased CO2 will have been taken from the atmosphere by the photosynthesis.Therefore we are in this case of a carbon cycle on a various decade scale.(Fig1.41).
Chapter 1 Energy Comfort and Buildings
49

TAREB Energy, Enviroment and climate
Figure 1.41 the carbon cycle (Comback)
The problem is more complex in the case of geothermal energy, which is astrong consumer of electricity, especially for the deep reinjection of usedgeothermal water. This reinjection is necessary to avoid pollution of theground and of the surface water (the geothermal water is sulphurous andheavily charged with mineral salts), but also to maintain the conditions ofexploitation (pressure of aquifer). This electrical consumption important in theenvironmental balance of the geothermal energy, but the production ofelectricity by co- generation brings an overall decrease in the planetary impact,even if it increases the impact at the local scale.
6.3 PLACE OF RENEWABLE ENERGIES
The place of the renewable energies in the global energy consumption is verydifferent according to the countries (Table 1.17).
Table 1.17 proportion of generation by renewables by country (Direction Générale del'Energie)
However, the European Union level, a trend to develop renewable energies hasbeen affirmed by the last international meetings. The ambition is to reach 12 %of the total energies consuption by around 2010 (Table 1.18).
Chapter 1 Energy Comfort and Buildings
50
TAREB Energy, Enviroment and climate
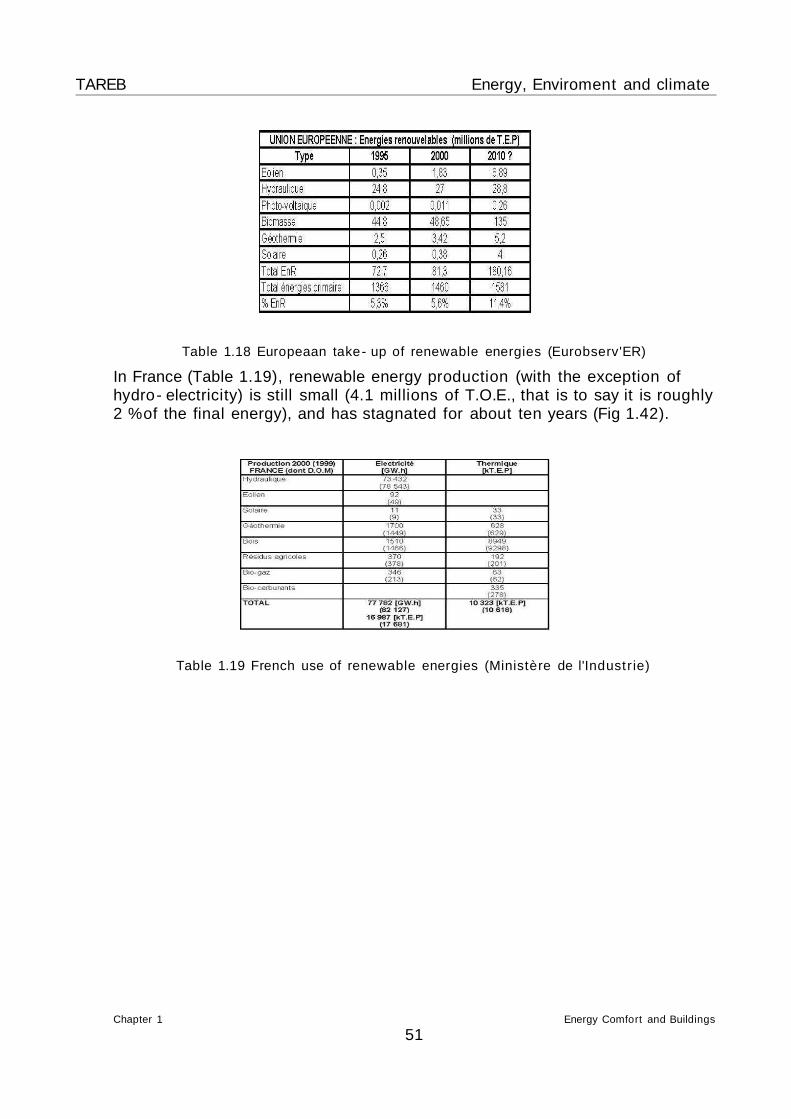
Table 1.18 Europeaan take- up of renewable energies (Eurobserv'ER)
In France (Table 1.19), renewable energy production (with the exception ofhydro- electricity) is still small (4.1 millions of T.O.E., that is to say it is roughly2 % of the final energy), and has stagnated for about ten years (Fig 1.42).
Table 1.19 French use of renewable energies (Ministère de l'Industr ie)
Chapter 1 Energy Comfort and Buildings
51

TAREB Energy, Enviroment and climate
Figure 1.42 contribut ions of renewable energies (France) (Observatoire de l'énergie /CEREN)
To reach this objective, the European states (and the European Union) havesome developed means of encouragement and promotion, for example inFrance:
� biomass: «wood- energy» program with aid for the construction of 200wood central heating plants,
� solar: Helios 2006 program with aid for the installation of 15000 solarwater- heaters per year,
� wind energy: installation of 500 MW for 2005.
6.4 INTEGRATION OF RENEWABLE ENERGIES
The use of the renewable energies in buildings is not simply a substitution of afossil energy.
In fact, the use of renewable energies requires the designer to be aware oftheir specific at requirements the beginning of the project , for example:
� solar: integration of the collectors in the architecture of the building,integration of active or passive heat storage,
Chapter 1 Energy Comfort and Buildings
52

TAREB Energy, Enviroment and climate
Figure 1.43 Photovoltaic array (Joannes)
Figure 1.44 Solar thermal (International Energy Agency)� geothermy: providing a distribution network of heating generally at city
scale and integration of the project inside this structure,
Chapter 1 Energy Comfort and Buildings
53

TAREB Energy, Enviroment and climate
Figure 1.45 Geothermal heating network (S.M.T / épocal)
Figure 1.46 (O.P.H.L.M de l'Oise)� biomass: requires a local network for the supply and the integration of
storage facilities and feed in the architectural or urban project.
Chapter 1 Energy Comfort and Buildings
54

TAREB Energy, Enviroment and climate
Figure 1.47 (O.Sebart / A.F.M.E)
Literature:
[1] Yeang, K. Bioclimatic Skyscrapers Artemis, London, Zürich, München, 1994
[2] Koenigsberger, Ingersoll, Mayhew, Szokolay Manual of Tropical Housing and Building Longman, London, 1974
[3] Recknagel, H., Sprenger, E., Schramek, E.R. Taschenbuch für Heizung + Klima Technik R. Oldenbourg Verlag, München, Wien, 1995
Further literature:
Daniels, KlausAdvanced Building Systems; A Technical Guide for Architects and
EngineersBirkhäuser Verlag, Basel, 2003
Chapter 1 Energy Comfort and Buildings
55