Embed Size (px)
Citation preview

1
Class in LibraryMultimedia Room
Mon. Tues. Wed. Thurs. Fri.Week ofOct. 20
Wet, muddy outdoor lab – wear closed-toed shoes
Week ofOct. 27
Independent project set-up
Week ofNov. 3
Forest ecology lab – dress for weather
Exam 2T lab switch?
Week ofNov. 10
Independent project analysis

2
Nutrient recycling in aquatic systems
- where is it happening?

3
-sediments not in contact with pelagic zone
- most sediments are anaerobic - reactions are slower
Pelagic zone

4
Figure 8.12

5
Cool (dense) water
Warm (low density) water
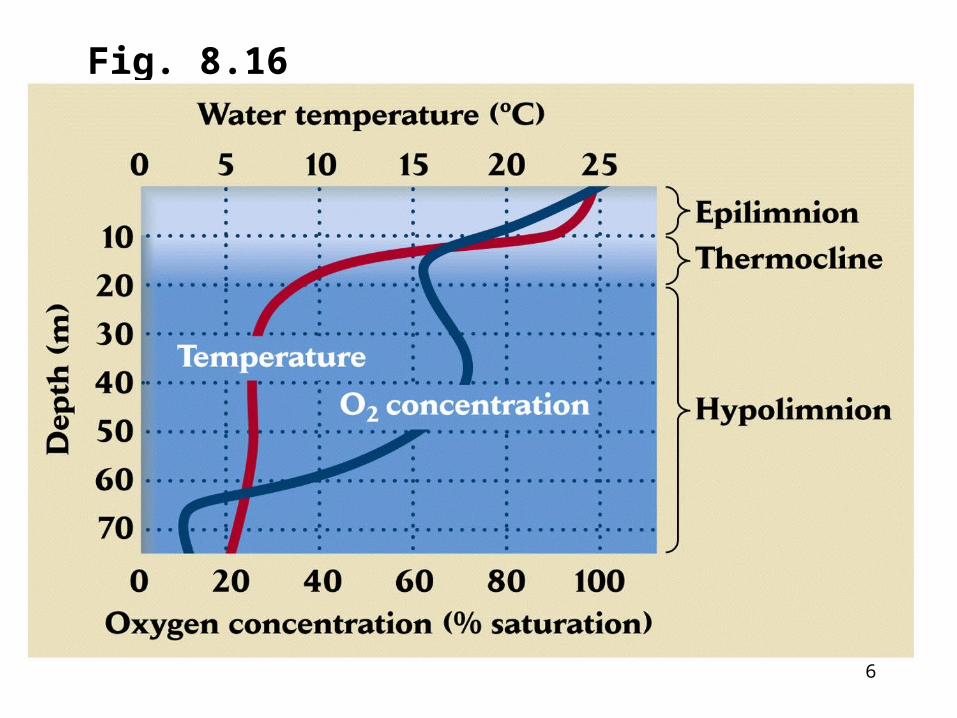
Water below the thermocline may becomedepleted of oxygen in summertime
Why?
6
Fig. 8.16
7
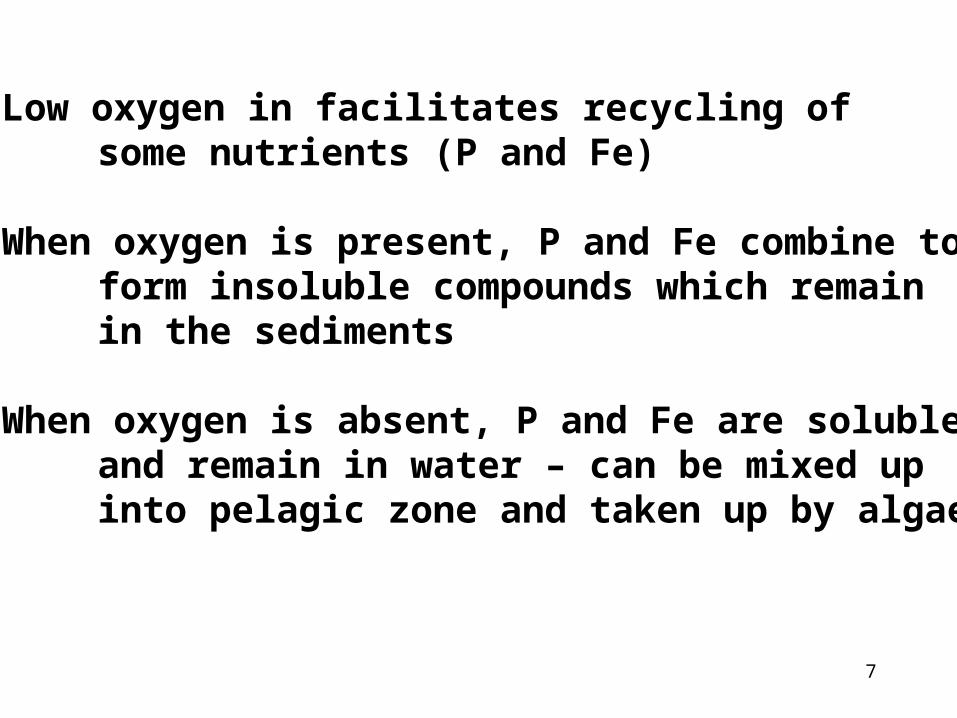
Low oxygen in facilitates recycling ofsome nutrients (P and Fe)
When oxygen is present, P and Fe combine toform insoluble compounds which remain in the sediments
When oxygen is absent, P and Fe are solubleand remain in water – can be mixed upinto pelagic zone and taken up by algae

8
Fig. 8.17

9
Which nutrient is most limiting to aquaticsystems??
What do I mean by most limiting?

10
P - limitation
N-limitation
LIS
Housatonic
Where does P-limitation switchto N-limitation?
How will changes in nutrient loading affect species composition and frequency of algal blooms?
Goal to decreaseN input to LIS by55% in 15 years

11
Example of using properties of nutrientrecycling in aquatic systems to reducealgal blooms in freshwater systems

12

13
Thermocline
Fountain
oxygen
How could this reduce algal blooms?

14
Nutrient recycling
- Terrestrial systems- soil
- weathering of rock- decomposition of organic matter
- Aquatic systems- sediments and deep water
- reactions slow (anaerobic)- decomposition not near uptake

15
Structure of course
Environmental variability
Organisms
Ecosystems
Populations
Species interactions
Communities
Applied Ecological Issues

16
Outline
Introduction
How are populations defined and measured?
How do populations grow?
How does population size change through time and space?

17
Population - group of organisms of the same
species that live in a particular area
Population ecology - focus is on changes in the
number of individuals over time

18
Questions asked by population ecologists
What limits population growth?
What causes variability in population size?
How do population in different geographic areas interact?
How does the number of adults in a population change relative to the number of juveniles?

19
How are populations defined?

20
Figure 13.4

21
Figure 13.3

22
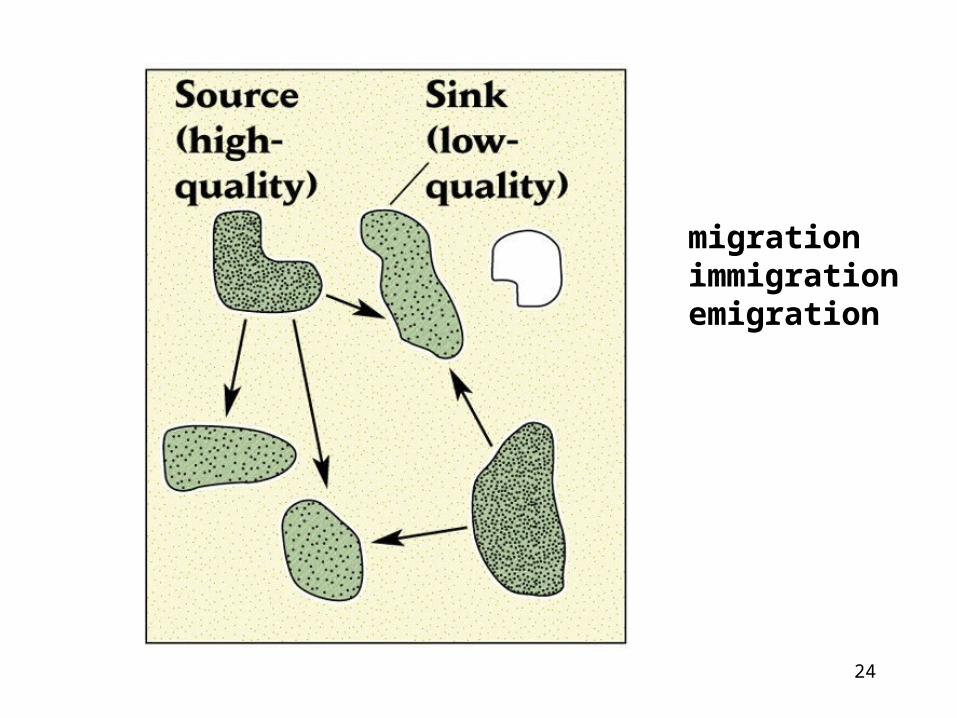
Subpopulation – subsets of the
population that are separated and
have limited exchange
How much movement is there between
subpopulations?

23
Figure 13.9
24
migrationimmigrationemigration

25
Humans like to manage population size of other organisms
Examples????
In order to manage population size, have to be able to measure it and have to be able to understand what makes population change in size

26
How are populations measured?
1. What do we measure?
2. How?

27
What do we measure?
Total population size = number of individuals
How they are arranged in space
How many are in each age or size class

28
Population structure – the density and
spacing of individuals within a habitat
and the proportions of individuals
within each age or size class

29
Total population size = number of individuals
= density x area

30
Mark – recapture methods
1. Catch some individuals and mark them
2. Put them back and let them mix
3. Recapture some individuals and count how many are marked
4. Ratio of marked to unmarked gives an estimate of population size

31
N = total number of individuals
M = number of marked individuals
n = number of recaptured individuals
x = the number of recaptured individuals who were marked
N = nM/x
32
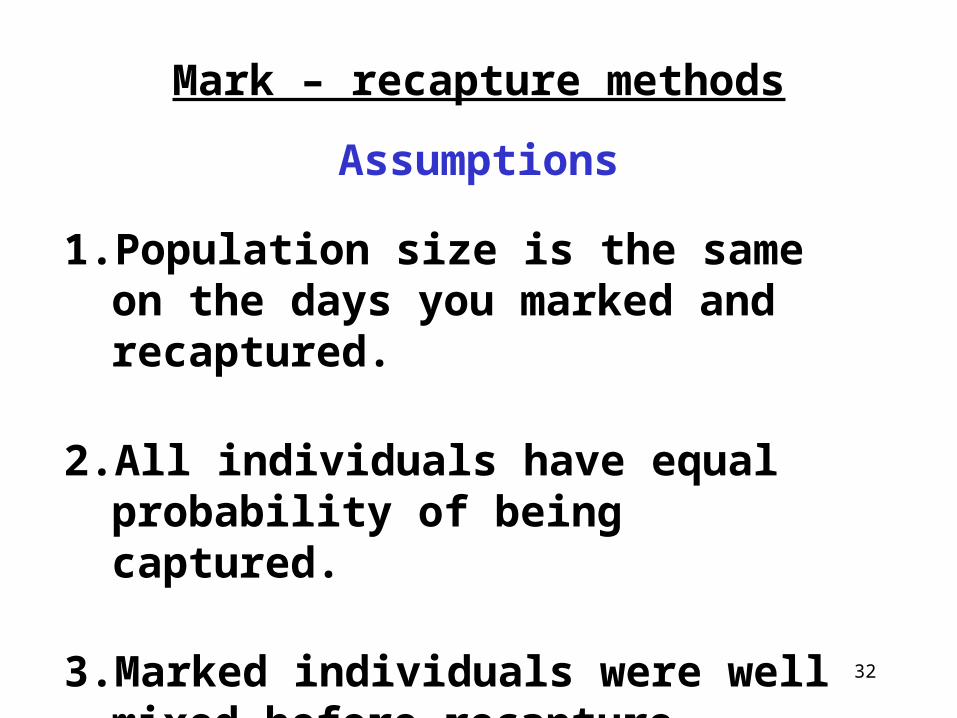
Mark – recapture methods
Assumptions
1. Population size is the same on the days you marked and recaptured.
2. All individuals have equal probability of being captured.
3. Marked individuals were well mixed before recapture.

33
What do we measure?
Total population size = number of indivduals
How they are arranged in space
How many are in each age or size class

34
Figure 13.5
There is a simple statistical test to test for distribution
Mechanisms?
35
What do we measure?
Total population size = number of indivduals
How they are arranged in space
How many are in each age or size class

36
Outline
Introduction
How are populations defined and measured?
How do populations grow?
How does population size change through time and space?

37
Growth = births – deaths + immigration – emigration
When calculating growth rate, usually just seeing change in numbers over time
38
Populations grow by multiplication ratherthan by addition
Just like interest in the bank

39
Figure 14.3

40
Exponential growth
-new individuals are added (born) to population continuously
r = per capita growth rate = contribution of each individual in population

41
dN/dt = rN
Rate at which individuals are added = growth
rate on a per individual basis x population size
= derivative of exponential equation
= slope of line
Exponential growth
42
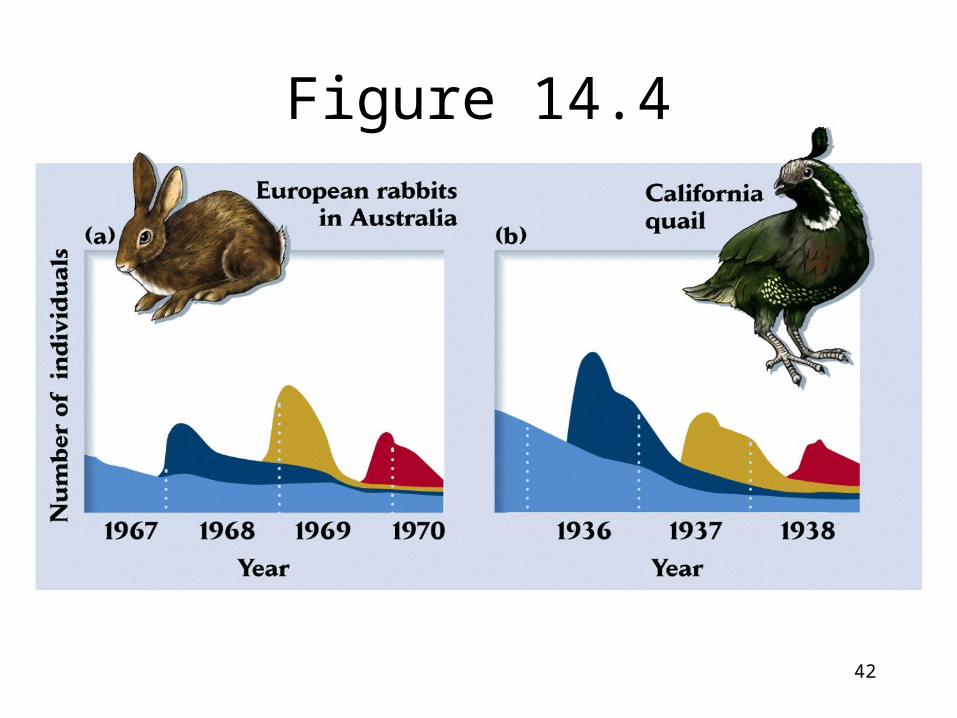
Figure 14.4

43
Exponential vs. Geometric Growth
Exponential – continuous reproduction- growth is smooth curve
Geometric – discrete breeding seasons- calculate growth at discrete
intervals
44
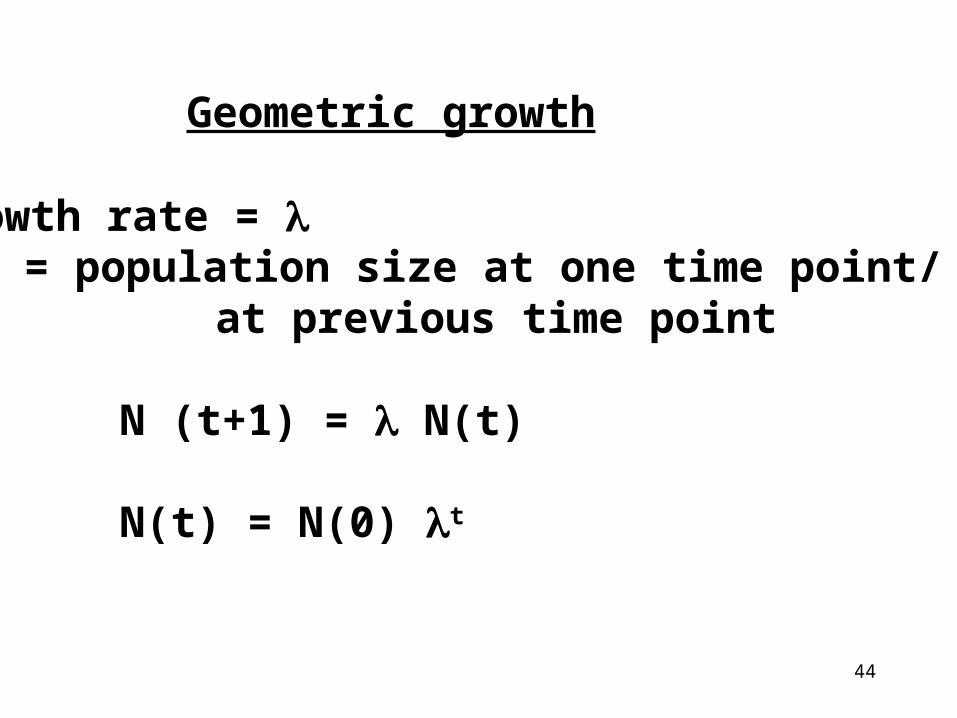
Geometric growth
Growth rate = = population size at one time point/ size
at previous time point
N (t+1) = N(t)
N(t) = N(0) t

45
Geometric growth: N(t) = N(0) t
Exponential growth: N(t) = N(0) ert
= er
Ln = r

46
Figure 14.5
Exponential
Per capita growth rate = constantRate of increase= dN/dt, increases with N

47
Figure 14.6