Embed Size (px)
Citation preview
1
Chapter 6Trade-Off Between Risk &
Return
Chapter 7
Risk, Return, and the CAPM
2
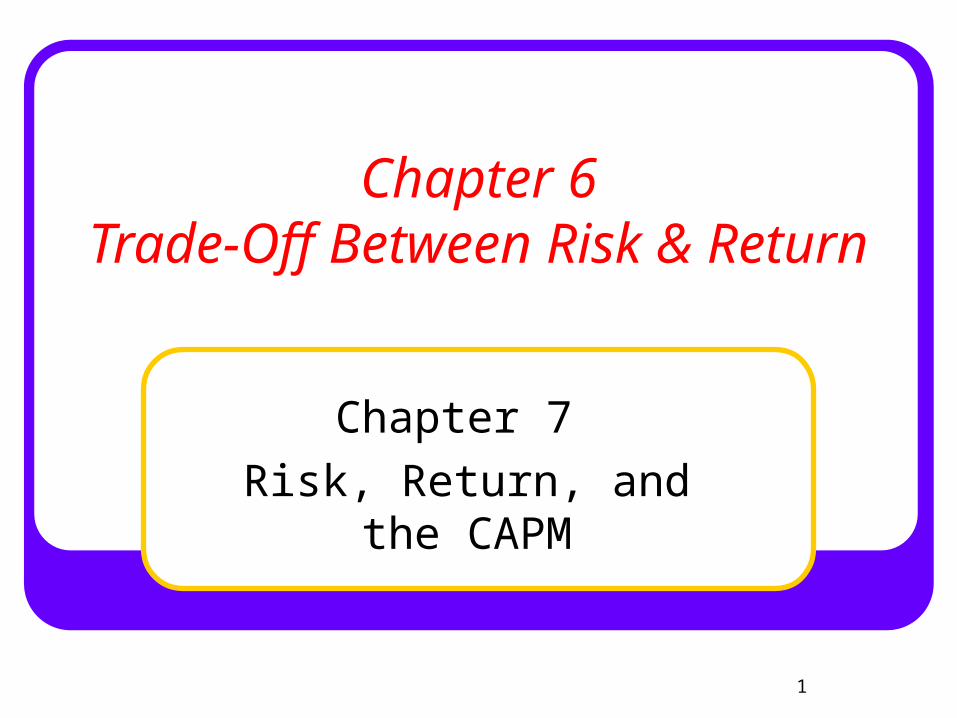
Today’s Chapter 6 & 7 Topics
Historical Trade-Off between Risk and Return
Historical Risk Premiums
Calculation of Historical Return and Risk
Portfolio Return and Risk
Calculation of Probabilistic Expected Return & Risk
Risk Diversification Unsystematic &
Systematic Risk
3
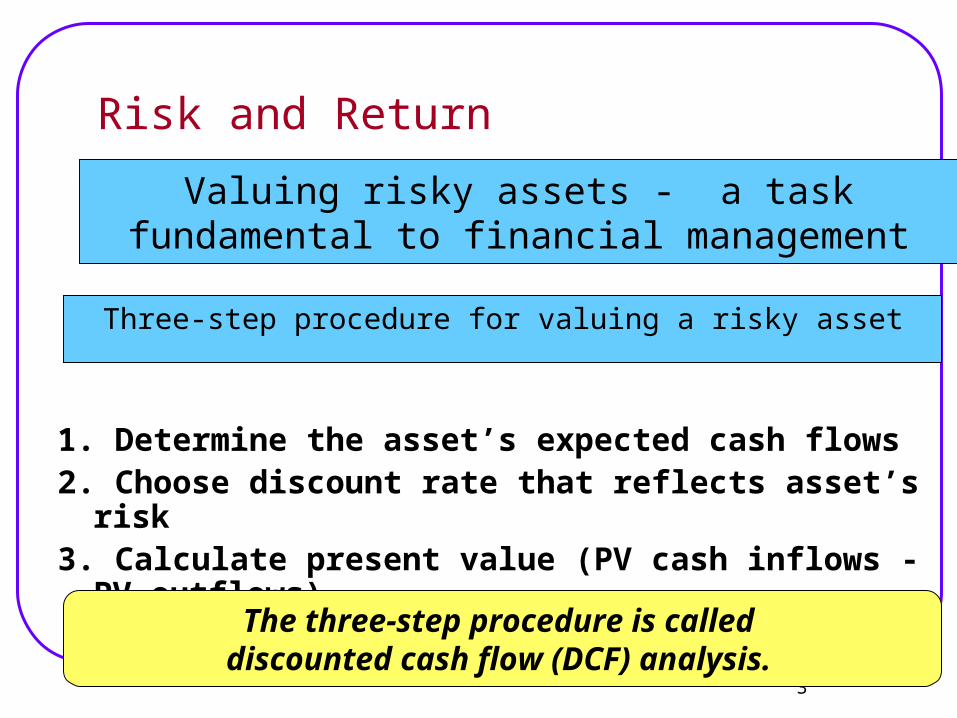
Risk and Return
Valuing risky assets - a task fundamental to financial management
Three-step procedure for valuing a risky asset
1. Determine the asset’s expected cash flows2. Choose discount rate that reflects asset’s risk3. Calculate present value (PV cash inflows - PV
outflows)
The three-step procedure is called discounted cash flow (DCF) analysis.
4
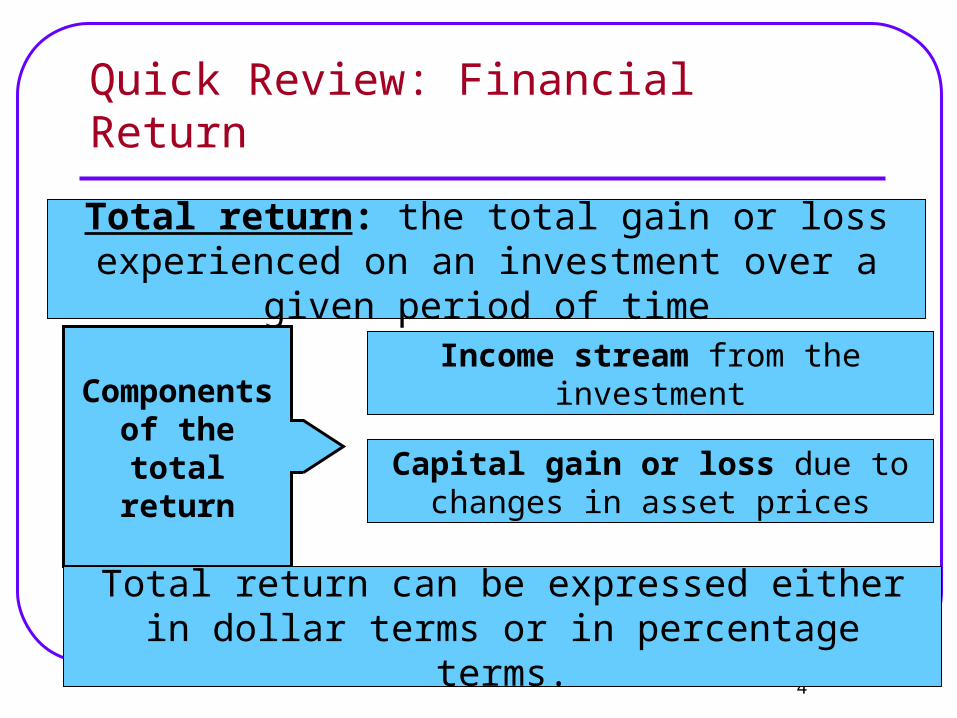
Quick Review: Financial Return
Total return: the total gain or loss experienced on an investment over a given
period of time
Components of the
total return
Income stream from the investment
Capital gain or loss due to changes in asset prices
Total return can be expressed either in dollar terms or in percentage terms.
5
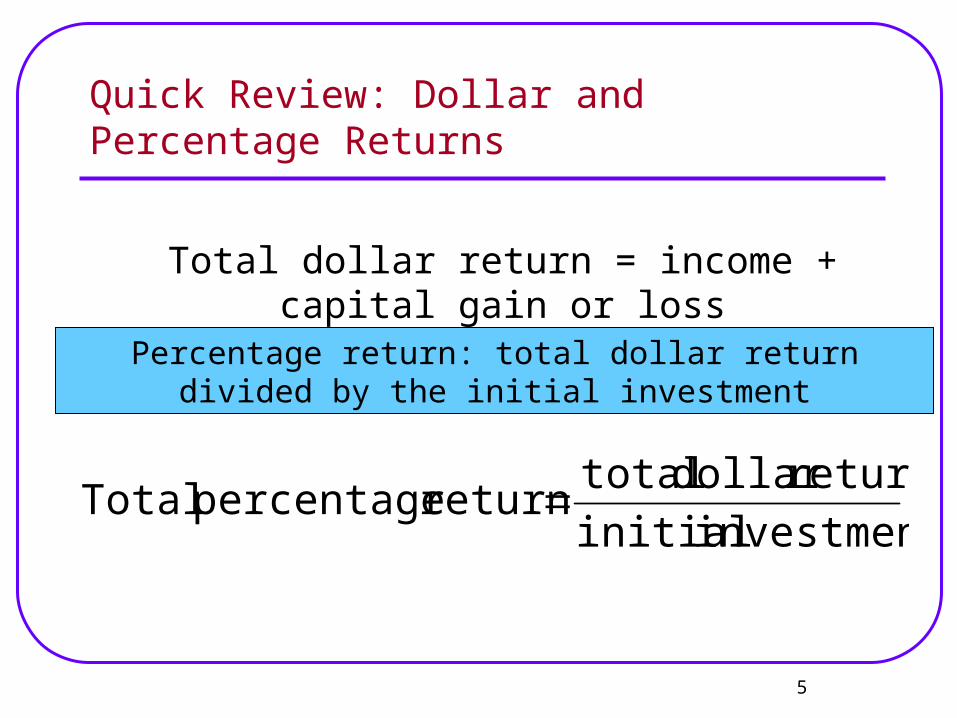
Quick Review: Dollar and Percentage Returns
Total dollar return = income + capital gain or loss
Percentage return: total dollar return divided by the initial investment
investment initialreturndollar total
return percentage Total
6
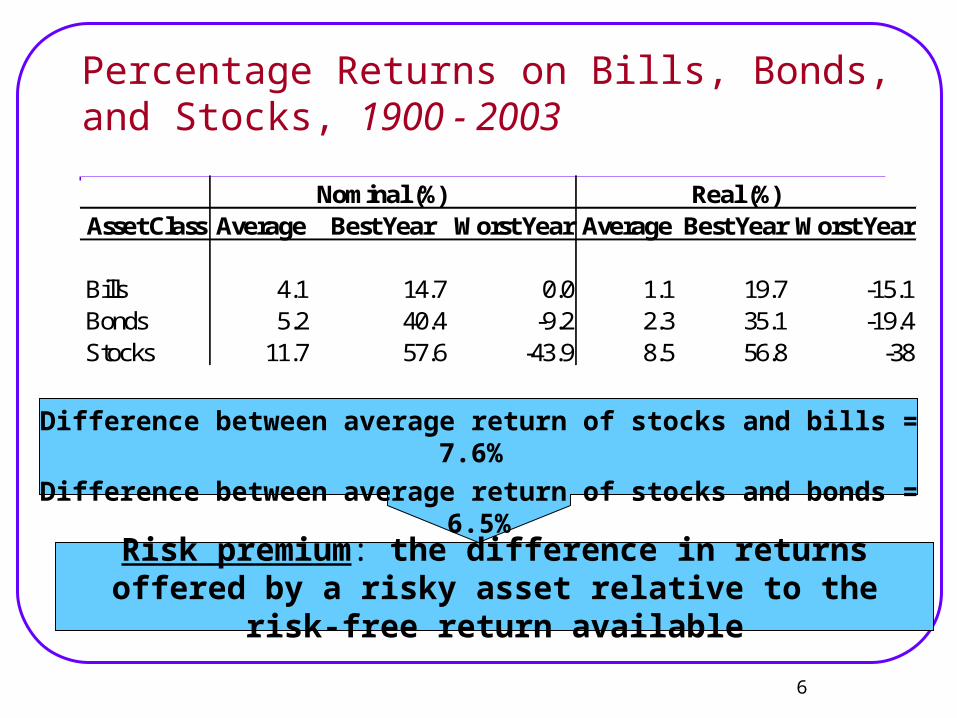
Percentage Returns on Bills, Bonds, and Stocks, 1900 - 2003
Difference between average return of stocks and bills = 7.6%
Difference between average return of stocks and bonds = 6.5%
Risk premium: the difference in returns offered by a risky asset relative to the risk-free return
available
Nominal (%) Real (%)Asset Class Average Best Year Worst Year Average Best Year Worst Year
Bills 4.1 14.7 0.0 1.1 19.7 -15.1Bonds 5.2 40.4 -9.2 2.3 35.1 -19.4Stocks 11.7 57.6 -43.9 8.5 56.8 -38
7
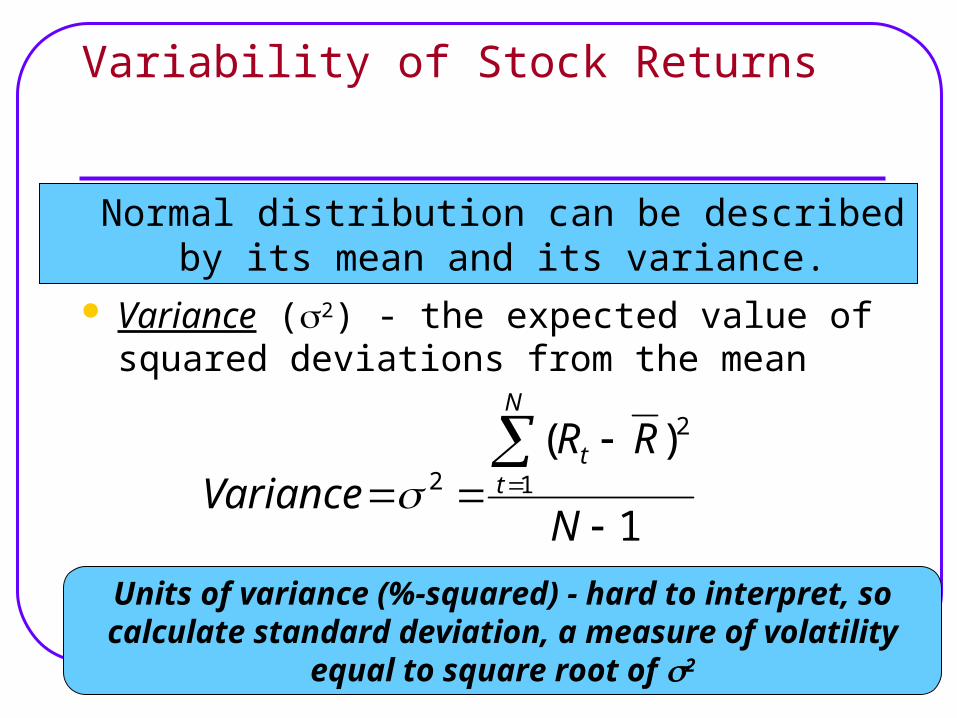
Variability of Stock Returns
Normal distribution can be described by its mean and its variance.
Variance (2) - the expected value of squared deviations from the mean
1
)(1
2
2
N
RRVariance
N
tt
Units of variance (%-squared) - hard to interpret, so calculate standard deviation, a
measure of volatility equal to square root of 2
8
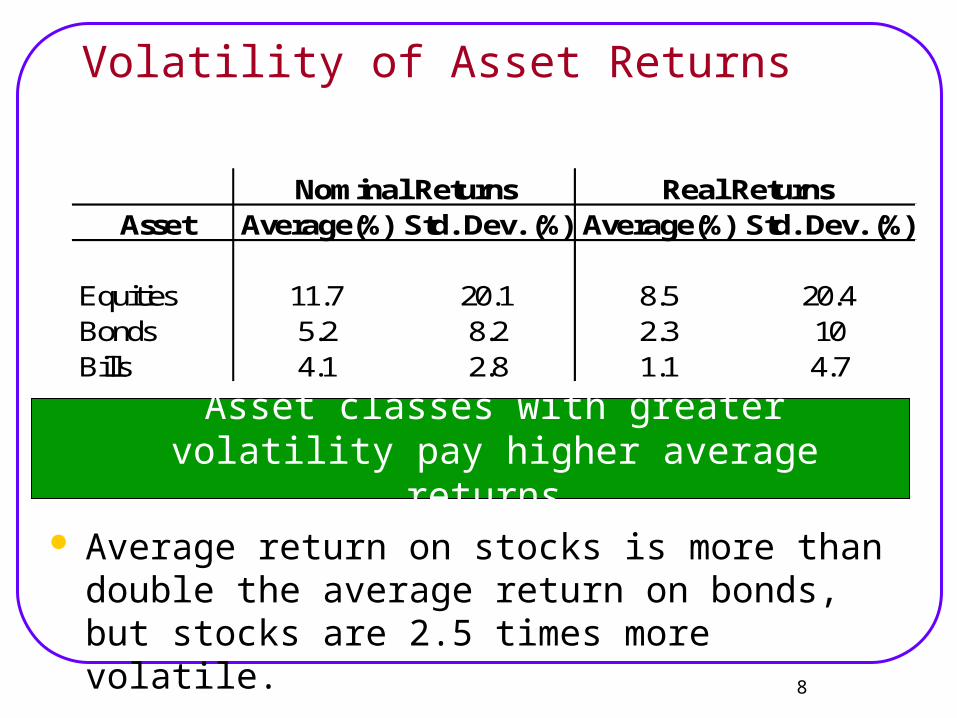
Volatility of Asset Returns
Asset Average(%) Std. Dev. (%) Average(%) Std. Dev. (%)
Equities 11.7 20.1 8.5 20.4Bonds 5.2 8.2 2.3 10Bills 4.1 2.8 1.1 4.7
Nominal Returns Real Returns
Asset classes with greater volatility pay higher average returns.
Average return on stocks is more than double the average return on bonds, but stocks are 2.5 times more volatile.
9
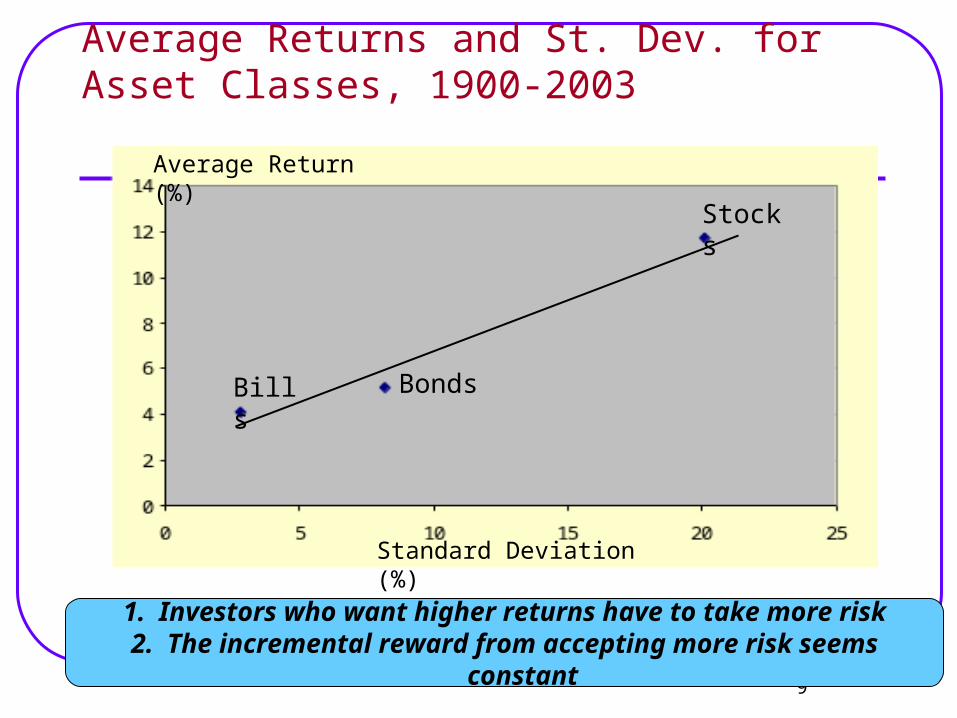
Average Returns and St. Dev. for Asset Classes, 1900-2003
1. Investors who want higher returns have to take more risk
2. The incremental reward from accepting more risk seems constant
Bills Bonds
Stocks
Average Return (%)
Standard Deviation (%)
10
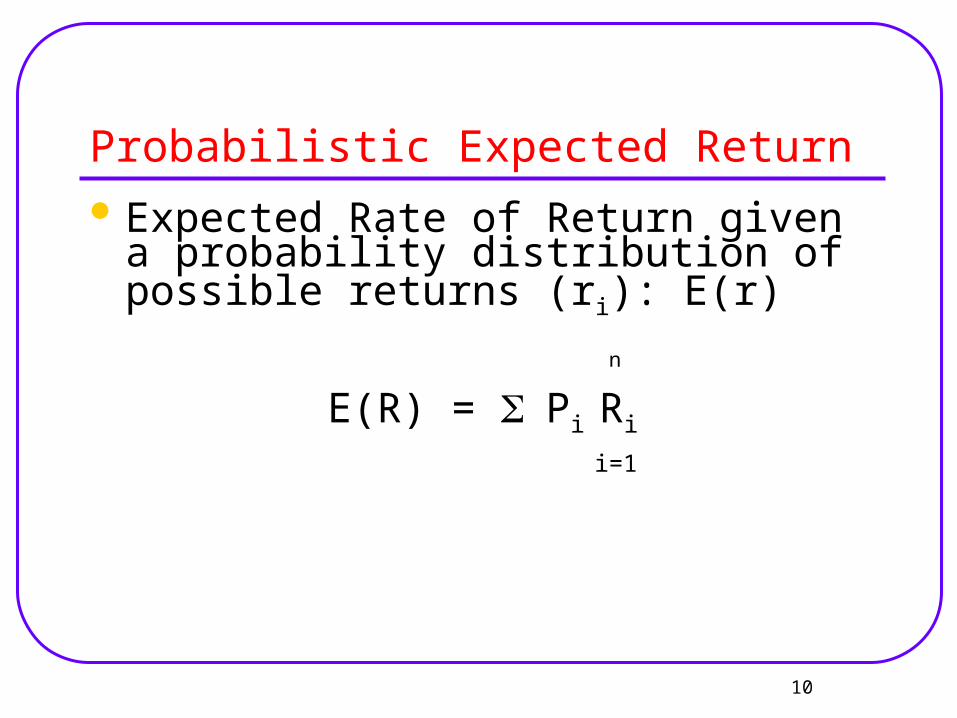
Probabilistic Expected Return Expected Rate of Return given a
probability distribution of possible returns (ri): E(r)
n
E(R) = Pi Ri
i=1
11
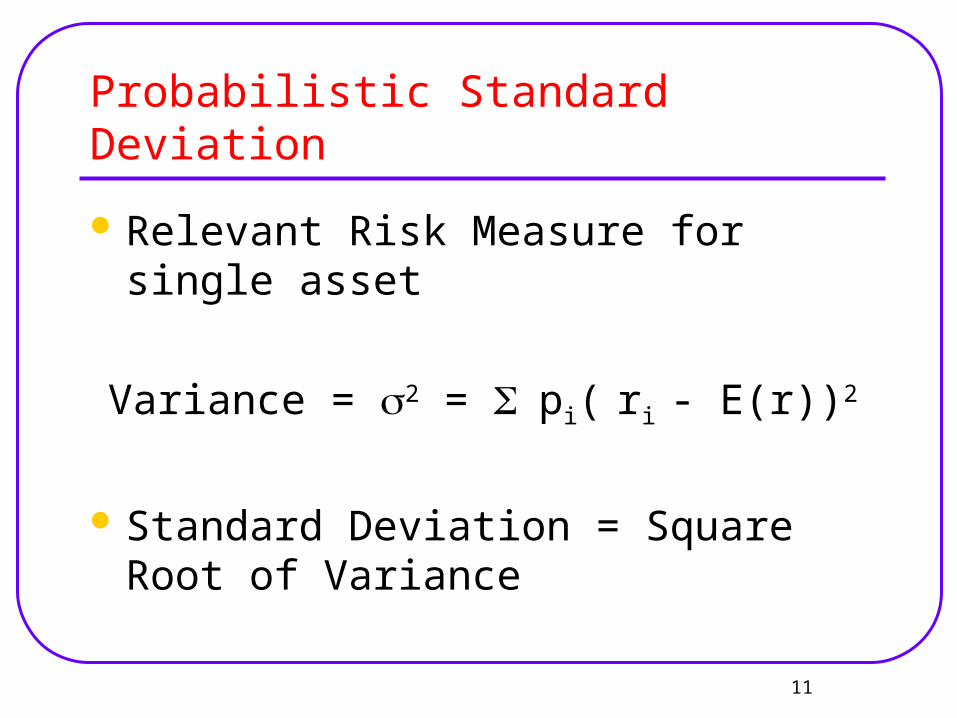
Probabilistic Standard Deviation
Relevant Risk Measure for single asset
Variance = 2 = pi( ri - E(r))2
Standard Deviation = Square Root of Variance
12
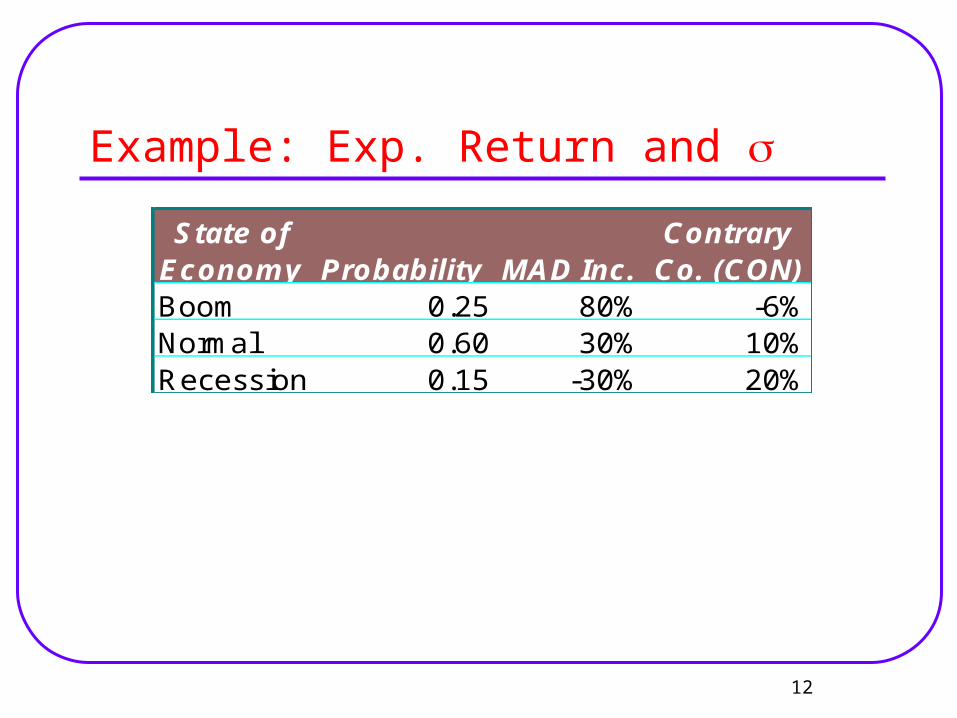
Example: Exp. Return and
State of ContraryEconomy Probability MAD Inc. Co. (CON)Boom 0.25 80% -6%Normal 0.60 30% 10%Recession 0.15 -30% 20%
13
Example: Standard Deviation
14
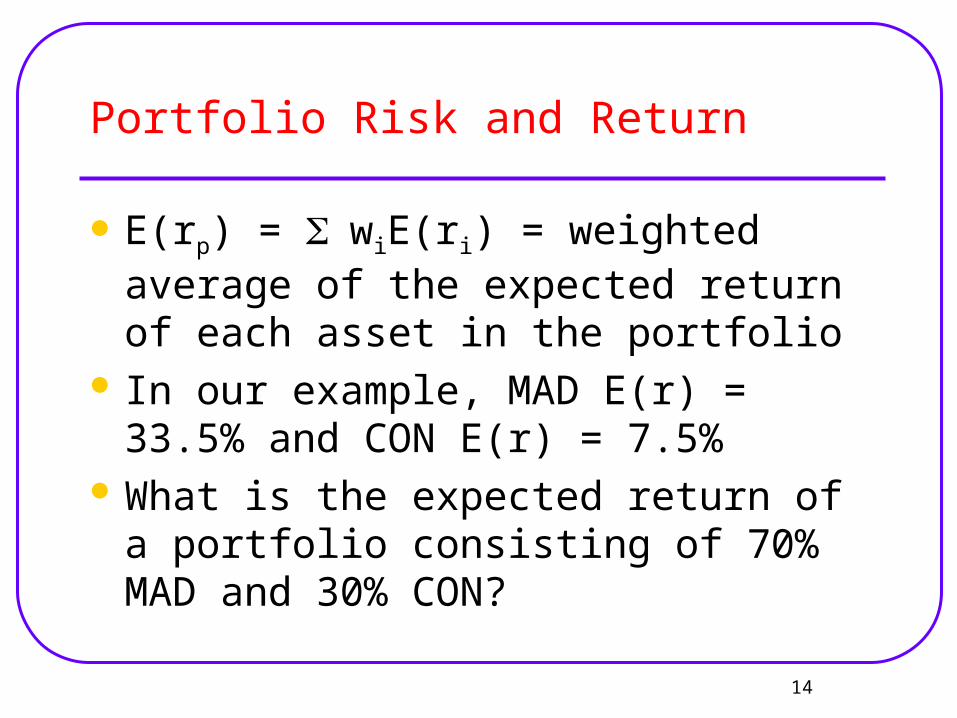
Portfolio Risk and Return
E(rp) = wiE(ri) = weighted average of the expected return of each asset in the portfolio
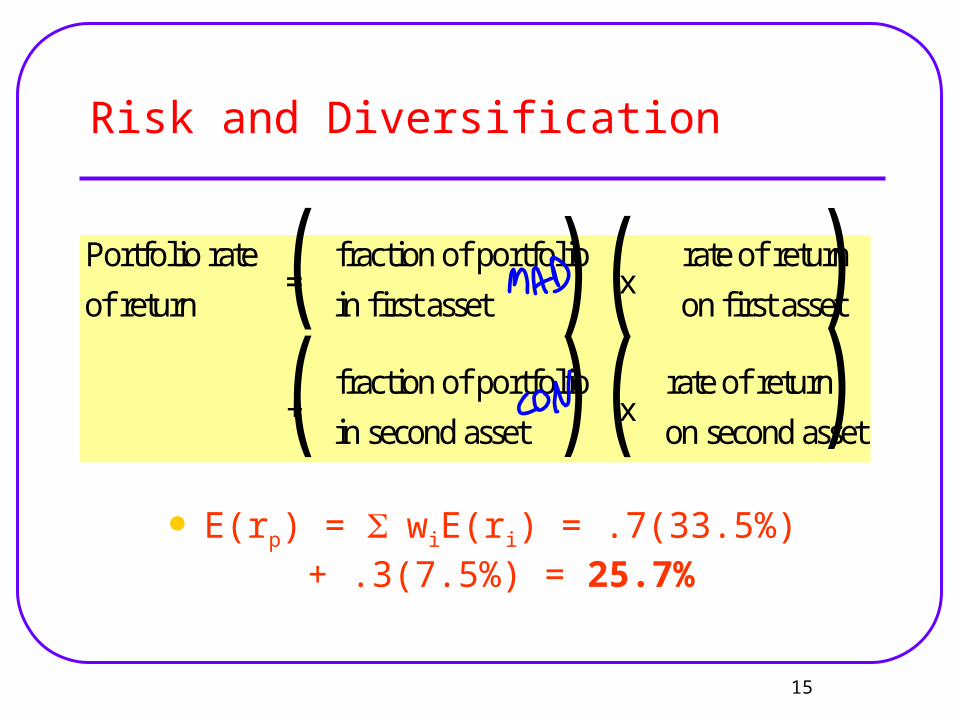
In our example, MAD E(r) = 33.5% and CON E(r) = 7.5%
What is the expected return of a portfolio consisting of 70% MAD and 30% CON?
15
Risk and Diversification
Portfolio rate
of return=
fraction of portfolio
in first assetx
rate of return
on first asset
+fraction of portfolio
in second assetx
rate of return
on second asset
E(rp) = wiE(ri) = .7(33.5%) + .3(7.5%) = 25.7%
((
((
))
))
16
Portfolio Risk
Looking at a 2-asset portfolio for simplicity, the riskiness of a portfolio is determined by the relationship between the returns of each asset over different scenarios or over time.
This relationship is measured by the correlation coefficient( ): -1<= < =+1
Lower = less portfolio risk compared to the weighted average of the standard deviations.
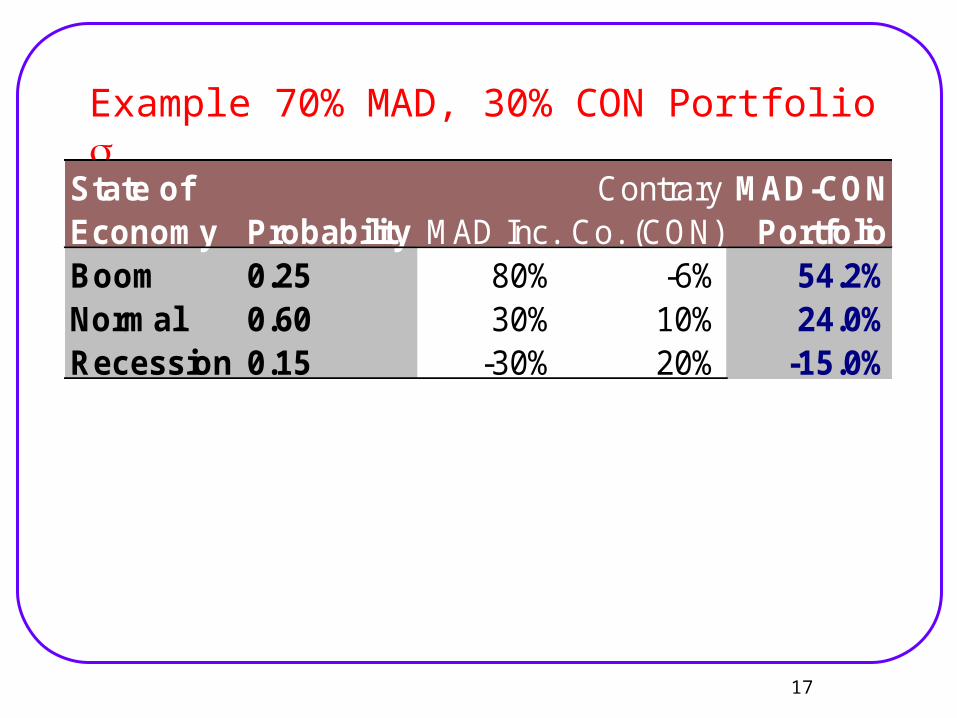
17
Example 70% MAD, 30% CON Portfolio State of Contrary MAD-CONEconomy Probability MAD Inc. Co. (CON) PortfolioBoom 0.25 80% -6% 54.2%Normal 0.60 30% 10% 24.0%Recession 0.15 -30% 20% -15.0%
18
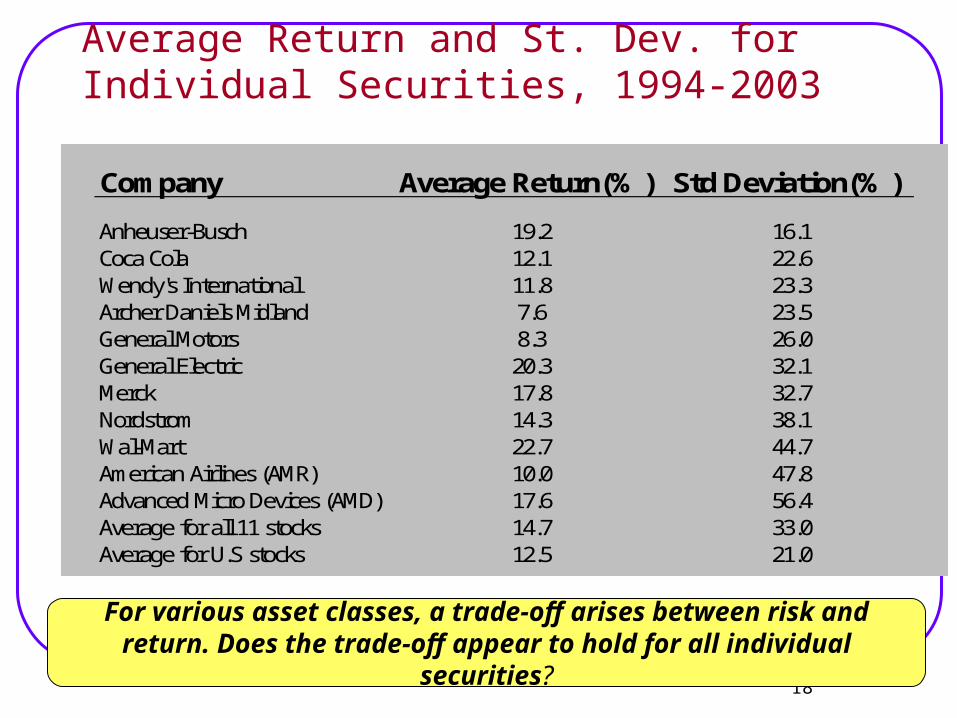
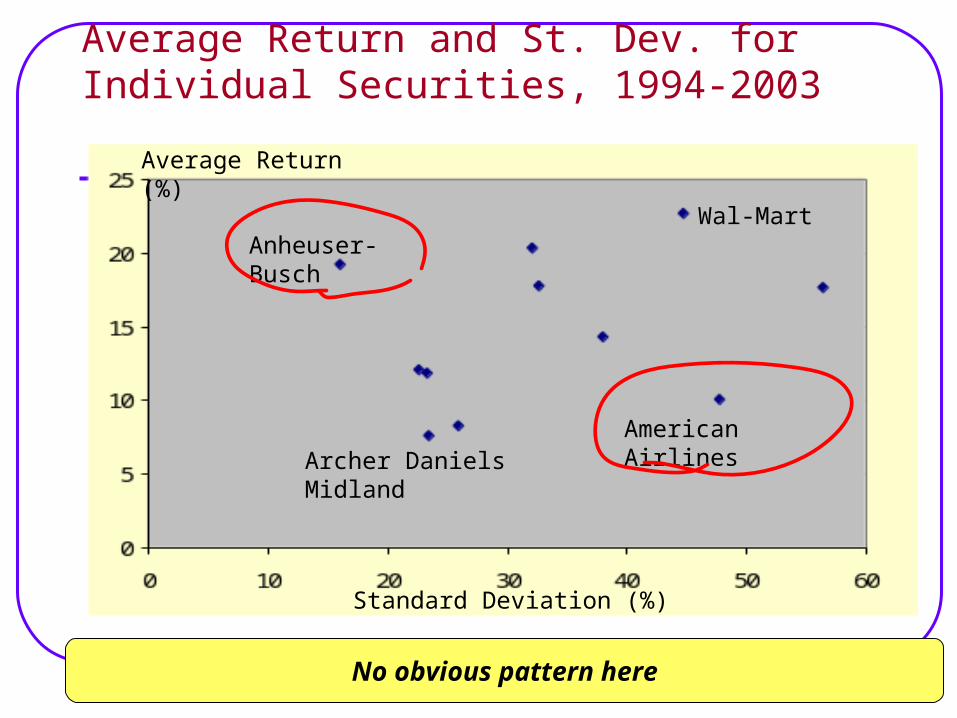
Average Return and St. Dev. for Individual Securities, 1994-2003
For various asset classes, a trade-off arises between risk and return. Does the trade-off appear to hold for all
individual securities?
Company Average Return(%) Std Deviation(%)
Anheuser-Busch 19.2 16.1Coca Cola 12.1 22.6Wendy's International 11.8 23.3Archer Daniels Midland 7.6 23.5General Motors 8.3 26.0General Electric 20.3 32.1Merck 17.8 32.7Nordstrom 14.3 38.1Wal-Mart 22.7 44.7American Airlines (AMR) 10.0 47.8Advanced Micro Devices (AMD) 17.6 56.4Average for all 11 stocks 14.7 33.0Average for U.S stocks 12.5 21.0
19
Average Return and St. Dev. for Individual Securities, 1994-2003
Average Return (%)
Standard Deviation (%)
Wal-MartAnheuser-Busch
Archer Daniels Midland
American Airlines
No obvious pattern here

20
Diversification
Most individual stock prices show higher volatility than the price volatility of portfolio
of all common stocks.
How can the standard deviation for individual stocks be higher than the standard deviation of the portfolio?
Diversification: investing in many different assets reduces the volatility of the portfolio.
The ups and downs of individual stocks partially cancel each other out.
21
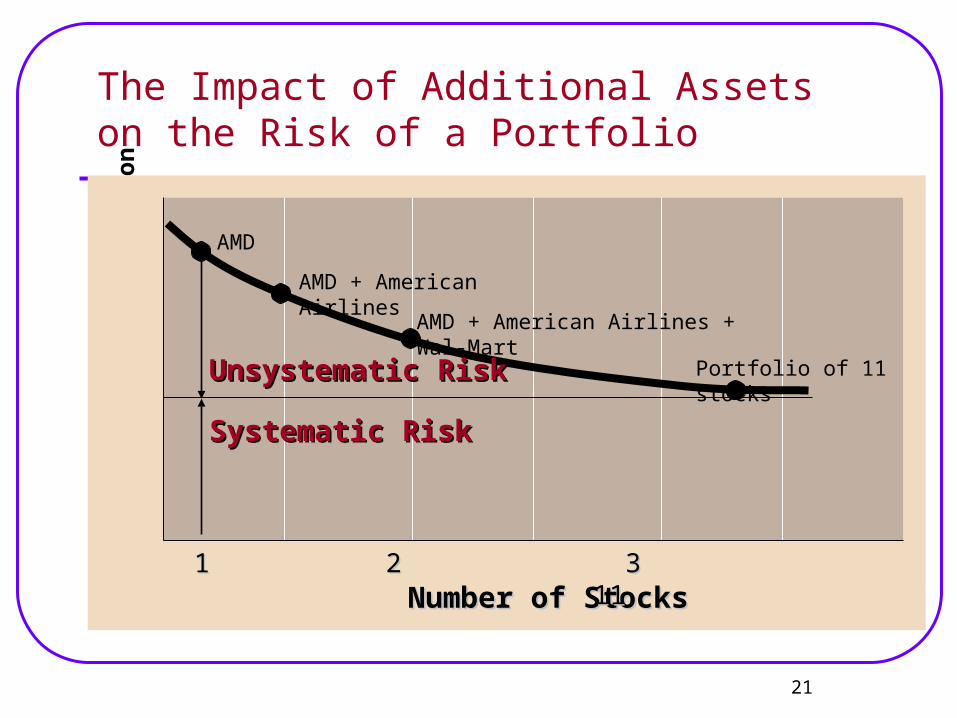
The Impact of Additional Assets on the Risk of a Portfolio
Po
rtfo
lio
Sta
nd
ard
Dev
iati
on
Number of StocksNumber of Stocks
Systematic RiskSystematic Risk
1 2 3 111 2 3 11
Portfolio of 11 stocks
AMD
Unsystematic RiskUnsystematic Risk
AMD + American Airlines
AMD + American Airlines + Wal-Mart
22
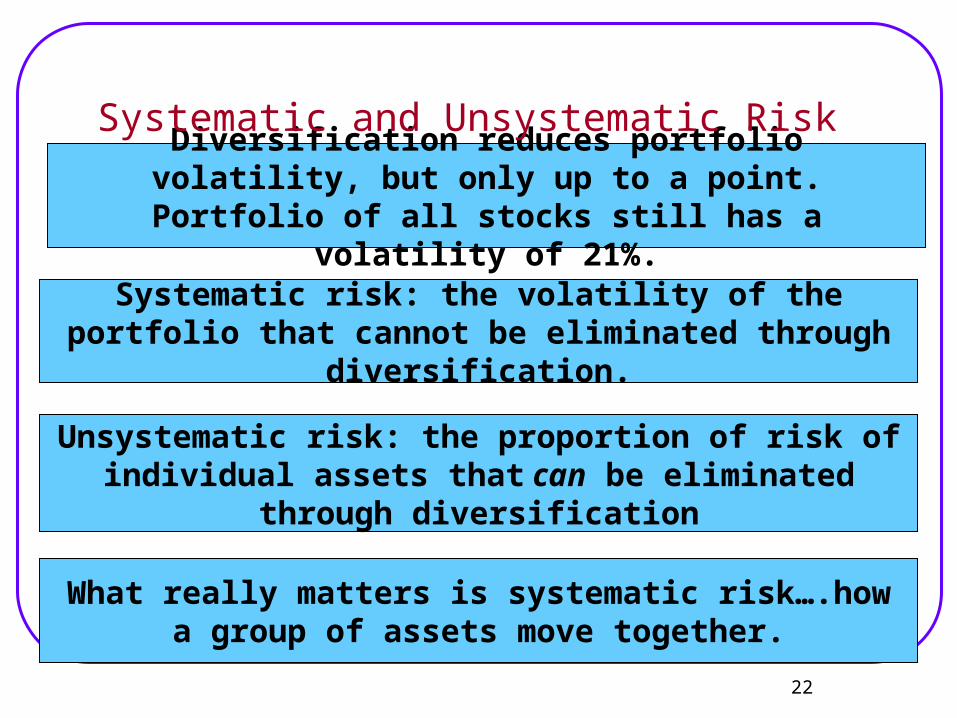
Diversification reduces portfolio volatility, but only up to a point. Portfolio of all stocks still
has a volatility of 21%.
Systematic risk: the volatility of the portfolio that cannot be eliminated through
diversification.
Unsystematic risk: the proportion of risk of individual assets that can be eliminated
through diversification
What really matters is systematic risk….how a group of assets move together.
Systematic and Unsystematic Risk
23
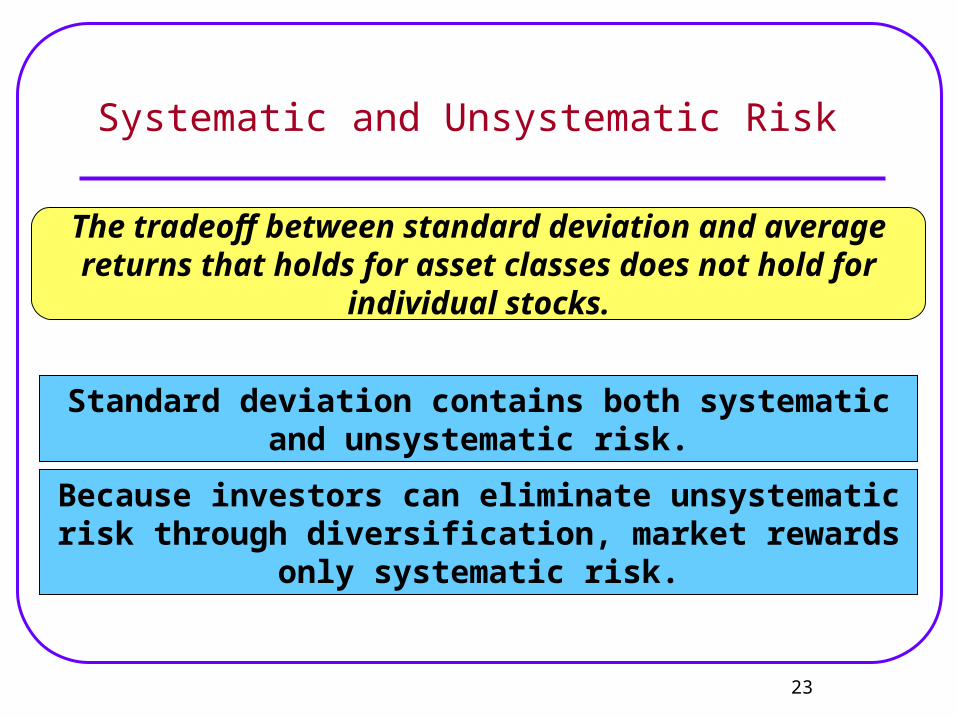
Systematic and Unsystematic Risk
The tradeoff between standard deviation and average returns that holds for asset classes
does not hold for individual stocks.
Because investors can eliminate unsystematic risk through diversification, market rewards
only systematic risk.
Standard deviation contains both systematic and unsystematic risk.