Embed Size (px)
Citation preview
1
Chapter 1
INTRODUCTION
1.1 Introduction: Internet tax-filing
Over recent years, government use of the internet as a platform to provide services to
citizens has grown significantly. One of the major priorities already identified by many
officials in charge of introducing electronic government is tax. Governments around the
world have quickly realized that electronic filing of tax, if properly used, provide a way
to greatly simplify the revenue collection process.
Considerable savings can be derived from propagating internet tax filing system
or e-filing as it is known in Malaysia. Forrester Research (2001),has identified that
savings fall in the following three categories.
(a). Automated data entry yields great savings. Government clerks need not reenter
tax information once entered by taxpayer and sent electronically to the relevant
government database. As a result, the productivity of data entry and checking doubles to
10 tax files a day-reducing labor expenses for data handling personnel by 80 percent.
(b). Fewer errors lighten verification and correction burden. Intelligent data entry and
the elimination of data re-entry, combine to bring the error rate to 5 percent in countries
like Ireland.
(c). Electronic data exchange reduces printing and mailing costs. Tax departments
may spend considerable amount of money to subcontract printing and mailing of tax
forms.

2
Based on Forrester (2001) research, proper use of electronic tax systems could
lead revenue authorities saving up to 70 percent of current cost in collecting taxes.
Internet tax-filing software development; has been adopted by many EU countries in the
last 5 years.
(a) Belgium: In February 2002 Inter VAT service was introduced to allow companies to
declare VAT online.
(b) France : Since July 15, 2001, business in France with annual turnover of Euros 15
million have been mandated by law to file their corporate tax electronically
(c) Ireland: Ireland mandated the e-filing of VAT and contributions since second quarter
2001.
(d) Spain : Over 420,000 individuals now file online in the country and the process is
mandatory for all companies with an annual turnover of more than Euro 6 million.
The annual (Global e-Government Study, 2005) of Brown University in the
United States, ranked the following countries- Taiwan, Singapore, United States, Hong
Kong and China as the top 5 countries in the world with most sophisticated e-
Government websites. Governments have utilized and benefited from information
technology in many ways. Core research to understand and influence citizen’s acceptance
of e-government services such as internet tax-filing or e-filing as it is known in Malaysia
is critical given the investment in such technology and the potential of cost saving for the
government.
3
1.2 e-Filing in Malaysia
In the Asia-Pacific region, Malaysia and Japan were the 2 countries with lowest number
of users making transactions using government online with just 12% and 13%
respectively. Singapore leads the region with 53% although Australia has seen the most
significant increase in online government service usage from 31% to 46%. (The Star,
Nov 12, 2002)
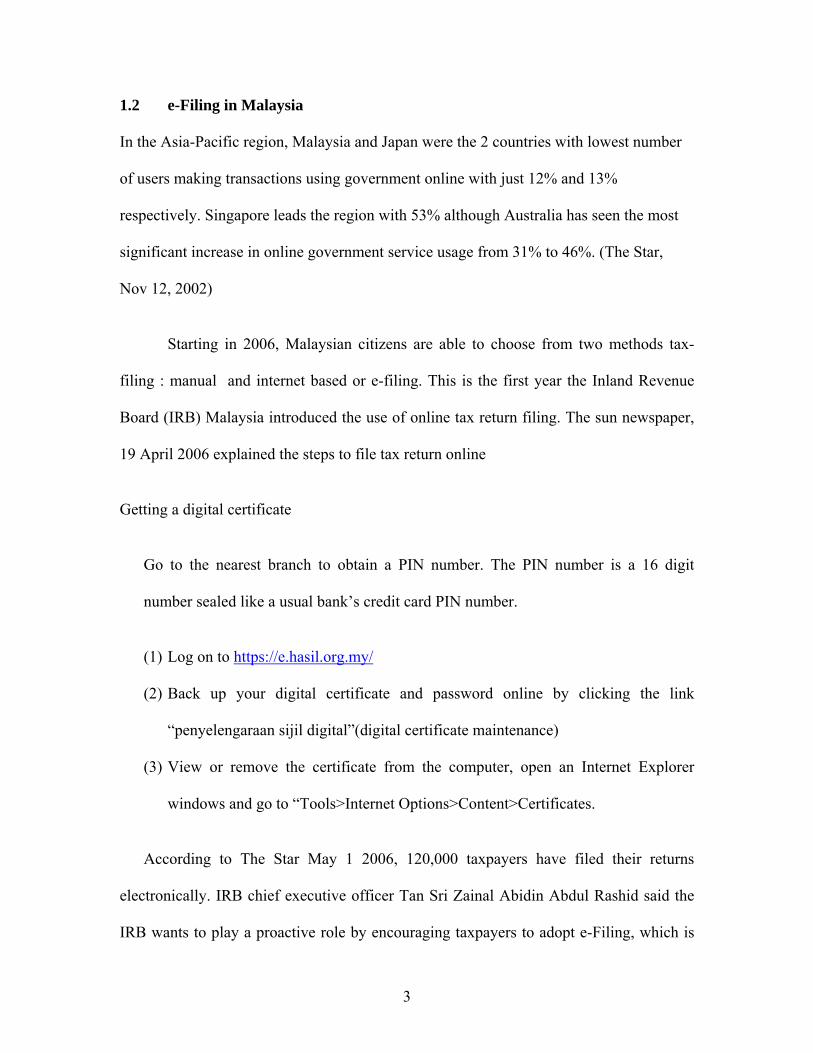
Starting in 2006, Malaysian citizens are able to choose from two methods tax-
filing : manual and internet based or e-filing. This is the first year the Inland Revenue
Board (IRB) Malaysia introduced the use of online tax return filing. The sun newspaper,
19 April 2006 explained the steps to file tax return online
Getting a digital certificate
Go to the nearest branch to obtain a PIN number. The PIN number is a 16 digit
number sealed like a usual bank’s credit card PIN number.
(1) Log on to https://e.hasil.org.my/
(2) Back up your digital certificate and password online by clicking the link
“penyelengaraan sijil digital”(digital certificate maintenance)
(3) View or remove the certificate from the computer, open an Internet Explorer
windows and go to “Tools>Internet Options>Content>Certificates.
According to The Star May 1 2006, 120,000 taxpayers have filed their returns
electronically. IRB chief executive officer Tan Sri Zainal Abidin Abdul Rashid said the
IRB wants to play a proactive role by encouraging taxpayers to adopt e-Filing, which is
4
easier and faster. This is inline with the Government’s Information Technology policy.
He added that the IRB would begin a nationwide campaign at the end of this year to
encourage people to file their tax return electronically.
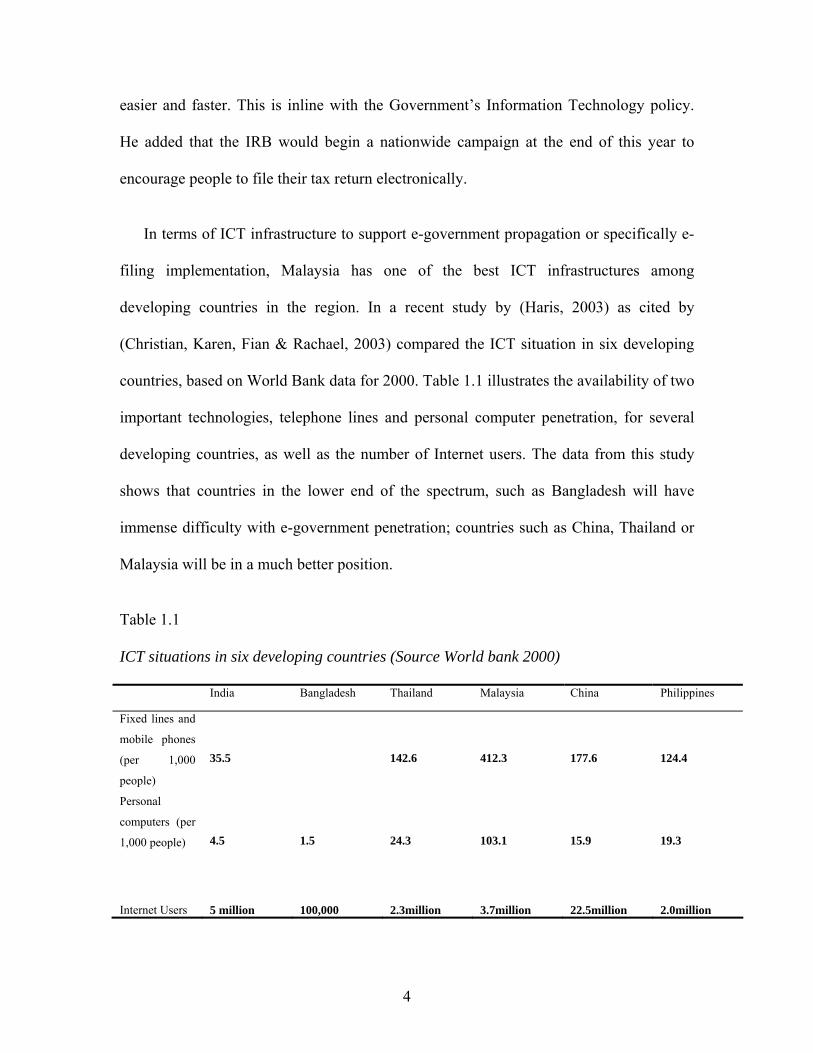
In terms of ICT infrastructure to support e-government propagation or specifically e-
filing implementation, Malaysia has one of the best ICT infrastructures among
developing countries in the region. In a recent study by (Haris, 2003) as cited by
(Christian, Karen, Fian & Rachael, 2003) compared the ICT situation in six developing
countries, based on World Bank data for 2000. Table 1.1 illustrates the availability of two
important technologies, telephone lines and personal computer penetration, for several
developing countries, as well as the number of Internet users. The data from this study
shows that countries in the lower end of the spectrum, such as Bangladesh will have
immense difficulty with e-government penetration; countries such as China, Thailand or
Malaysia will be in a much better position.
Table 1.1
ICT situations in six developing countries (Source World bank 2000)
India Bangladesh Thailand Malaysia China Philippines
Fixed lines and
mobile phones
(per 1,000
people)
35.5
142.6
412.3
177.6
124.4
Personal
computers (per
1,000 people)
4.5
1.5
24.3
103.1
15.9
19.3
Internet Users
5 million
100,000
2.3million
3.7million
22.5million
2.0million
5
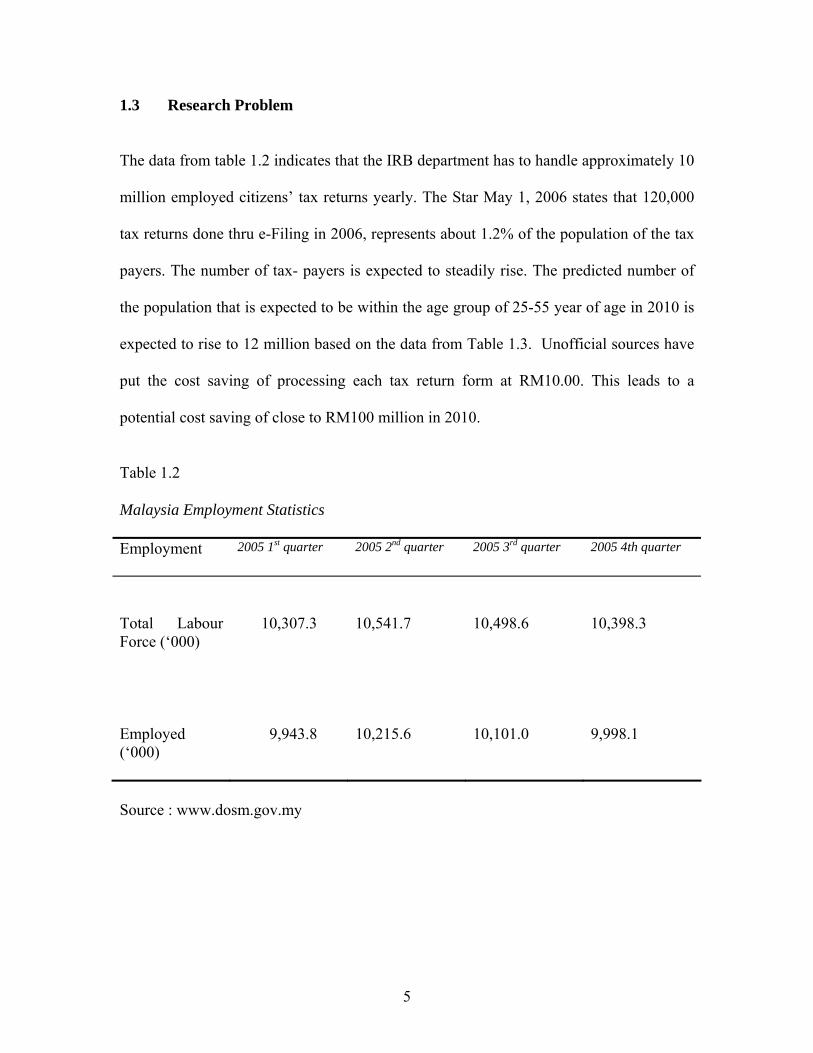
1.3 Research Problem
The data from table 1.2 indicates that the IRB department has to handle approximately 10
million employed citizens’ tax returns yearly. The Star May 1, 2006 states that 120,000
tax returns done thru e-Filing in 2006, represents about 1.2% of the population of the tax
payers. The number of tax- payers is expected to steadily rise. The predicted number of
the population that is expected to be within the age group of 25-55 year of age in 2010 is
expected to rise to 12 million based on the data from Table 1.3. Unofficial sources have
put the cost saving of processing each tax return form at RM10.00. This leads to a
potential cost saving of close to RM100 million in 2010.
Table 1.2
Malaysia Employment Statistics
Employment 2005 1st quarter 2005 2nd quarter 2005 3rd quarter 2005 4th quarter
Total Labour Force (‘000)
10,307.3
10,541.7
10,498.6
10,398.3
Employed (‘000)
9,943.8
10,215.6
10,101.0
9,998.1
Source : www.dosm.gov.my
6
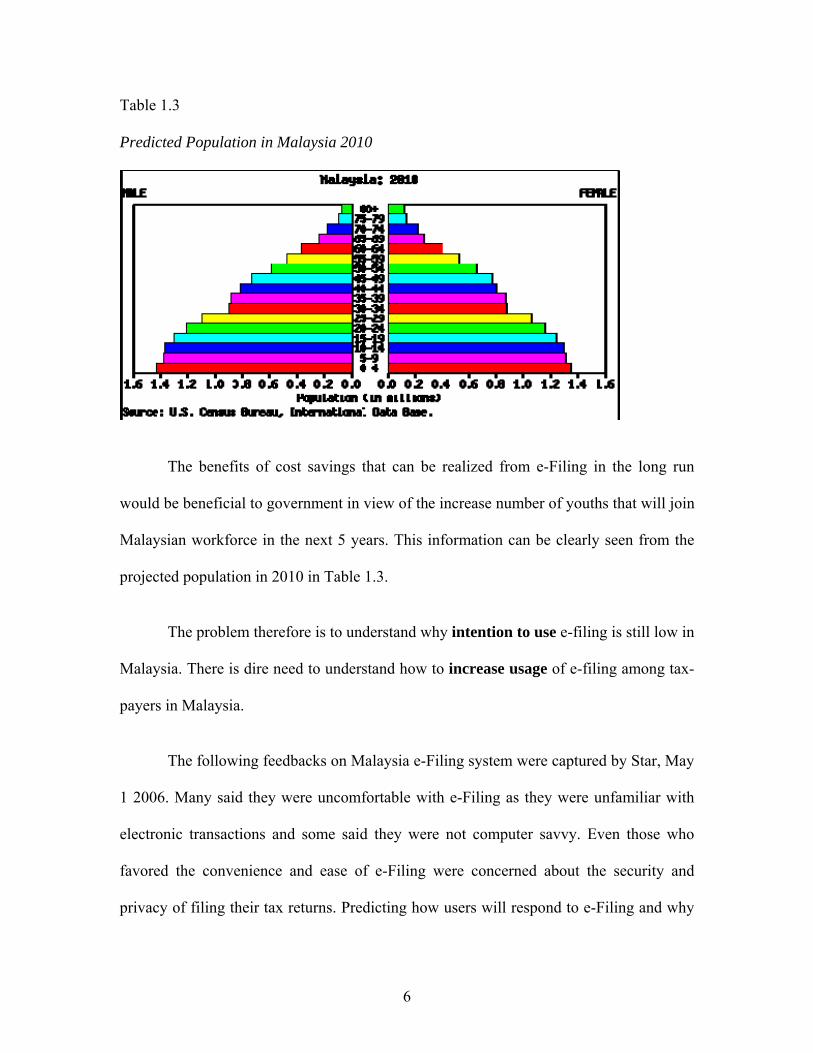
Table 1.3
Predicted Population in Malaysia 2010
The benefits of cost savings that can be realized from e-Filing in the long run
would be beneficial to government in view of the increase number of youths that will join
Malaysian workforce in the next 5 years. This information can be clearly seen from the
projected population in 2010 in Table 1.3.
The problem therefore is to understand why intention to use e-filing is still low in
Malaysia. There is dire need to understand how to increase usage of e-filing among tax-
payers in Malaysia.
The following feedbacks on Malaysia e-Filing system were captured by Star, May
1 2006. Many said they were uncomfortable with e-Filing as they were unfamiliar with
electronic transactions and some said they were not computer savvy. Even those who
favored the convenience and ease of e-Filing were concerned about the security and
privacy of filing their tax returns. Predicting how users will respond to e-Filing and why

7
people resist using computers will help improve the nature of the e-filing system in
Malaysia.
Governments cannot realize any return on their investments in information
systems (IS) like e- Filing, unless the systems are actually used by their intended users.
Despite their sizable cost, IS have been found underutilized or sometimes abandoned
because of the lack of user acceptance (Gillooly, 1998; King, 1994; McCarroll, 1998).
Understanding why individuals accept or reject an IS has proven to be a challenging
issue. The proliferation of e-government worldwide raises the problem of how
governments can increase their citizen’s adoption of e-tax or e-Filing.
e-Filing may be useful but many people may not want to use it because they
perceive it to be complex or not easy to use in the initial stage of introduction. This is the
reason why the present study delves into understanding the determinants of perceived
ease of use. In addition information systems that users perceive easier to use and less
complex will increase the likelihood of its adoption and usage (Teo et al.,1999).
Perceived ease of use is defined as the degree to which a person believes that
using a particular system would be free of effort (Davis, 1989). Incorporating social,
cognitive and psychological constructs into user acceptance and TAM research will help
explain the mechanisms in play in predicting intention to use behavior when using e-
Filing.
The motivating factor that makes the subject of e-filing interesting is the potential
benefit that can be reaped if e-filing is successfully propagated. The government would
have an opportunity to save up to RM100million in cost related processing of tax forms.

8
1.4 Research Objectives
(1) The primary purpose of this research is to understand the determinants of
perceived ease of use among tax payers using e-Filing in Malaysia.
(2) The other research objective is to understand the role of voluntariness as a
moderator of this new method of tax filing.
(3) This study will also seek to understand the role of ease of use on intention.
1.5 Research Questions
In seeking to achieve the above objectives, this study attempts to answer the following
research questions:
(1) What are the key determinants of perceived ease of use?
(2) Does voluntariness moderate the relationship between perceived ease of use and
behavior intention?
(3) Does ease of use influence intention to use.
1.6 Significance of the study
The present study intends to understand the determinants of user acceptance of e-Filing,
using voluntariness as a moderator to the relationship. Understanding the determinants
for Perceived Ease of Use will provide added leverage to enhance acceptance of e-Filing
in the future.
This study will help to give insight on the social, cognitive and physiological
components that will develop an understanding on how to encourage Malaysian tax-
payers to adopt e-Filing in the shortest time. The results from this study can be used by
officials in charge of e-Filing to either improve the system or utilize the information to
find ways to attract new users to utilize e-Filing.

9
In the medical profession, the correct medicine must be administered to cure the
disease. In the same sense, the present study will be significant as it provides a
quantitative analysis to justify what needs to be administered to improve the acceptance
to use e-Filing. Every effort that the government may embark on to educate tax-payers
nationwide will be very costly. There could be various aspects that may be the cause for
lack of acceptance; example lack of training, lack of computers etc. Therefore,
understanding the key factors that increase usage of e-filing among tax payers’ will result
in accurate recommendations for campaigns and provisions by the government.
1.7 Definition of key terms
Computer self-efficacy – individual’s judgement of their capabilities to use computers in
diverse situation (Thatche & Perrewe, 2002)
Computer anxiety – individual’s apprehension, or even fear, when he/she is faced with
the possibility of using computers (Simonson et al., 1987)
Voluntariness – “the degree to which use of innovations is perceived as being voluntary,
or of free will” ( Moore & Benbasat, 1991)
Subjective norm – Individual’s perception of the likelihood that the potential referent
group or individuals approve or disapprove of performing the given behavior (Fishbein &
Ajzen, 1975;Ajzen, 1991)
Perceived risk – Perception of an individual of the adverse effect, consequences and the
uncertainty that may occur by engaging in the particular behavior or activity (Dowling &
Staelin, 1994)
Facilitating conditions – Facilitating conditions (Triandis , 1977) dichotomized as an
external component (Kidwell & Jewel, 2003), refers to the objective conditions in the
10
environment of the individual which makes the behavior easy or difficult to perform
(Triandis,1977).
Personal Innovativeness – defined as the willingness of an individual to try out any new
information. (Agarwal & Prasad, 1998)
Perceived ease of use – defined as the degree to which a person believes that using a
particular system would be free of effort.(Davis, 1989)
Behavioral intention - the extent to which an individual intends to perform a specific
behavior. (Davis et al.,1989).
Voluntariness – extent to which adopters perceive the adoption to be non-mandatory
(Moore & Benbasat, 1991; Venkatesh & Davis, 2000)
1.8 Organization of the Report
This research proposal is organized into five chapters. Chapter 1 gives the background of
the study. The purposes and research objectives have been put forth to guide the direction
of the study. Chapter 2 reviews related literatures by previous researchers. Based on these
literatures the theoretical framework and hypotheses are developed. Chapter 3 discusses
the research methodology used in this research. Chapter 4 presents the result of the
statistical analysis. Chapter 5 summarizes research findings, implications of the findings
and limitation of the study. The concluding chapter also provides some suggestions for
further studies.
11
Chapter 2
LITERATURE REVIEW
2.1 Introduction This chapter focuses on discussing the theories, the expansion of the theories to the
present theoretical framework used in this research and the justification for the present
model.
2.2 Overview of the literature
Various literatures from scholars in Malaysia and abroad were reviewed on the subject of
Technology Acceptance among users and PEU in particular. One of the observations in
reviewing the literature is that a large number of work studying user acceptance or
behavior intention in using IS was based on convenience sampling (students). Samples
size of the population was represented by the students of the university. This method of
sampling would be convenient; however difference in explanatory power between
laboratory experiments and field study would be a potential setback. Sun and Zhang
(2004) and Gopi (2006) has reviewed past literature in detail and found that studies using
laboratory experiments have relatively higher explanatory power than field studies. One
suggested reason is the relatively uncontrolled environment of the field setting (Lucas &
Spitler, 1999). Sun and Zhang (2004) made an assumption that employees face more
complex and differing factors in real contexts than students do, the difference also calls
for additional factors that may explain more variance in user acceptance. The present
study is a field study and therefore extra care was taken to review literatures and adopting
constructs from past literatures that was also conducted the study in a field setting.
12
This study serves to understand the determinants of perceived ease of use and
eventually to relate this information to suggest better methods to encourage acceptance of
e-Filing based on the findings. Older literatures on user acceptance were reviewed to
understand the scholarly thinking and models that were developed to study user
acceptance. The more recent literatures were reviewed a basis to construct the theoretical
model and to understand recent research findings on perceived ease of use.
2.3 Technology Acceptance Model
The basic theory that forms the basis of the research is the Technology acceptance model
developed by (Davis,1989). In order to be able to explain user acceptance and use, it is
important to understand the antecedents of the key TAM constructs, perceive ease of use
and usefulness. Technology Acceptance Model (TAM) is tailored for IS contexts, and
was designed to predict information technology acceptance and usage on the job
(Venkatesh, Morris, Davis & Davis, 2003). TAM, introduced by (Davis, 1986) specifies
two particular beliefs- perceived usefulness and perceived ease of us. Perceived
Usefulness (PU) is defined by (Davis, 1989) as the degree to which a person believes that
using a particular technology will enhance his performance. Perceived Ease of Use
(PEU) is defined by (Davis, 1989) as the degree to which a person believes that using a
particular system would be free of effort. Behavioral intention (BI) is defined as the
extent to which an individual intends to perform a specific behavior. (Davis et al.,1989).
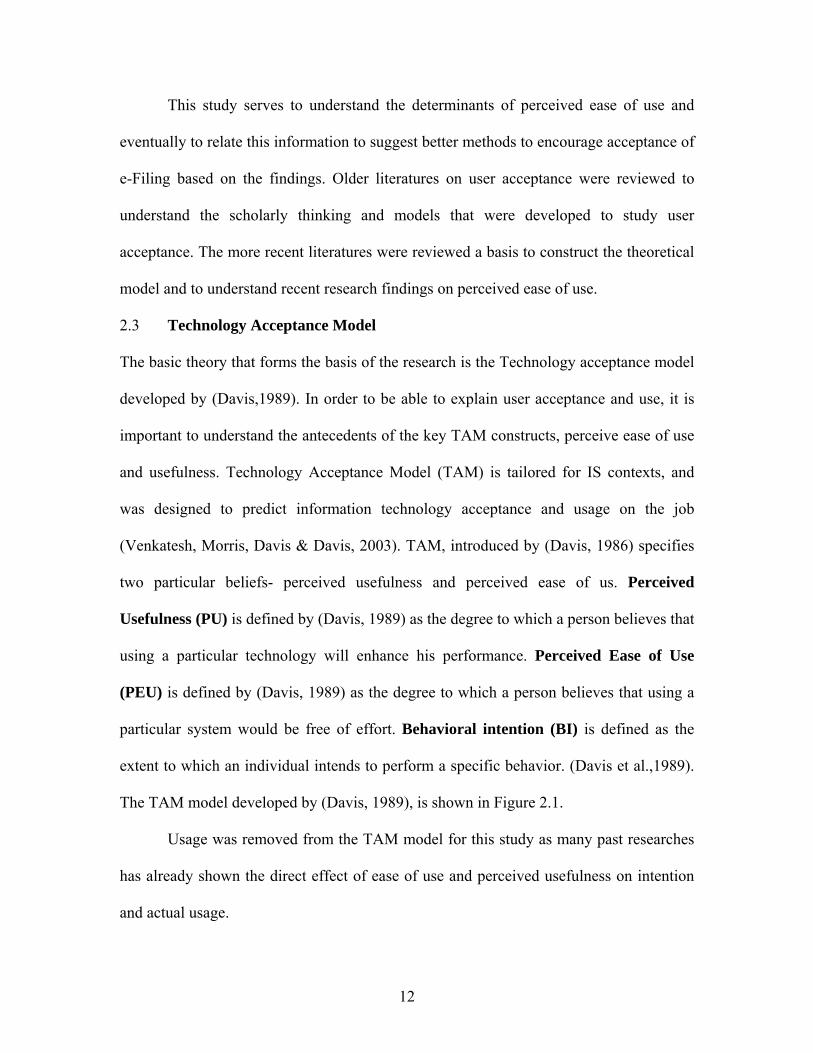
The TAM model developed by (Davis, 1989), is shown in Figure 2.1.
Usage was removed from the TAM model for this study as many past researches
has already shown the direct effect of ease of use and perceived usefulness on intention
and actual usage.
13
Figure 2.1 Technology Acceptance Model Source: Davis et al., 1989
Some of the literatures that has already proven direct effect of intention and
usage includes (Chau & Hu, 2001; Chen et al., 2002; Moon & Kim, 2001; Mathieson et
al. 2001; Venkatesh et al., 2003; Ramayah & Tham, 2005; Gopi, 2006).Their findings
showed clear repeated direct relationship between intention and usage. This further
justifies why usage can be omitted from the TAM model for this study. Attitude was also
removed from the TAM model to understand the influence of PEU on behavior intention.
Attitude was removed from the TAM model after Venkatesh (2003) found that attitude
did not mediate the relationship between PEU, PU and BI.
The Technology Acceptance Model (TAM), introduced by (Davis, 1989), is an
adaptation of Theory of Reasoned Action (TRA) especially for modeling user acceptance
of information systems. Fishbein & Ajzen’s (1975) Theory of Reasoned Action is an
especially widely validated intention model that has been proven successful in predicting
and explaining behavior across a wide variety of domains. TAM adapted the TRA
External variable
Perceived Usefulness
Perceived Ease of
Attitude Toward Using
Behavioral Intention to Use
Actual System Use

14
model’s belief-attitude-intention-behavior relationship to model user acceptance of IT.
(Ramayah, 2006)
The parsimony of TAM combined with its predictive power makes it easy to
apply to different situations. However, while parsimony is TAM’s strength, it is also the
model’s key limitation. TAM is predictive but its generality does not provide sufficient
understanding from the standpoint of providing system designers with information
necessary to create user acceptance for new systems (Mathieson,1991).
Ramayah (2006a) and (Venkatesh, 2000) have added depth to TAM model by
understanding the determinants of perceived ease of use in their study. The study by
(Venkatesh, 2000) explained up to 60% of the variance in system specific perceived ease
of use. The study by (Ramayah, 2006a) on determinants of perceived ease of use of e-
Library also explained up 65% of the total variance. These studies have some of the
highest explanatory power among TAM research conducted in recent years. Table 2.1
below looks at the past work of researchers in Malaysia and abroad in understanding
perceived ease of use in various contexts and scope of research. These literatures also
study the relationship between perceived ease of use and behavior intention.
15
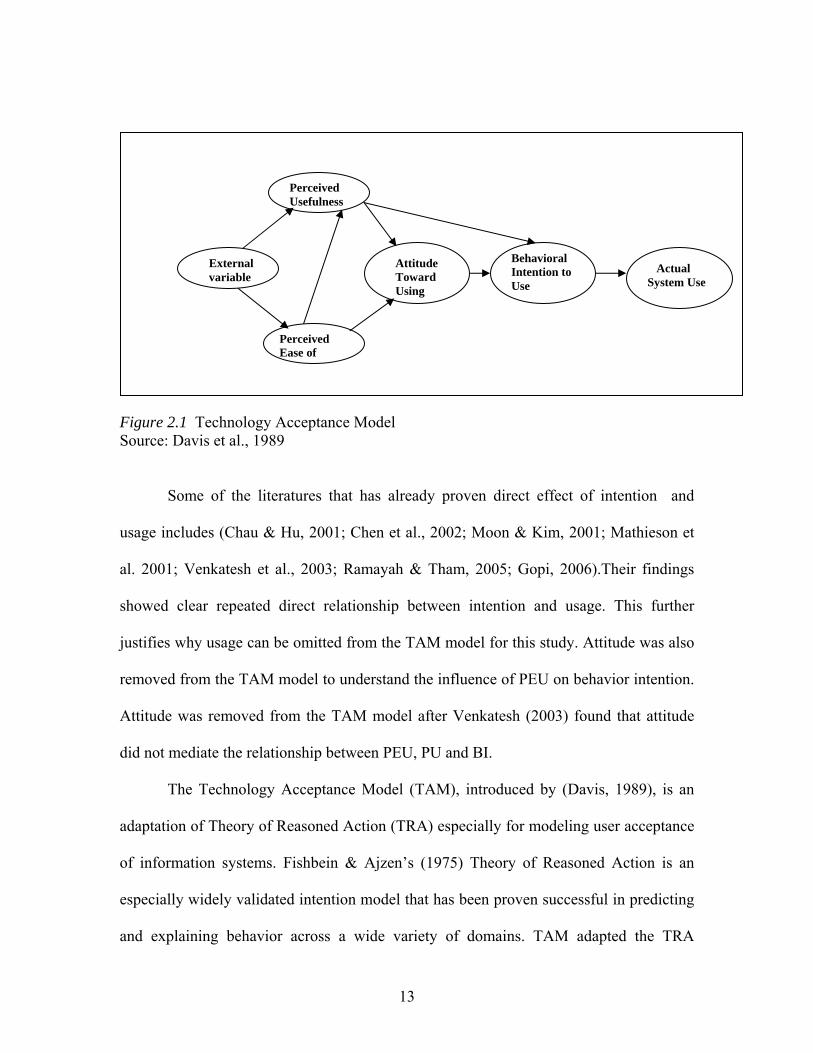
Table 2.1
Summary of literatures on Perceived Ease of Use Author(s) Research
setting Study sample(s)
Instruments /model
Key Findings on PEU
Fu, Farn and Chao (2006) Ramayah (2006a) Ndubisi, Gupta & Ndubisi (2005)
Taiwan Malaysia Malaysia
Individuals Students Malaysian entrepreneur
TAM TAM TAM
Existing e-Tax payer may not consider PEU or SN of particular importance. A manual tax payers’ decision to adopt e-tax method is influenced by PEU and social pressures. For manual tax payers, the effect of PEU, SN, SE on BI were significant. PU was the strongest determinant and explained most of the variance in BI. This study on the subject of ease of use of USMs’ digital library showed that interactive characteristic ranked the highest in the order of influence on ease of use, followed by organizational context and individual differences. Total variance explained was 64.8% Perceived ease of use has no direct relationship with usage .It only has an indirect relationship via perceived usefulness. Innovativeness moderates the relationship between ease of use and usefulness; perseverance and flexibility moderate the impact of perceived usefulness on usage. Perceived usefulness has a strong influence on entrepreneurs’ system usage.
16
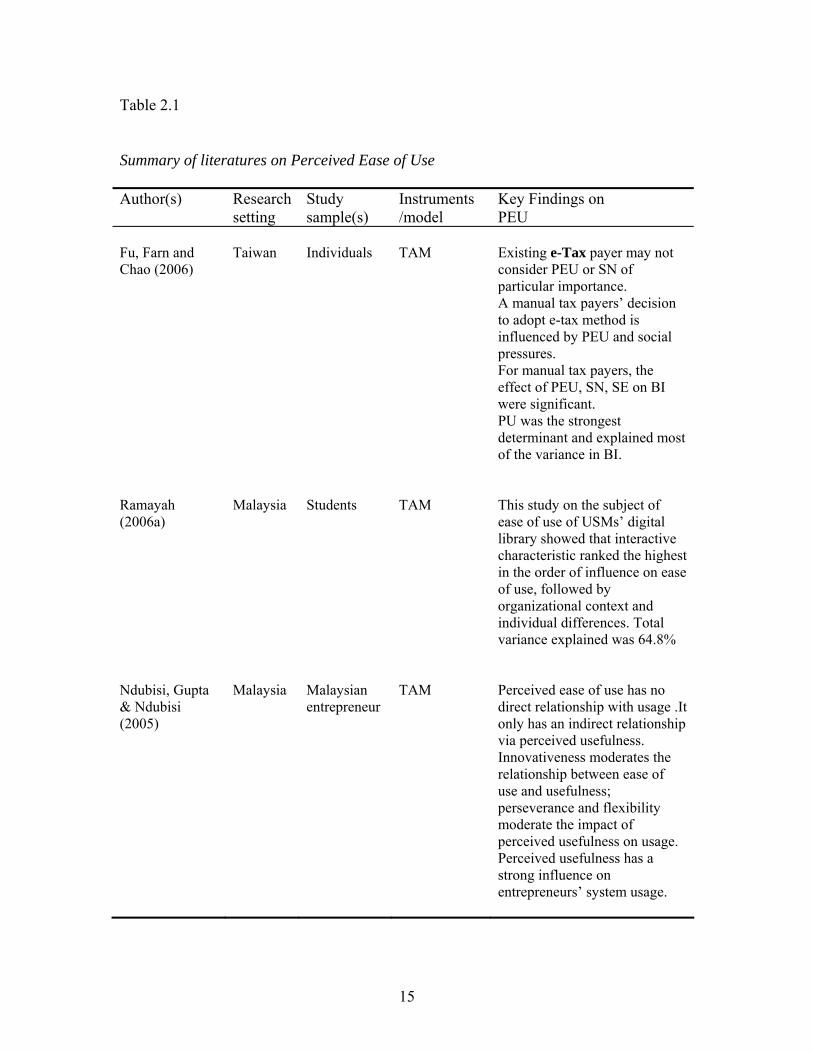
Table 2.1 (Continued)
Author(s) Research setting
Study sample(s)
Instruments /model
Key Findings on PEU
Venkatesh (2000) Ramayah (2006b)
USA Malaysia
Employees of three organization Students
TAM TAM
Determinants of system-specific perceived ease of use as individuals evolve from early stages of experience to later stages of experience.T1-initial after training T2- one month after training, T3 three month after training. Usage context of system was voluntary. Internal and external control, FCON, CEFF, Motivation, CANX serve as anchors that users employ in forming PEU of new system. With experience general beliefs regarding computer, perceived enjoyment and objective usability were important in perceiving ease of use of a system. Perceived ease of use influence behavior intention. Interface characteristic were found to be strong predictors of perceived ease of use. Terminology clarity was found to be the most influential factor. Screen design found to be significant predictor to perceived ease of use. Navigational clarity was only weakly correlated to perceived ease of use. PEU was also found to be positively related to intention to use the online.
17
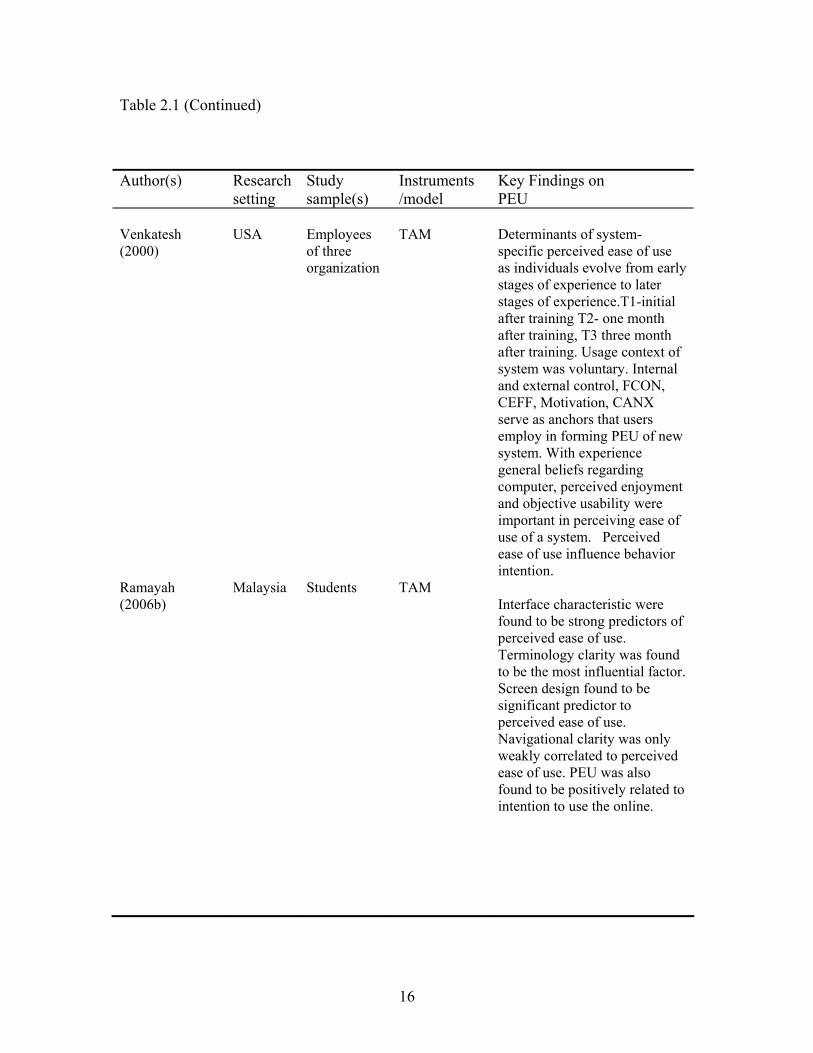
Table 2.1 (Continued)
Author(s) Research setting
Study sample(s)
Instruments /model
Key Findings on PEU
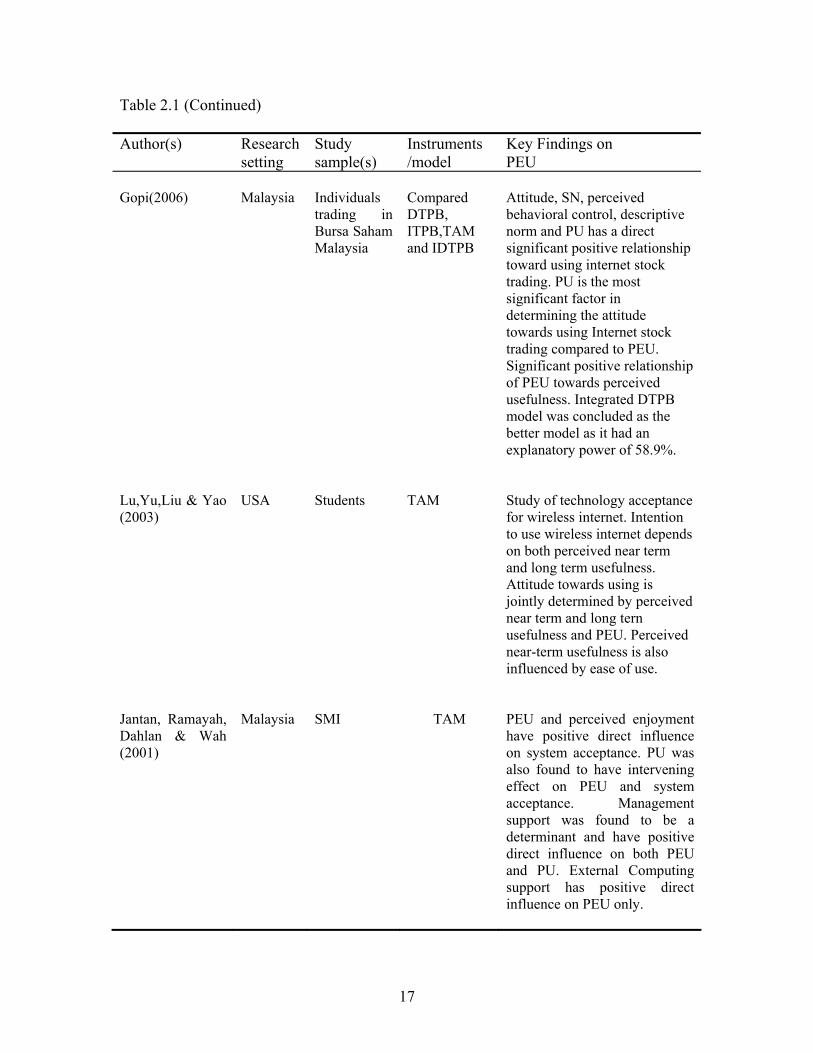
Gopi(2006) Lu,Yu,Liu & Yao (2003) Jantan, Ramayah, Dahlan & Wah (2001)
Malaysia USA Malaysia
Individuals trading in Bursa Saham Malaysia Students SMI
Compared DTPB, ITPB,TAM and IDTPB
TAM
TAM
Attitude, SN, perceived behavioral control, descriptive norm and PU has a direct significant positive relationship toward using internet stock trading. PU is the most significant factor in determining the attitude towards using Internet stock trading compared to PEU. Significant positive relationship of PEU towards perceived usefulness. Integrated DTPB model was concluded as the better model as it had an explanatory power of 58.9%. Study of technology acceptance for wireless internet. Intention to use wireless internet depends on both perceived near term and long term usefulness. Attitude towards using is jointly determined by perceived near term and long tern usefulness and PEU. Perceived near-term usefulness is also influenced by ease of use. PEU and perceived enjoyment have positive direct influence on system acceptance. PU was also found to have intervening effect on PEU and system acceptance. Management support was found to be a determinant and have positive direct influence on both PEU and PU. External Computing support has positive direct influence on PEU only.
18
Table 2.1 (Continued)
Author(s) Research setting
Study sample(s)
Instruments /model
Key Findings on PEU
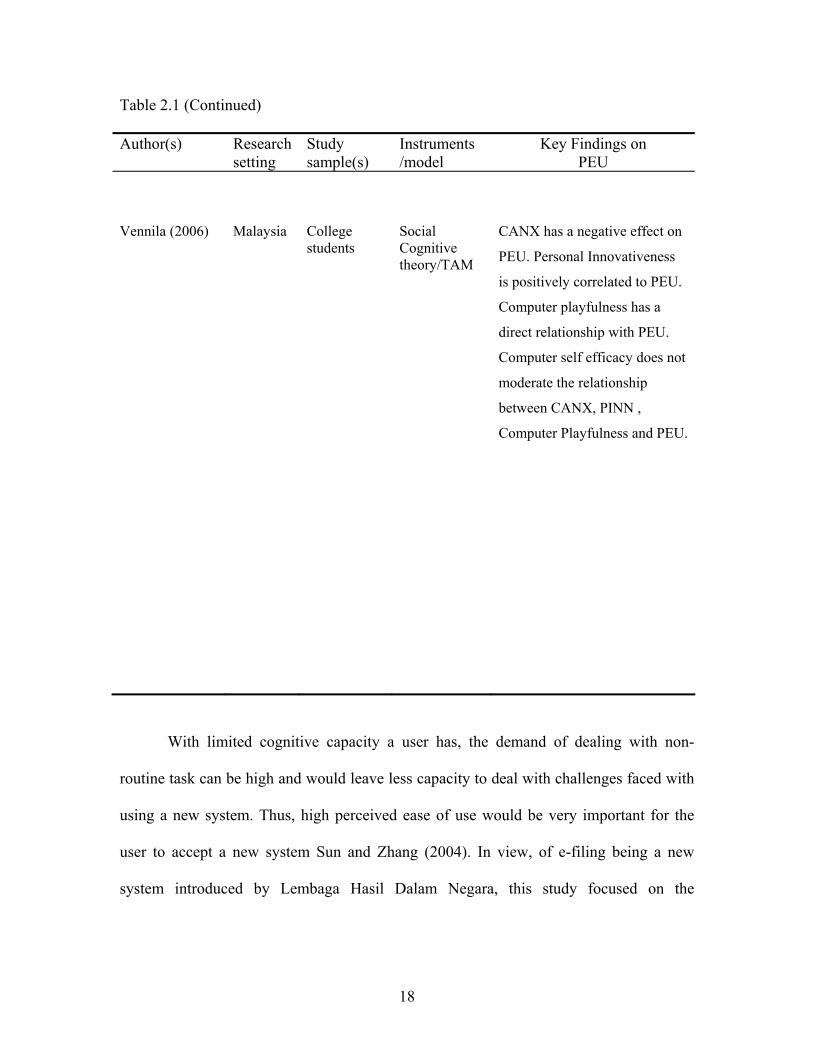
Vennila (2006)
Malaysia
College students
Social Cognitive theory/TAM
CANX has a negative effect on
PEU. Personal Innovativeness
is positively correlated to PEU.
Computer playfulness has a
direct relationship with PEU.
Computer self efficacy does not
moderate the relationship
between CANX, PINN ,
Computer Playfulness and PEU.
With limited cognitive capacity a user has, the demand of dealing with non-
routine task can be high and would leave less capacity to deal with challenges faced with
using a new system. Thus, high perceived ease of use would be very important for the
user to accept a new system Sun and Zhang (2004). In view, of e-filing being a new
system introduced by Lembaga Hasil Dalam Negara, this study focused on the

19
determinants of PEU. The key constructs chosen as the determinants of perceived ease of
use will be discussed and justified in the theoretical model.
2.4 Theoretical Framework and Model Development
The theoretical framework for this study was developed based upon careful analysis of
the work of (Fu, Fan & Chao, 2006) and (Venkatesh, 2000). Fu, Fan and Chao (2006)
study on acceptance of electronic tax filing in Taiwan cannot be adapted completely to
the Malaysian context. There are 2 main reasons for this:
(1). Taiwan had introduced e-Tax in 1998, therefore the implementation is not at the
infancy stage like in Malaysia. About 40% of tax payers’ in Taiwan are already using
e-Tax.
(2). Taiwan is rated as the top and forefront leader in the implementation of e-
government in the world according to (Global e-Government Study, 2005) of Brown
University. Therefore, Taiwan’s experience in e-Gov and e-Tax in particular is much
more advanced than in Malaysia.
Based on the fact that e-filing in Malaysia is still in the infancy stage the following
theoretical model (figure 2.2) was developed to study acceptance of e-filing in Malaysia.
The model focuses on the determinants of ease of use in using e-filing. Computer self
efficacy, Facilitating conditions, Computer Anxiety, Perceived Risk, Subjective Norm
and Personal Innovativeness are the key determinants of perceived ease of analyzed in
this study. Voluntariness has been chosen to moderate the relationship between the
determinants and perceived ease of use.

20
Figure 2.2.Theoretical framework
2.4.1 Computer Self-Efficacy (CEFF)
One of the most powerful theories of human behavior is the social cognitive theory
(SCT). Social cognitive theory (Bandura, 1986) states that self efficacy as a direct
determinant of individual’s behavior. Compeau and Higgins (1995b) applied and
extended SCT to the context of computer utilization (as cited in Venkatesh, Morris, Davis
& Davis 2000). Compeau and Higgins (1995b) model studied computer use, however the
Voluntariness
Perceived Ease of Use
Behavioral Intention to
Use
Personal innovativeness
Computer Self-Efficacy
Perceived Risk
Subjective Norm
Computer Anxiety
Facilitating Conditions
DEPENDANT VARIABLES MODERATOR INDEPENDENT VARIABLES
21
model and underlying theory allows it to be used extensively information technology
research.
In a separate research, Yin and Hwang (2003) found that application of specific
self efficacy was more powerful than behavioral intention in determining actual use of
the system β=0.3 for application specific self efficacy, β=0.19 for behavior intention.
This shows that users tend to adopt a system better when their own self-efficacy is higher.
Consequently, application-specific self-efficacy is related in the model for this study.
In a more related study on acceptance of electronic tax filing in Taiwan,
(Fu, Fan & Chao, 2006) had used self efficacy as a determinant to behavior intention.
Their study indicates the self efficacy has a direct relationship to behavior intention to use
internet tax filing. According to (Chan & Lu, 2004) individual with high computer self-
efficacy are expected to be able to competently use different software packages and
computer systems while those with low self efficacy would perceive their capabilities as
limited to particular software package or computer systems. Recent literature that showed
computer self-efficacy has a positive effect on perceived ease of use and the final
decision to use computer (Agarwal, Sambamurty & Stair, 2000; Venkatesh, 2000; Chan
& Lu, 2004; Ramayah et al.,2004; Ramayah & Aafaqi, 2004; Ramayah et al., 2005;
Hassan, 2006; Gopi, 2006). So the proposed hypotheses are:
H1a. Computer self efficacy will be positively related to ease of use.
2.4.2 Facilitating conditions (FCON)
An environment with proper facilitating conditions will promote the exhibition of the
appropriate behavior (Triandis, 1979). Taylor and Todd (1995) suggested that facilitating

22
conditions be made up of 2 aspects, namely resource facilitating conditions and
technological facilitating conditions.
Fu, Fan and Chao (2006) elaborated that the absence of facilitating resources
results in barrier to usage which may inhibit usage. Thus, a taxpayer might be unwilling
to accept e Tax (as it is known in Taiwan) if little or no computer equipment is available
and if technical support is low. Facilitating conditions was tested in a number technology
acceptance study. The finding from (Thompson et al., 1994; Venkatesh & Davis, 1996;
Taylor &Todd, 1995; Jiang, 2000) empirically supported the facilitating condition effect
perceived usefulness and perceived ease of use. Facilitating condition was found to have
a direct relationship on infusion and adoption of a number of new information system
innovation (Cheung & Chang, 2000; Jones, Sundaraman & Chin, 2002). Yu,Lu & Liu
(2005) also found strong causal relationship between wireless trust and facilitating
conditions in their study on wireless mobile internet service adoption.
For this study facilitating conditions encompasses government support and
resource support such as computers, connectivity to internet and training. This includes
government provisions of computer support. Training could lead to increased self-
efficacy which ultimately facilitates the diffusion and utilization of technology (Agarwal,
Sambamurthy & Stair, 2000).
Therefore, the proposed hypotheses are:
H2a. Facilitating conditions is positively related to perceived ease of use.
2.4.3 Computer Anxiety (CANX)
Computer anxiety like computer efficacy relates to users’ general perception about
computer use. There are two components of anxiety according to (Morris et al, 1984) -
23
cognitive and emotional. The cognitive component underlies the negative expectancies
and the emotional expectancy leads to negative physiological reactions.
Large amount of literature have highlighted the importance of computer anxiety
by showing the influence on key dependant variables. Computer anxiety has been shown
to have a significant impact on intention (Elasmar and Carter, 1996) and behavior
(Compeau & Higgins, 1995a).
Past research has show that computer anxiety has a negative impact on constructs
like perceived ease of use (Venkatesh, 2000), computer use (Igbaria & Parasuraman,
1989), computing skills (Harrison & Rainer,1992) affect towards computer (Compeau &
Higgins, 1995) and general and specific computer self efficacy on computer training
outcomes(Hassan, 2006)
Venkatesh (2000) also found that computer anxiety was one of the anchors that
users employ in forming perceived ease of use of a new system. However looking at a
practical point of view, computers have proliferated at home and workplace in Malaysia.
There may be a question if the construct of computer anxiety which was so significant in
studies over a decade ago is still relevant. However, computer anxiety will still be
included in this study as there is no substantial literature to ascertain the level of
computer efficacy among Malaysians. Based on the theoretical framework suggested,
computer efficacy will be a determinant exerting negative influence on perceived ease of
use.
H3a. Computer anxiety will be negatively related to perceived ease of use.

24
2.4.4 Perceived Risk (PRSK)
A common and widely recognized obstacle to electronic commerce adoption has been the
lack of security and privacy over the internet (Bhimani, 1996; Cockburn & Wilson, 1996;
Quein & Klein, 1996). According to (Chan & Lu, 2004), this has led many people to
view e-commerce and internet application as risky undertakings. Therefore in the context
of this study, individuals who regard e-filing as low risk would have a tendency to accept
and use e-filing.
Studies have shown significant negative relationship between perceived risk
toward attitude (Jarvenpaa & Todd, 1997; Bobbitt & Dabholkar, 2001; Heijden et al.,
2003; Liu & Wei, 2003). Studies showing negative relationship between perceived risk
and perceived usefulness includes ( Lee et al., 2001; Lee & Ho, 2002; Featherman, 2001;
Chan & Lu, 2004; Ramayah et al., 2005). However there were no prior literatures
studying the inverse relationship between perceived risk and perceived ease of use.
Frambach (1993,1995) contends that the speed of adoption is negatively related to
the level of perceived risk. The perceived risk surrounding and innovation might cause a
potential adopter to postpone the decision to adopt or reject the innovation. Users of e-
filing are influenced by risks they perceive, whether or not such risk actually exists. Their
perception of e-filing will affect their speed of adopting the system. Therefore, perceived
risk was included as one of the determinants of perceived ease of use in the present study.
Thus the hypotheses are as follows
H4a. Perceived risk is negatively related to perceived ease of use.

25
2.4.5 Subjective Norm (SNOM)
According to Fishbein and Azjen (1975 p.320) subjective norm refers to “a person’s
perception that most people who are important to him/her think he/she should or should
not perform the behavior in question”. The explanation to this is that under significant
social influence and social pressure, an individual would perform a behavior even though
the individual is not in favor of performing the behavior (Venkatesh & Davis, 2000).
Karahana and Limayen (2000) found that subjective norm was a significant
determinant of perceived ease of use in their study on voice mail and email usage.
Furthermore a large volume of literature has already shown that perceived ease of use and
perceived usefulness leads to behavior intention. In view of this, subjective norm has
been included as a determinant of perceived ease of use in this study.
Studies have shown mixed result regarding subjective norm as a predictor of
intention. Studies have shown no significant relationship between subjective norm and
intention (Davis et al., 1989; Mathieson, 1991; Chau & Hu, 2001; Lewis, Agarwal &
Sambamurthy, 2003) and some studies have shown significant relationship between
subjective norm and intention (Taylor & Todd, 1995; Venkatesh & Davis, 2000;
Ramayah et al., 2003; Ramayah et al., 2004; Eri, 2004; Chan & Lu, 2004;Bee Lee 2005;
May, 2005).
The inconsistency in the literature could be because SN shows different effects in
different conditions. Subjective norm has been found to be more important prior to, or in
the early stages of innovative implementations when users have limited direct experience
from which to develop attitudes (Hartwick & Barki, 1994). In view of e-filing is a

26
relatively new implementation, subjective norm is included as a determinant of perceived
ease of use in this study.
H5a. Subjective norm is positively related to perceived ease of use.
2.4.6 Personal Innovativeness (PINN)
Rogers (1983;1995) characterizes innovators as venturesome, early adopters as
opinion leaders who are widely respected in their social circle, early majority members as
“deliberate”, the late majority as “skeptical” about the value of the innovation, and
laggards as “traditional”. Rogers had used innovativeness to categorize use.
Agarwal and Prasad (1998) conceptualized personal innovativeness to predict
individual adoption of IT innovation. Agarwal and Prasad (1998) developed and
validated a construct labeled “personal innovativeness in the domain of IT” which they
conceptually defined as the willingness of an individual to try out any new information.
Personal innovativeness with information technology was found to have a positive
influence on beliefs on ease of use of the technology in the study by Agarwal, Lewis &
Sambamurty (2003) on information technology use among knowledge workers.
Early adopters frequently serve as opinion leaders who can persuade others to
adopt the innovation by providing evaluative information (Rogers, 1995). Relating this
back to our subject of study, it is hoped that understanding the characteristics of early
adopters of e-filing in this study can serve to be useful as it will explain adoption
behaviors necessary for accepting e-filing.
In general this concept is associated with more positive beliefs about technology
use. Thus, in the context of the present study, it is expected that early adopters of an IT

27
innovation should exhibit more positive response to the new introduction of e-filing.
Hence the suggestion for hypotheses is :
H6a. Personal innovativeness is positively related to perceived ease of use.
2.4.7 Voluntariness (VOL)
Voluntariness has been included as a moderator to the theoretical model of this study.
Venkatesh at al., (2003) included moderating variables like voluntariness and experience
in his study and found the explanatory power of his TAM2 model increased from 35%
without moderators to 53% with moderators. Therefore, voluntariness has been included
as a moderator to understand if it enhances the explanatory power of this study.
Venkatesh and Davis (2000) confirmed that SNOM had a significant direct effect
on intentions for the mandatory but not for the voluntary usage context; therefore
voluntariness was considered as a moderating factor to subjective norm to behavior
intention.
e-Filing is currently implemented on a voluntary basis in Malaysia during the
initial implementation.. Therefore effects of voluntariness as a moderator between
computer self efficacy, facilitating conditions, computer anxiety, perceived risk,
subjective norm, personal innovativeness and PEU is analyzed in this study. Although it
is common knowledge that e-filing is implemented on a voluntary basis in 2006, it is
important to understand if all respondents also perceive the new tax filing system as
voluntary in order for the study not to be biased.
H1a. The relationship between self efficacy and perceived ease of use will be
stronger when Voluntariness is high.
28
H2a. The relationship between facilitating conditions and perceived ease of use
will be stronger when voluntariness is high.
H3a. The relationship between computer anxiety and perceived ease of use will be
weaker when voluntariness is high.
H4a. The relationship between perceived risk and perceived ease of use will be
weaker when voluntariness to use is high.
H5a. The relationship between subjective norm and perceived ease of use will be
weaker when voluntariness is high.
H6a. The relationship between personal innovativeness and perceived ease of use
will be stronger when voluntariness is high.
2.4.8 Perceived Ease of Use (PEU)
Perceived Ease of Use (PEU) is defined by (Davis, 1989) as the degree to which a
person believes that using a particular system would be free of effort. Past research
provides evidence of the significant effect of perceived ease of use on usage intention
either directly or indirectly through its effect on perceived usefulness.( Agarwal &
Prasad, 1999, Davis et al.,1989, Venkatesh, 1999;Venkatesh 2000;Venkatesh & Morris,
2000; Ramayah & Aafaqi 2004, Ramayah 2006a).
Information systems that users perceive easier to use and less complex will
increase the likelihood of its adoption and usage (Teo et al.,1999). PEU has been shown
to influence behavior (i.e., IT adoption) through two causal ways: (1) a direct effect on
behavior intention and (2) indirect effect on behavior intention via PU.
29
Perceived ease of use positively influenced behavior intention. Past research by
Hong et al.,(2001), Gefen et al.,(2003), Heijden (2003), Venkatesh et al.,(2003) and
Heijden (2003) also found perceived ease of use to influence behavior intention
In order to encourage tax payers in Malaysia to use e-Filing, it is paramount to
understand the factors that influence the intention to use e-Filing. Thus, the suggestion
for hypotheses is:
H7. Perceived ease of use is positively related to behavior intention.

30
Chapter 3
RESEARCH METHODOLOGY
3.1 Introduction
The objective of this chapter is to explain the steps taken in investigating the research
problems. Discussion in this section will cover the research design and procedure,
variables and measurement, data collection method, questionnaire design and data
analysis.
3.2 Research Design and Procedure
3.2.1 Type of Study This is a correlational study. This study was conducted among tax payers’ working in the
government and private sectors in Penang. Hypotheses testing was undertaken to explain
the variance in the dependent variables to predict relationship.
3.2.2 Nature of Study
This study was conducted under the non-contrived setting (natural environment). The
variables are neither controlled nor manipulated. This is a cross sectional study where
data were gathered over 3 week period after the launch of e-filing system in Malaysia.
Data were gathered from willing respondents in Penang.
3.2.3 Unit of Analysis
The unit of analysis is individuals are tax payers’ in Malaysia.
31
3.2.4 Research Site
The research sites for this study are individuals who work in Penang
3.3 Population, Sample size and Sampling Technique
The population is individuals who are tax payers’ in Malaysia. The general rule,
minimum number of respondent or sample size is five-to-one ratio of the number of
independent variables to be analyzed. Hair et al. (1998) proposed the acceptable ratio
would be ten-to-one ratio of the independent variables. Based on the five-to-one ratio the
minimum number of respondent would be thirty (30) respondents and based on the ten-
to-one ration the minimum number of respondents would be sixty (60) respondents. Non-
probability purposive convenient sampling method was used as time constraints and
convenience in order to obtain enough respondents. The list of tax payers in Malaysia
cannot be obtained therefore probability sampling could not be done.
3.3 Scales and Measurement
For section A, the demographic variables are measured by using nominal scale. The
interval scale of measurement was applied in Section C to Section N.
The respondents were asked to read and indicate their agreement or disagreement with
each of the statement designed at Section C to Section N, using the 5-point scale. The
attitude ratings are as follows:
32
Strongly Agree 1
Agree 2 Neutral 3 Disagree 4 Strongly Disagree 5 All instruments were adopted from various literatures and were modified for the purpose
of understanding e-filing usage intention in Malaysia.
3.3.1 Independent variable The independent variable is defined as the presumed cause of some changes in the
dependant variable (Robbins, 1998).
3.3.1.1 Computer Self-Efficacy
Computer self-efficacy of the individuals was measures on three items using 5-point scale
ranging from “strongly disagree” (1) to “strongly agree” (5). Items were derived from Fu,
Fan and Chao (2006) and Venkatesh (2000). Example of question is “I would feel
comfortable doing the internet e-filing on my own”.
3.3.1.2 Facilitating conditions
Facilitating condition (resource, technology, government and training provision support)
were measured with five items using 5-point scale ranging from “strongly disagree” (1)
to “strongly agree” (5). Item were derived from Fu, Fan and Chao (2006) and Gopi
(2006). Example of question is “There will not be enough computers and network
equipment for me to use e-filing”

33
3.3.1.3 Computer Anxiety
The measure was derived from Lewis, Agarwal & Sambamurthy (2003) and Gopi (2006).
There were a total of three items using 5-point scale ranging from “strongly disagree” (1)
to “strongly agree” (5).Example of question is “I feel apprehensive about the thought of
using a computer to do my e-filing”
3.3.1.4 Subjective Norm
Three items using a 5-point scale was used to measure subjective norm ranging from
“strongly disagree” (1) to “strongly agree” (5). The items for subjective norm were
derived from Fu, Fan and Chao (2006) and Oh Sook May (2005). Example of items is
“Most people I know use e-filing”
3.3.1.5 Perceived Risk
Perceived risk by the individuals were measured using four items using a 5-point scale
ranging from “strongly disagree” (1) to “strongly agree” (5). Items were derived from Fu,
Fan and Chao (2006), Gopi (2006) and Tham Kian Teck (2004). Example of question is
“It is hard for my private tax information to remain confidential with e-filing”
3.3.1.6 Personal Innovativeness
Personal innovativeness of the individuals was measured using four items using a 5-point
scale ranging from “strongly disagree” (1) to “strongly agree” (5). Items were derived
from Lewis, Agarwal and Sambamurthy (2003) and Agarwal and Prasad (1998).
Example of question is “If I heard about a new information technology, I would look for
ways to experiment with it”
34
3.3.2 Dependent Variable
Dependant variables are the key factor that has been looked into to explain or predict if
they are affected by some other factors. The dependant variable for this study is
perceived ease of use.
3.3.2.1 Perceived Ease of Use
Perceived ease of use was measured by items adopted and validated by Chau & Hu
(2001) and Davis (1989). It has a total of six items measuring perceived ease of use of
user. Example of item is “Learning to use e-filing method would be easy for me”.
3.3.3 Moderating Variable
3.3.3.1 Voluntariness
Three items using a 5-point scale was used to measure voluntariness ranging from
“strongly disagree” (1) to “strongly agree” (5). The items for voluntariness were derived
from Venkatesh (2000). Example of items is “Lembaga Hasil Dalam Negara expects me
to use e-Filing”
3.4 Questionnaire Design
One hundred and twenty individuals voluntarily completed the questionnaire. The final
questionnaire had 44 questions to measure the constructs of interest as well as some
demographic questions. Table 3.1 depicts that all instruments used in this study had a
corresponding Cronbach alpha >.80 .

35
Table 3.1 Questionnaire source and validity Variable Construct Items Cronbach Author
Computer Self Efficacy
3 >.80 Lewis,Agarwal & Sambamurthy (2003) and Gopi (2006)
Facilitating conditions
5 >.80 Fu, Fan & Chao (2006)
Computer Anxiety 3 .92 Lewis, Agarwal & Sambamurthy (2003)
Subjective norm 3 >.80 Fu, Fan & Chao (2006)
Perceived Risk
4 >.80 Godwin (1996)
Independent
Personal innovativeness
4 >.80 Lewis, Agarwal & Sambamurthy (2003)
Dependent Perceived Ease of Use
6 .94 Davis (1989)
Moderator Voluntariness 4 >.80 Venkatesh (2000)
3.5 Data Collection Method
Data for this study was collected through structured questionnaires. The questionnaires
were distributed to individuals from various professions in Penang.
3.6 Statistical Data Analyses
The data gathered through questionnaire was coded and analyzed using the computerized
SPSS (Statistical Software Package for Social Science) software version 12. They were
summarized using appropriate descriptive and inferential statistics.
3.6.1 Goodness and Correctness of Data Entry
Establishing the goodness of data lends credibility to all subsequent analyses and
findings (Sekaran, 2003). Purpose was to provide a preliminary idea of how good the
scales were by checking the central tendency and distribution of the responses. Data will

36
be checked against data entry error by running descriptive statistics for minimum,
maximum, and count. The mean, range, standard deviation and variance in the data will
give a good idea of how the respondents have reacted to items in the questionnaire
(Sekaran, 2003). However the missing value does not indicate whether the data had been
entered correctly.
3.6.2 Factor Analysis
In order to ascertain the goodness of the data, the raw data collected was subjected to
factor analysis. Factor analysis helps to reduce a vast number of variables to a
meaningful, interpretable and manageable set of factors (Sekaran, 2003). When a
researcher has a set of variables and suspects that these variables are interrelated in a
complex fashion, then factor analysis can be used to untangle the linear relationships into
their separate patterns (Zikmund, 2003). In addition, if several independent variables are
highly correlated, a factor analysis as a preliminary step prior to regression analysis and
use of factor scores may reduce the problem of having several intercorrelated
independent variables.
Anti-image correlation matrix, Kaiser-Meyer-Oklin (KMO) Measure of Sampling
Adequacy and Bartlett test of Sphericity were verified prior to the conduct of factor
analysis. The minimum acceptable values that indicated appropriateness of anti-image
correlation and KMO are .50 and .60 respectively (Hair, Anderson, Tatham & Black,
1998). Items with eigen values greater than one will be extracted, the extracted items with
factor loadings of more than .50 and cross loadings less than or equal to .30 (Hair, et al.,
1998) were selected for each factor.
37
3.6.3 Validity and Reliability
Validity tests are very important for testing the goodness of measures. Both validity and
reliability must be addressed in assessing the degree of measurement error present in any
measure. Validity ensures the ability of a scale to measure the intended concept (Sekaran,
2003). Reliability is the accuracy or precision of a measuring instrument that is the extent
to which the respondent can answer the same or approximately the same questions the
same way each time.
Content validity ensures that the measures include an adequate and representative
set of items that tap the concept (Sekaran, 2003). In other words, content validity is a
function of how well the dimensions and elements of a concept have been delineated.
Badri et al., (1995), views content validity as depending on how well the researchers
create measurement items to cover the content domain of the variable being measured.
The content validity of the questionnaire was established through literature review. This
would ensure that the variables are measured correctly and at the same time the
respondents understood the clarity, wordings, interpretation and appropriateness of the
questions.
Cronbach’s coefficient alpha is the commonly used measure for internal
consistency reliability. Cronbach’s alpha value of .7 and above is considered to be
reliable (Nunnally & Bernstein, 1998). An alpha value of .7 and above indicates items are
homogenous and measuring the same construct. Uma Sekaran (2003) suggested that
alpha value of .5 would be deemed the lower value of acceptability.
38
3.6.4 Descriptive Analysis
Descriptive analysis was employed to understand the overall profiles of respondents.
Descriptive analysis was not used to analyze gender, race, education and income level.
For this data, the frequencies and percentage was used for computation
3.6.5 Regression Analysis
Multiple regression analysis is a statistical technique that can be used to analyze the
effect of two or more independent variables on a single interval-scaled dependent
variable (Zikmund, 2000). In selecting suitable applications of multiple regressions, there
are three primary issues to be considered. The following are the assumptions that were
incorporated in the test.
a. Normality
Normality test was performed by using a histogram and plotting the normal
probability plot (p-p plot). If the histogram appears to at least resemble a bell
shape curve and all the residuals were located along the diagonal line of p-p plot,
it was assumed that the normality requirement has been met.
b. Homoscedasticity
The condition that occurs when the error variances produced by a regression
model is constant. Homoscedasticity or equal variance was verified through the
scatter plots of regression of standardized residual versus regression of
standardized predicted values.

39
c. Independence of Error Term
Independence of Error Term means the predicted value is independent of other
predicted values. Durbin-Watson statistics was used to validate the independence
of error term assumption. Value of Durbin-Watson should fall between 1.50 and
2.50, which implies no auto-correlation problem.
d. Multicollinearity
Multicollinearity is when two or more of the independent variables of a multiple
regression model are highly correlated. Problems of multicollinearity among
predictors can result in an overestimation of the standard deviation of the
regression coefficients. Tolerance above .1, Variance Inflation Factor (VIF) value
below 10 and condition index below 30 signifies no major multicollinearity
issues.
e. Outliers
Casewise diagnostics was run to identify any outlier in the sample. Any cases that
fell above the standard deviation value of 2.50 would be dropped.
3.6.6 Hierarchical Regression
Hierarchical Regression was run to understand the moderating effect of Voluntariness in
the relationship model.

40
Chapter 4
ANALYSIS AND RESULT
4.1 Introduction
This chapter represents the result of the study from the statistical analysis conducted on
the collected data and hypotheses testing. In the first part of this chapter the presentation
would be on the characteristics of respondent profiles. The goodness of measured is
determined by analyzing factor analysis, reliability analysis on the measurement and
descriptive analysis. The final part of this chapter would be focused on hypotheses
testing, correlation testing, multiple regression analysis and hierarchical regression
4.2 Samples and Profiles
A total of 110 responses were obtained from 250 questionnaires. From the 110, 10 were
discarded due to incomplete data giving the final response rate of 40%.
The respondents comprised mainly of males, 52 respondents (52.0%) and 48
females (48.0%). 44.0% (44) of the 100 respondents were Indians, 35.0% (35) were
Chinese and 20.0% (20) were Malays whereas other races comprised of 1.0%.
The education level of the respondents was high, bachelor degree holders
comprised of 51 (51.0%) of the respondents. Diploma, certificate and secondary school
leavers with 32 (32.0%) of respondents and master degree holders 17(17.0%). In terms of
employment, 22 respondents (22.0%) were from the government sector whereas 75
respondents (75.0%) were from the non government sector or self employed category. In
terms personal income, 39.0% earned above RM4000 and 21.0% earned RM3001 to
RM4000. In term of the respondent marital status, 28 respondents (28.0%) were single
41
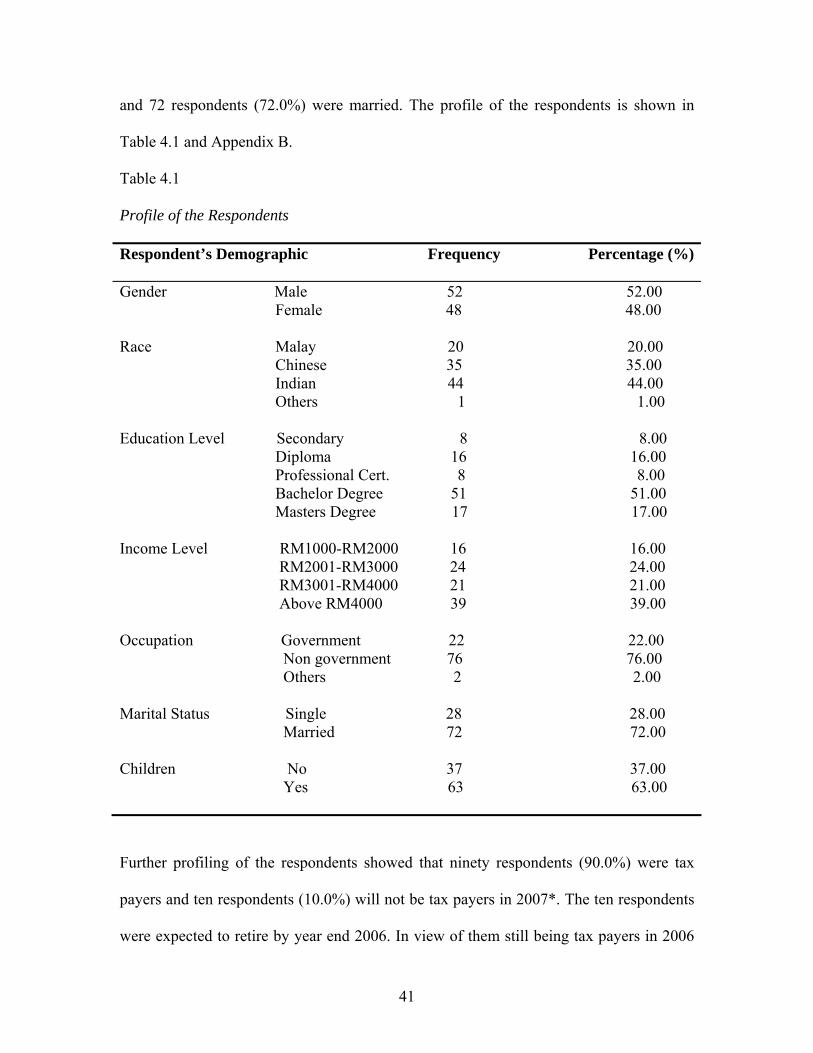
and 72 respondents (72.0%) were married. The profile of the respondents is shown in
Table 4.1 and Appendix B.
Table 4.1
Profile of the Respondents
Respondent’s Demographic Frequency Percentage (%)
Gender Male 52 52.00 Female 48 48.00 Race Malay 20 20.00 Chinese 35 35.00 Indian 44 44.00 Others 1 1.00 Education Level Secondary 8 8.00 Diploma 16 16.00 Professional Cert. 8 8.00 Bachelor Degree 51 51.00 Masters Degree 17 17.00 Income Level RM1000-RM2000 16 16.00 RM2001-RM3000 24 24.00 RM3001-RM4000 21 21.00 Above RM4000 39 39.00 Occupation Government 22 22.00 Non government 76 76.00 Others 2 2.00 Marital Status Single 28 28.00 Married 72 72.00 Children No 37 37.00 Yes 63 63.00
Further profiling of the respondents showed that ninety respondents (90.0%) were tax
payers and ten respondents (10.0%) will not be tax payers in 2007*. The ten respondents
were expected to retire by year end 2006. In view of them still being tax payers in 2006
42
their data was included in this study. Most of the respondents had computer and network
facilities at home, forty one respondents (41.0%) had access to wireless broadband, thirty
six respondents (36.0%) used dial up to connect to internet at home, whereas four
respondents (4.0%) have no computer at home and the remaining sixteen respondents
(16.0%) have computer at home but cannot connect to internet
In terms of computer and network facilities at work, thirty nine respondents
(39.0%) had access to wireless broadband at work, thirty six respondents (36.0%) used
LAN at work and thirteen respondents (13.0%) used dial up to connect to internet at
work. Eighty respondents (80.0%) used internet a few times a week and five respondents
(5.0%) used internet once a week.
A majority number of respondents (87.0%) used manual tax filing in 2006
whereas only thirteen respondents (13%) used e-Filing in year 2006. In terms of the tax
paying method that the respondents plan to adopt in year 2007, thirty seven respondents
(37.0%) planned to stick to manual tax filing whereas sixty three respondents (63.0%)
have plans to adopt e-Filing. The internet access profile and tax paying method
preference is as shown in Table 4.2 and Appendix C.
43
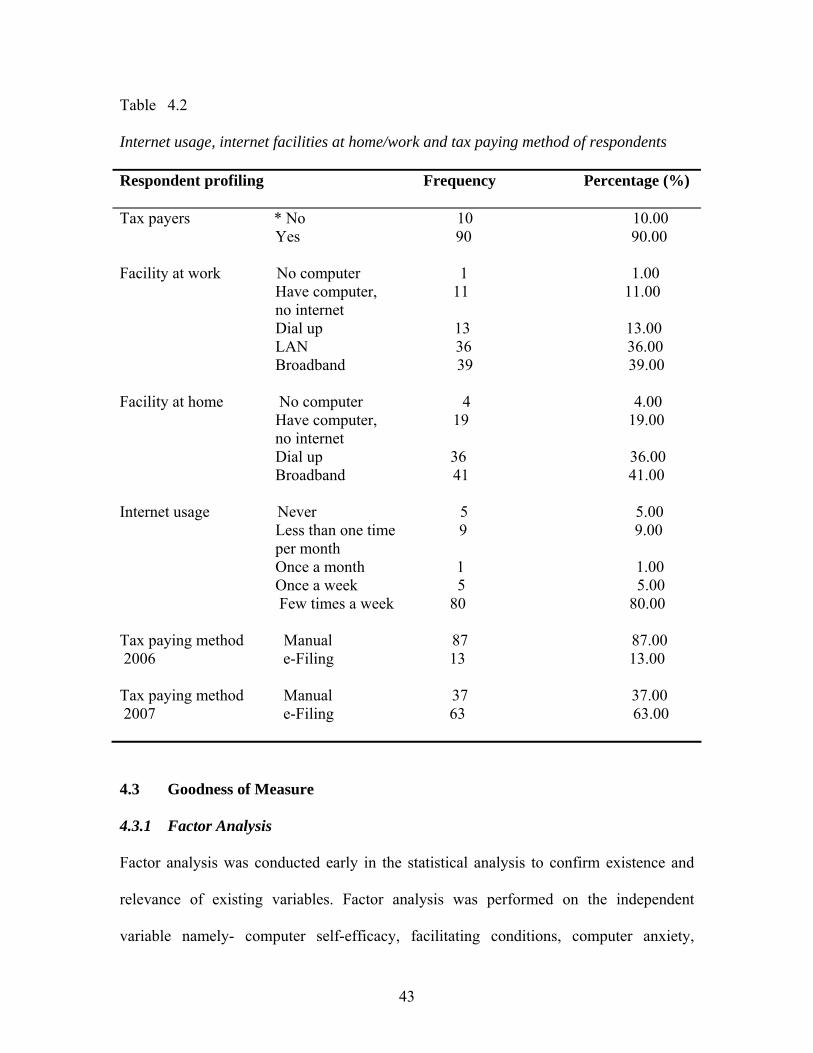
Table 4.2
Internet usage, internet facilities at home/work and tax paying method of respondents
Respondent profiling Frequency Percentage (%)
Tax payers * No 10 10.00 Yes 90 90.00 Facility at work No computer 1 1.00 Have computer, 11 11.00 no internet Dial up 13 13.00 LAN 36 36.00 Broadband 39 39.00 Facility at home No computer 4 4.00 Have computer, 19 19.00 no internet Dial up 36 36.00 Broadband 41 41.00 Internet usage Never 5 5.00 Less than one time 9 9.00 per month Once a month 1 1.00 Once a week 5 5.00 Few times a week 80 80.00 Tax paying method Manual 87 87.00 2006 e-Filing 13 13.00 Tax paying method Manual 37 37.00 2007 e-Filing 63 63.00
4.3 Goodness of Measure
4.3.1 Factor Analysis
Factor analysis was conducted early in the statistical analysis to confirm existence and
relevance of existing variables. Factor analysis was performed on the independent
variable namely- computer self-efficacy, facilitating conditions, computer anxiety,
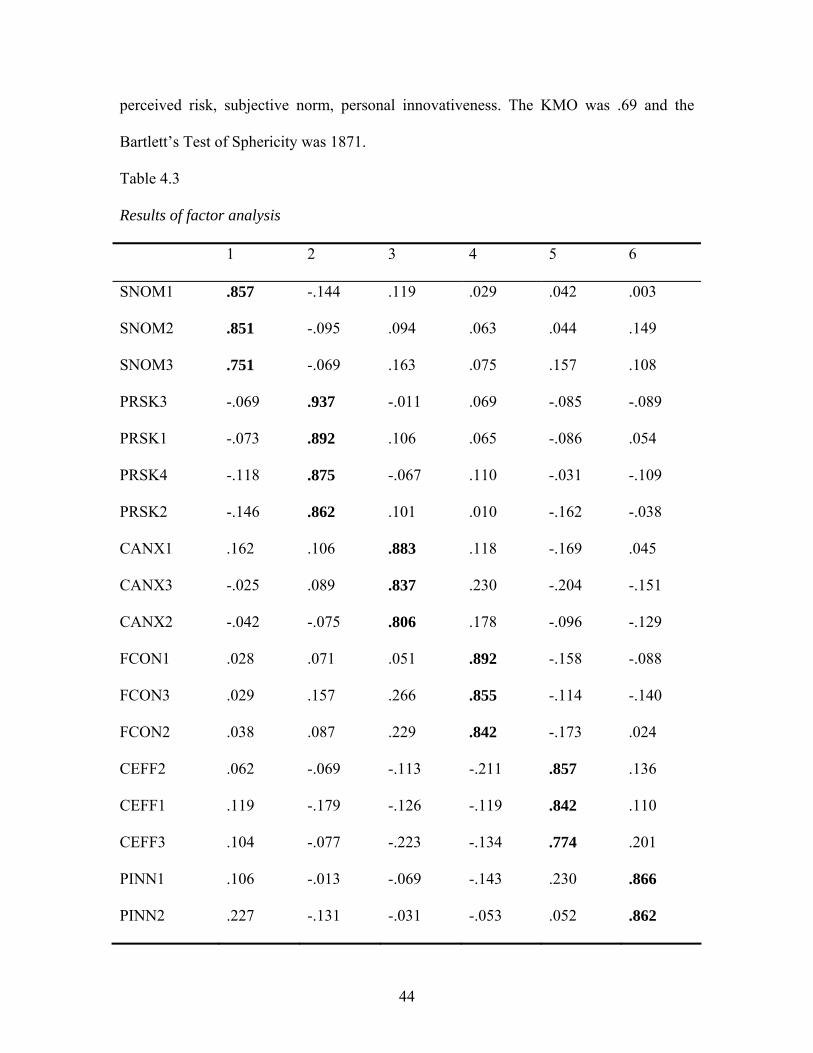
44
perceived risk, subjective norm, personal innovativeness. The KMO was .69 and the
Bartlett’s Test of Sphericity was 1871.
Table 4.3
Results of factor analysis
1 2 3 4 5 6
SNOM1 .857 -.144 .119 .029 .042 .003
SNOM2 .851 -.095 .094 .063 .044 .149
SNOM3 .751 -.069 .163 .075 .157 .108
PRSK3 -.069 .937 -.011 .069 -.085 -.089
PRSK1 -.073 .892 .106 .065 -.086 .054
PRSK4 -.118 .875 -.067 .110 -.031 -.109
PRSK2 -.146 .862 .101 .010 -.162 -.038
CANX1 .162 .106 .883 .118 -.169 .045
CANX3 -.025 .089 .837 .230 -.204 -.151
CANX2 -.042 -.075 .806 .178 -.096 -.129
FCON1 .028 .071 .051 .892 -.158 -.088
FCON3 .029 .157 .266 .855 -.114 -.140
FCON2 .038 .087 .229 .842 -.173 .024
CEFF2 .062 -.069 -.113 -.211 .857 .136
CEFF1 .119 -.179 -.126 -.119 .842 .110
CEFF3 .104 -.077 -.223 -.134 .774 .201
PINN1 .106 -.013 -.069 -.143 .230 .866
PINN2 .227 -.131 -.031 -.053 .052 .862
45
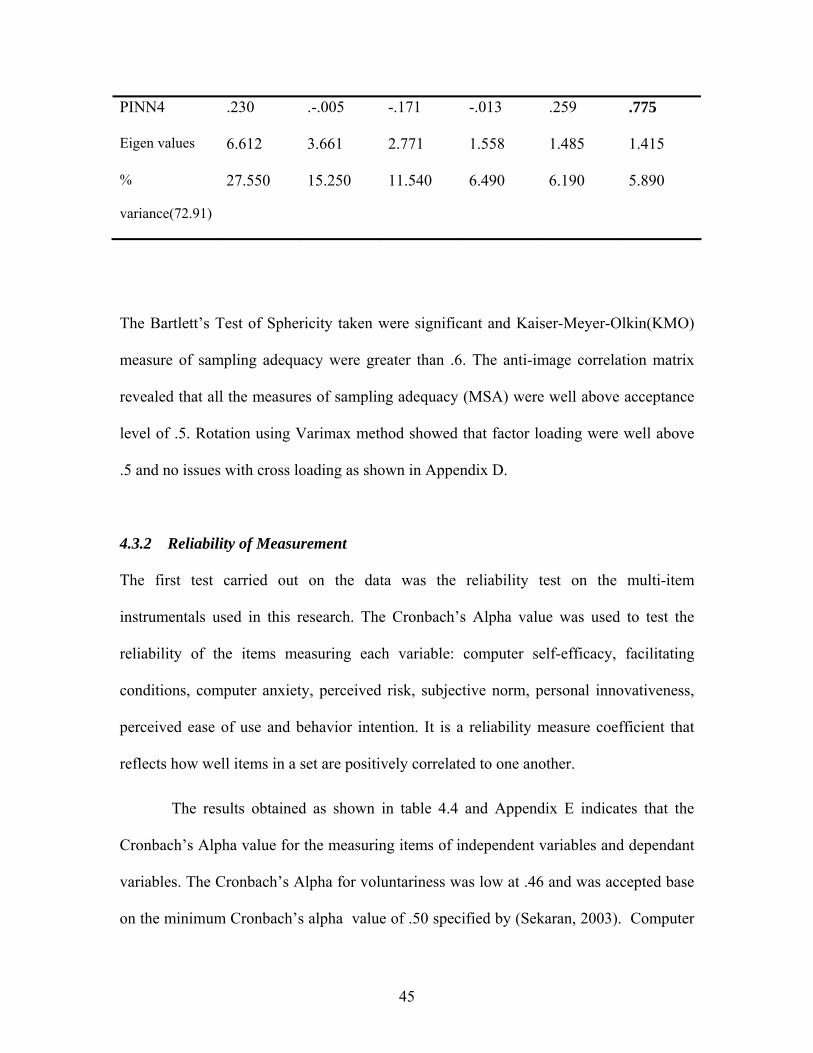
PINN4 .230 .-.005 -.171 -.013 .259 .775
Eigen values 6.612 3.661 2.771 1.558 1.485 1.415
%
variance(72.91)
27.550 15.250 11.540 6.490 6.190 5.890
The Bartlett’s Test of Sphericity taken were significant and Kaiser-Meyer-Olkin(KMO)
measure of sampling adequacy were greater than .6. The anti-image correlation matrix
revealed that all the measures of sampling adequacy (MSA) were well above acceptance
level of .5. Rotation using Varimax method showed that factor loading were well above
.5 and no issues with cross loading as shown in Appendix D.
4.3.2 Reliability of Measurement
The first test carried out on the data was the reliability test on the multi-item
instrumentals used in this research. The Cronbach’s Alpha value was used to test the
reliability of the items measuring each variable: computer self-efficacy, facilitating
conditions, computer anxiety, perceived risk, subjective norm, personal innovativeness,
perceived ease of use and behavior intention. It is a reliability measure coefficient that
reflects how well items in a set are positively correlated to one another.
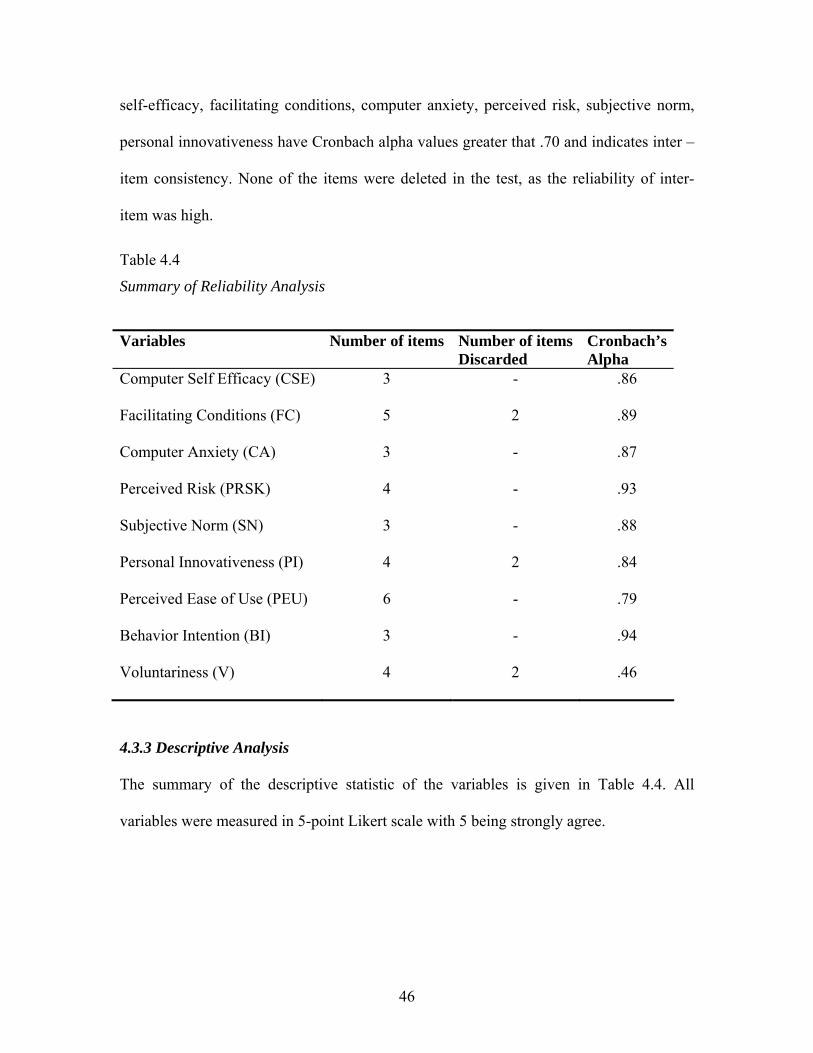
The results obtained as shown in table 4.4 and Appendix E indicates that the
Cronbach’s Alpha value for the measuring items of independent variables and dependant
variables. The Cronbach’s Alpha for voluntariness was low at .46 and was accepted base
on the minimum Cronbach’s alpha value of .50 specified by (Sekaran, 2003). Computer
46
self-efficacy, facilitating conditions, computer anxiety, perceived risk, subjective norm,
personal innovativeness have Cronbach alpha values greater that .70 and indicates inter –
item consistency. None of the items were deleted in the test, as the reliability of inter-
item was high.
Table 4.4
Summary of Reliability Analysis
Variables Number of items Number of items Discarded
Cronbach’sAlpha
Computer Self Efficacy (CSE) 3 - .86
Facilitating Conditions (FC) 5 2 .89
Computer Anxiety (CA) 3 - .87
Perceived Risk (PRSK) 4 - .93
Subjective Norm (SN) 3 - .88
Personal Innovativeness (PI) 4 2 .84
Perceived Ease of Use (PEU) 6 - .79
Behavior Intention (BI) 3 - .94
Voluntariness (V) 4 2 .46
4.3.3 Descriptive Analysis
The summary of the descriptive statistic of the variables is given in Table 4.4. All
variables were measured in 5-point Likert scale with 5 being strongly agree.

47
Table 4.5 Overall Descriptive Statistics of the Study Variables Mean Std. Deviation
Perceived Ease of Use 3.30 .52
Facilitating Conditions 2.28 .85
Computer Anxiety 2.57 .79
Computer Efficacy 3.70 .69
Perceived Risk 3.25 .77
Subjective Norm 2.62 .82
Personal Innovativeness with Technology
3.17 .77
Voluntariness 2.96 .57
Behavior Intention 3.27 .99
4.4 Hypotheses Testing
4.4.1 Correlation Analysis
Pearson Product-Moment Correlation was used to investigate the inter-correlations
among all the study variables. Table 4.6 and Appendix F provides the summary of the
results.
4.4.2 Multiple Regression 1
The first regression was run to determine the relationship between computer self-efficacy,
facilitating conditions, computer anxiety, perceived risk, subjective norm, personal
innovativeness toward perceived ease of use. Hypotheses 1a, 2a, 3a, 4a, 5a and 6a were
tested at this stage.

48
From the output of regression from the ANOVA table, the variables were tested
significant with (p<.01) and F = 12.81. The regression tests had presented a strong
inference with R square of .458. Approximately 45.8% variations of perceived ease of
use to use e-Filing can be explained by self-efficacy, facilitating conditions, computer
anxiety, subjective norm, personal innovativeness. The adjusted R2 value is .422.
Table 4.6 Pearson’s Correlation Coefficients of the Study Variables PINN PEU PRSK SNOM CANX CEFF FCON BI
Personal Innovativene 1.00
Perceived Ease of Use .308** 1.00
Perceived Risk -.165 -.137 1.00
Subjective Norm -.277** .335** -.217* 1.00
Computer Anxiety -.175* -.222* .109 -.112 1.00
Computer Efficacy .329** .538** -.250** .174* -.383** 1.00
Facilitating Condition -.182* -.021 .177* -.079 .418** -.382** 1.00
Behavior Intention .472** .502*** -.455** .615** -.102 .391** -.163 1.00
**.Correlation is significant at the .01 level (1-tailed) *.Correlation is significant at the .05 level (1-tailed)
The Durbin-Watson value of 2.208 was confined to the acceptable range( 1.5 to
2.5). It indicated that there was no autocorrelation of error terms. Multicollineraity
problems did not exist as the variance inflation factor (VIF) values were below 10 and the
condition indices were below the safety limit of 30.
49
The normality of the sample was demonstrated by a bell shape histogram.
Diagnosis of the scatter plots showed homoscedasticity (constant variance of error term).
P-P plots also indicated no sign of normality of the error. No clear relationship between
the residuals and the predicted values confirmed the assumption of linearity.
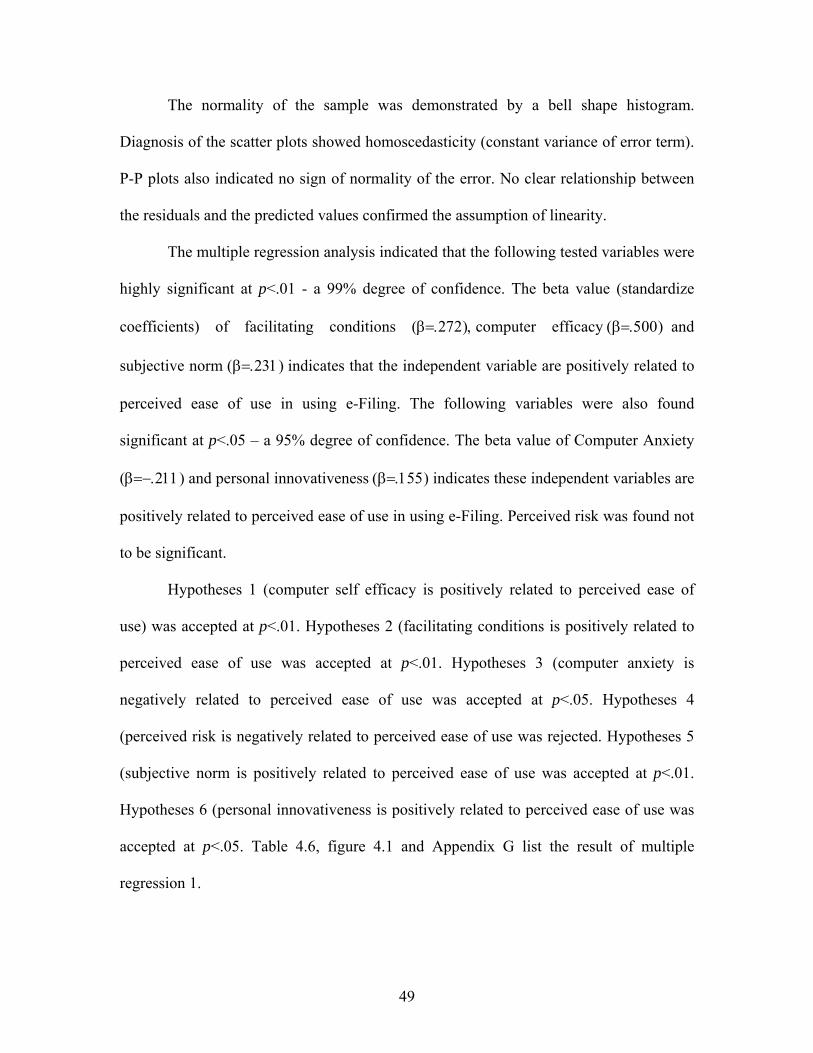
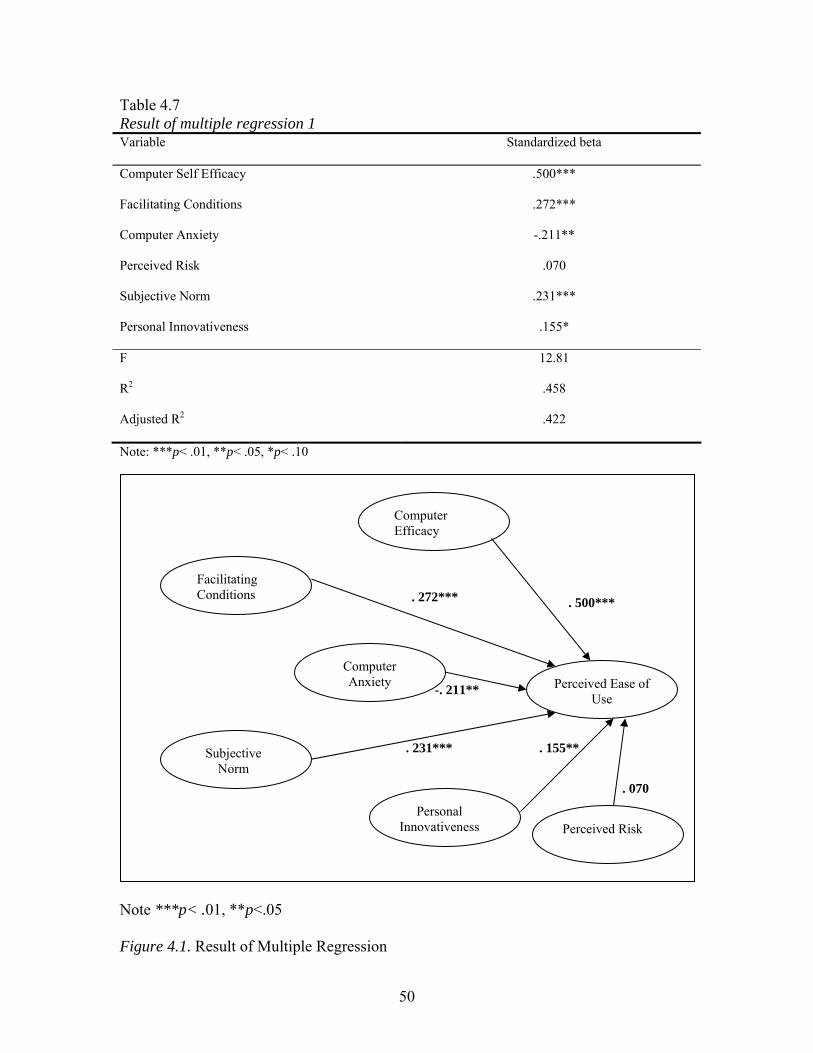
The multiple regression analysis indicated that the following tested variables were
highly significant at p<.01 - a 99% degree of confidence. The beta value (standardize
coefficients) of facilitating conditions (β=.272), computer efficacy (β=.500) and
subjective norm (β=.231) indicates that the independent variable are positively related to
perceived ease of use in using e-Filing. The following variables were also found
significant at p<.05 – a 95% degree of confidence. The beta value of Computer Anxiety
(β=−.211) and personal innovativeness (β=.155) indicates these independent variables are
positively related to perceived ease of use in using e-Filing. Perceived risk was found not
to be significant.
Hypotheses 1 (computer self efficacy is positively related to perceived ease of
use) was accepted at p<.01. Hypotheses 2 (facilitating conditions is positively related to
perceived ease of use was accepted at p<.01. Hypotheses 3 (computer anxiety is
negatively related to perceived ease of use was accepted at p<.05. Hypotheses 4
(perceived risk is negatively related to perceived ease of use was rejected. Hypotheses 5
(subjective norm is positively related to perceived ease of use was accepted at p<.01.
Hypotheses 6 (personal innovativeness is positively related to perceived ease of use was
accepted at p<.05. Table 4.6, figure 4.1 and Appendix G list the result of multiple
regression 1.
50
Table 4.7 Result of multiple regression 1 Variable Standardized beta
Computer Self Efficacy .500***
Facilitating Conditions .272***
Computer Anxiety -.211**
Perceived Risk .070
Subjective Norm .231***
Personal Innovativeness .155*
F 12.81
R2 .458
Adjusted R2 .422
Note: ***p< .01, **p< .05, *p< .10
Note ***p< .01, **p<.05
Figure 4.1. Result of Multiple Regression
Perceived Ease of Use
Computer Efficacy
Facilitating Conditions
Computer Anxiety
Subjective Norm
Personal Innovativeness
. 500*** . 272***
-. 211**
. 231*** . 155**
. 070
Perceived Risk
51
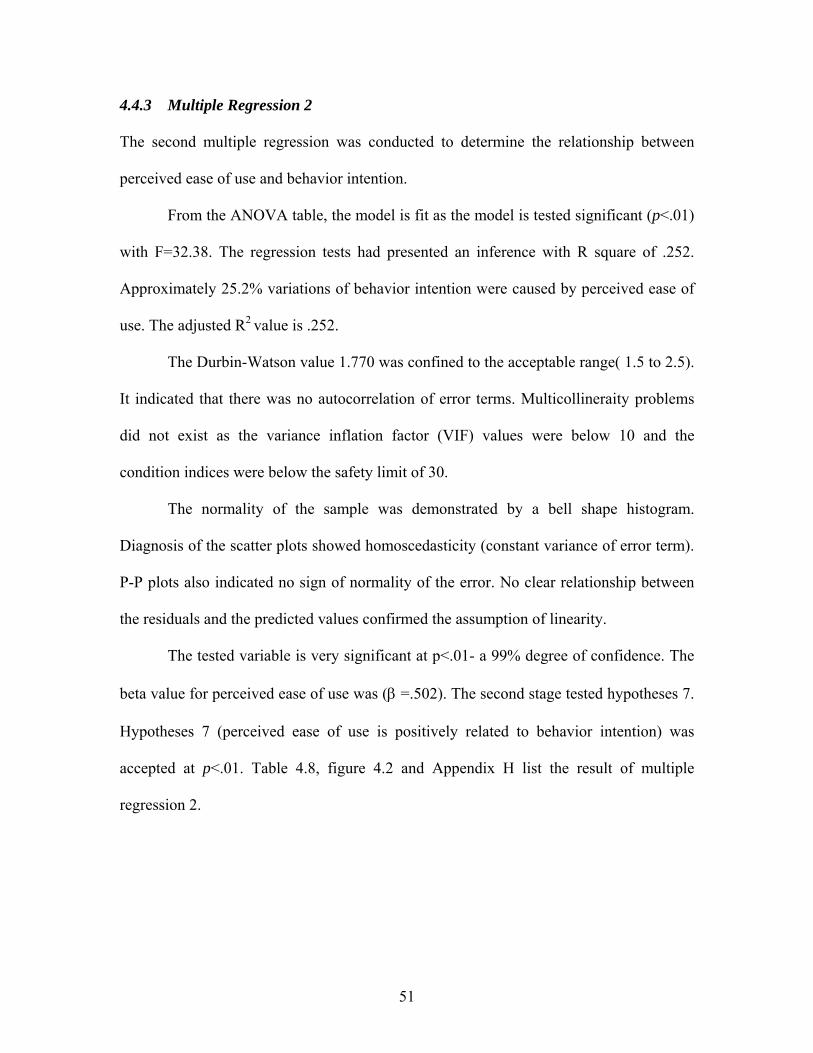
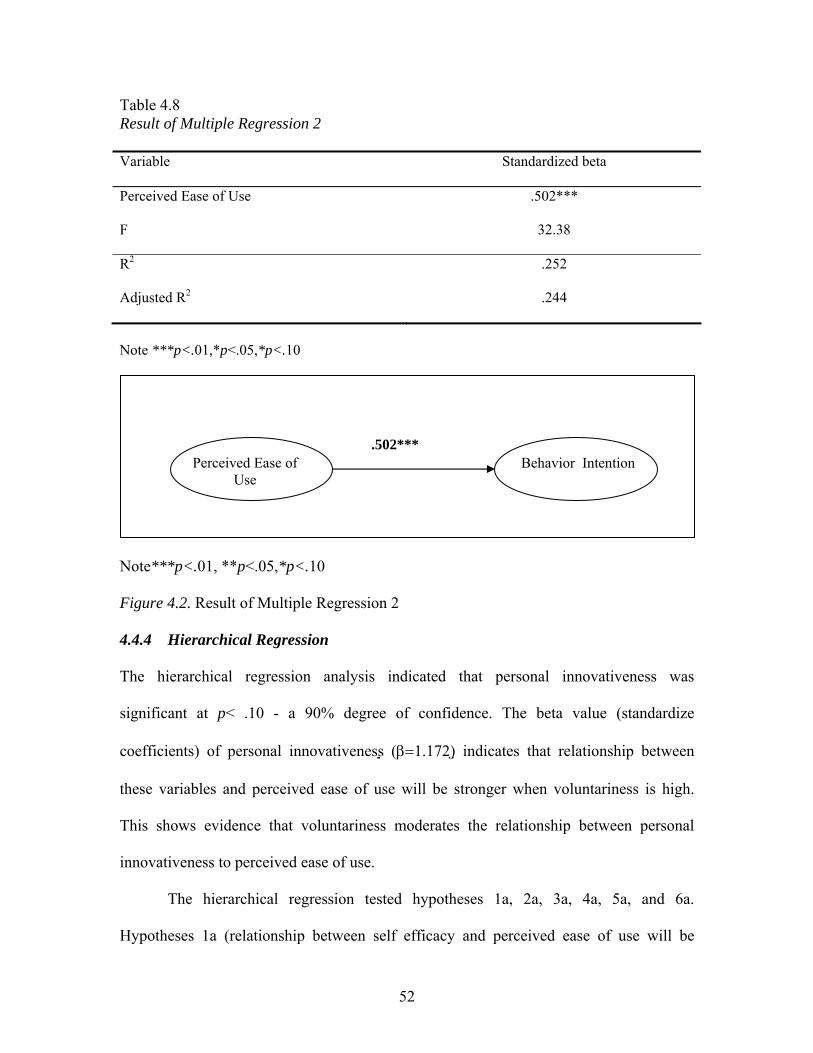
4.4.3 Multiple Regression 2
The second multiple regression was conducted to determine the relationship between
perceived ease of use and behavior intention.
From the ANOVA table, the model is fit as the model is tested significant (p<.01)
with F=32.38. The regression tests had presented an inference with R square of .252.
Approximately 25.2% variations of behavior intention were caused by perceived ease of
use. The adjusted R2 value is .252.
The Durbin-Watson value 1.770 was confined to the acceptable range( 1.5 to 2.5).
It indicated that there was no autocorrelation of error terms. Multicollineraity problems
did not exist as the variance inflation factor (VIF) values were below 10 and the
condition indices were below the safety limit of 30.
The normality of the sample was demonstrated by a bell shape histogram.
Diagnosis of the scatter plots showed homoscedasticity (constant variance of error term).
P-P plots also indicated no sign of normality of the error. No clear relationship between
the residuals and the predicted values confirmed the assumption of linearity.
The tested variable is very significant at p<.01- a 99% degree of confidence. The
beta value for perceived ease of use was (β =.502). The second stage tested hypotheses 7.
Hypotheses 7 (perceived ease of use is positively related to behavior intention) was
accepted at p<.01. Table 4.8, figure 4.2 and Appendix H list the result of multiple
regression 2.
52
Table 4.8 Result of Multiple Regression 2 Variable Standardized beta
Perceived Ease of Use .502***
F 32.38
R2 .252
Adjusted R2 .244
Note ***p<.01,*p<.05,*p<.10
Note***p<.01, **p<.05,*p<.10
Figure 4.2. Result of Multiple Regression 2
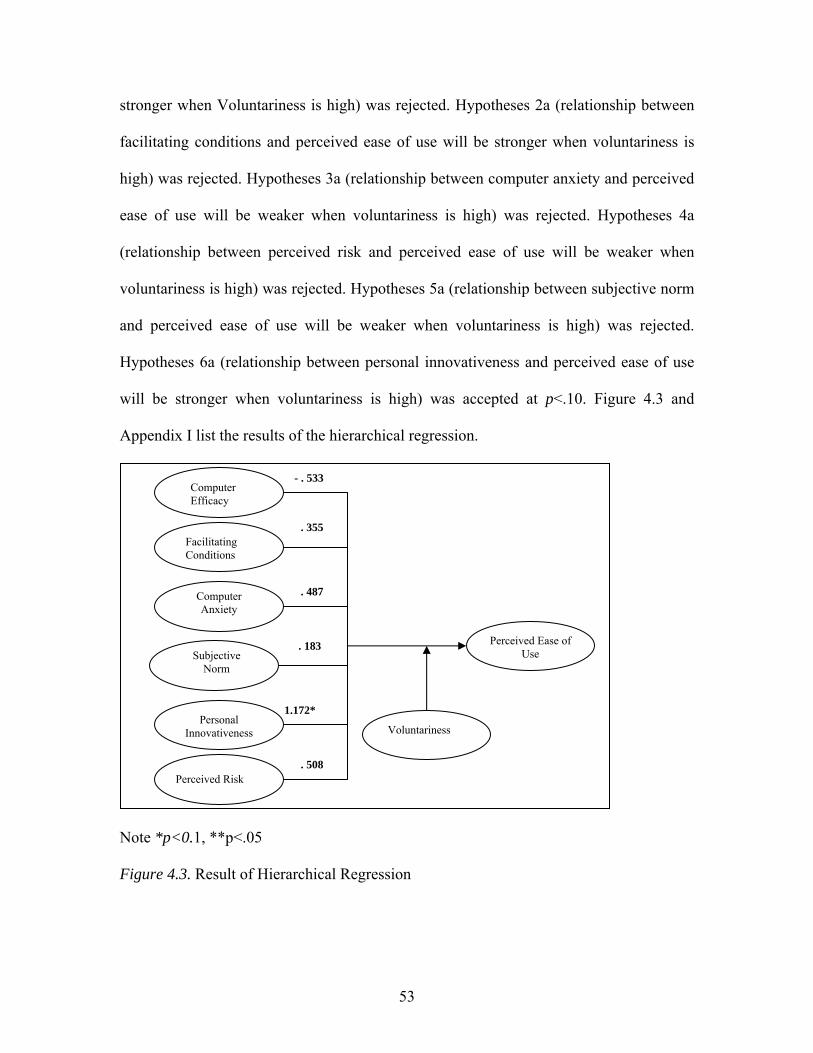
4.4.4 Hierarchical Regression
The hierarchical regression analysis indicated that personal innovativeness was
significant at p< .10 - a 90% degree of confidence. The beta value (standardize
coefficients) of personal innovativeness (β=1.172) indicates that relationship between
these variables and perceived ease of use will be stronger when voluntariness is high.
This shows evidence that voluntariness moderates the relationship between personal
innovativeness to perceived ease of use.
The hierarchical regression tested hypotheses 1a, 2a, 3a, 4a, 5a, and 6a.
Hypotheses 1a (relationship between self efficacy and perceived ease of use will be
Behavior Intention Perceived Ease of Use
.502***
53
stronger when Voluntariness is high) was rejected. Hypotheses 2a (relationship between
facilitating conditions and perceived ease of use will be stronger when voluntariness is
high) was rejected. Hypotheses 3a (relationship between computer anxiety and perceived
ease of use will be weaker when voluntariness is high) was rejected. Hypotheses 4a
(relationship between perceived risk and perceived ease of use will be weaker when
voluntariness is high) was rejected. Hypotheses 5a (relationship between subjective norm
and perceived ease of use will be weaker when voluntariness is high) was rejected.
Hypotheses 6a (relationship between personal innovativeness and perceived ease of use
will be stronger when voluntariness is high) was accepted at p<.10. Figure 4.3 and
Appendix I list the results of the hierarchical regression.
Note *p<0.1, **p<.05
Figure 4.3. Result of Hierarchical Regression
Perceived Ease of Use
Computer Efficacy
Facilitating Conditions
Computer Anxiety
Subjective Norm
Personal Innovativeness
. 183
- . 533
. 355
. 487
1.172*
. 508 Perceived Risk
Voluntariness

54
Table 4.9 Hierarchical Regression using voluntariness as a moderator in the relationship between model variables and perceived ease of use Independent variable
Std beta Model 1
Std beta Model 2
Std beta Model 3
Perceived Risk .066 .074 -.395 Subjective Norm .226 .212 .062 Computer Anxiety -.202 -.202 -.587 Computer Efficacy .511 .503 .748 Facilitating cond. .272 .273 -.101 Personal Innovative .156 .149 -.549 Moderating Variable
Voluntariness - .039 -1.147 Interaction Terms Vol_PRSK - - .508 Vol_SNOM - - .183 Vol_CANX - - .487 Vol_CEFF - - -.533 Vol_FCON - - .355 Vol_PINN - - 1.172* R2 .458 .459 .509 Adjusted R2 .423 .417 .434 R2 Change .458 .001 .050 Sig.F change .000 .690 .203 Note ***p<.01,*p<.05,*p<.10
As seen from Table 4.7, the R2 of the model increases to 50.8% when
voluntariness is included as a moderator in model.
The influence of personal innovativeness on perceived ease of use is stronger when
voluntariness is high. Therefore, voluntariness moderates the relationship between
personal innovativeness and perceived ease of use. The moderating effect of
voluntariness is further elaborated in Figure 4.4.

55
HighLow
Personal Innovativeness Level
3.60
3.50
3.40
3.30
3.20
3.10
3.00
2.90
2.80
Mea
n Pe
rcei
ved
Ease
of U
seLowHigh
VoluntarinessLevel
Figure 4.4. Moderating effect of Voluntariness on personal innovativeness
4.5 Summary of Results
Table 4.10 Summary of Hypotheses testing
Hypotheses Descriptions Result (Accept or Reject)
β value
H1 Computer self efficacy will be positively related to ease of use.
Accepted β=.500
H1a The relationship between self efficacy and perceived ease of use will be stronger when Voluntariness is high.
Rejected, Not Significant
β=−.533
H2 Facilitating conditions is positively related to perceived ease of use.
Accepted β=.272
H2a The relationship between facilitating conditions and perceived ease of use will be stronger when voluntariness is high
Rejected, Not Significant
β=.355
56
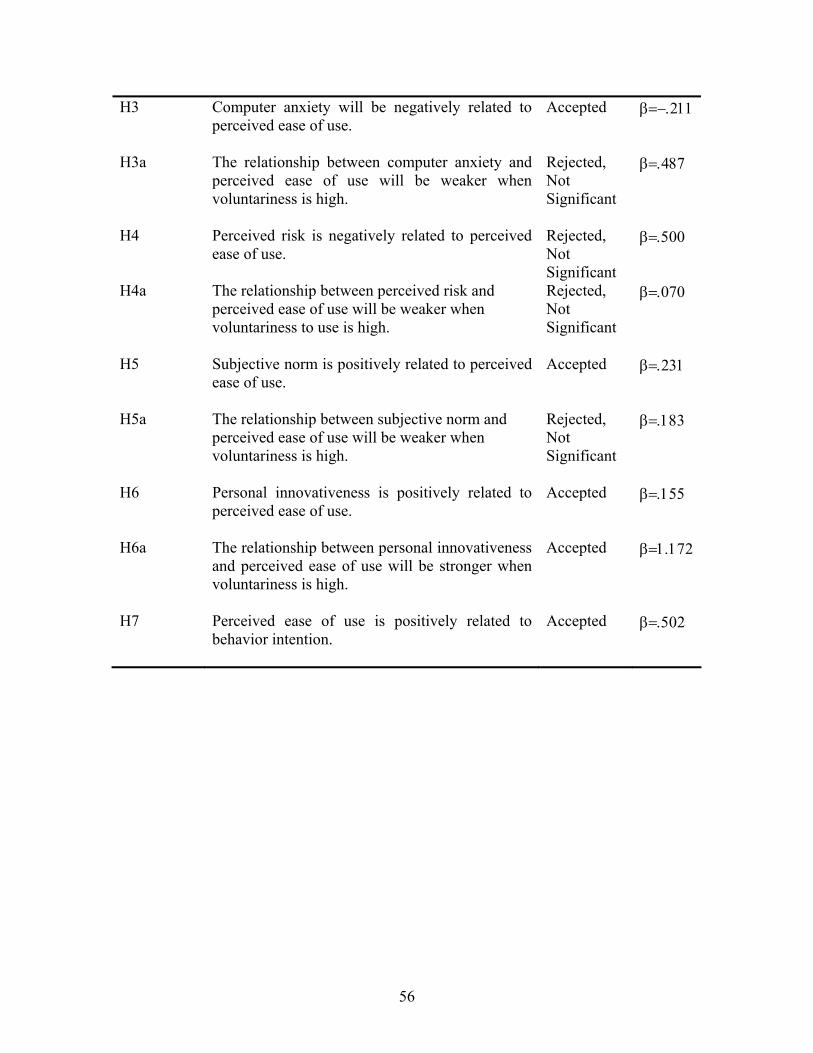
H3 Computer anxiety will be negatively related to perceived ease of use.
Accepted β=−.211
H3a The relationship between computer anxiety and perceived ease of use will be weaker when voluntariness is high.
Rejected, Not Significant
β=.487
H4 Perceived risk is negatively related to perceived ease of use.
Rejected, Not Significant
β=.500
H4a The relationship between perceived risk and perceived ease of use will be weaker when voluntariness to use is high.
Rejected, Not Significant
β=.070
H5 Subjective norm is positively related to perceived ease of use.
Accepted β=.231
H5a The relationship between subjective norm and perceived ease of use will be weaker when voluntariness is high.
Rejected, Not Significant
β=.183
H6 Personal innovativeness is positively related to perceived ease of use.
Accepted β=.155
H6a The relationship between personal innovativeness and perceived ease of use will be stronger when voluntariness is high.
Accepted β=1.172
H7 Perceived ease of use is positively related to behavior intention.
Accepted β=.502
57
Chapter 5
DISCUSSION AND CONCLUSION
5.1 Introduction
This chapter discusses the statistical results in Chapter 4. It recapitulates the study and
discusses the major findings in the later section. Implication and limitation of the study
will be discussed and suggestion for the research will be highlighted for future use.
5.2 Recapitulation of the Study
This study aims to understand why intention to use e-filing is still low in Malaysia. There
is dire need to understand how to increase intention to use e-filing among tax-payers in
Malaysia. In order to substantiate the research problem, six independent variables –
computer self-efficacy, facilitating conditions, computer anxiety, perceived risk,
subjective norm, personal innovativeness were chosen and incorporated as determinants
of perceived ease of use in the Technology Acceptance Model (TAM). The findings of
the study will eventually answer the following questions:-
(1) What are the key determinants of perceived ease of use?
(2) Does voluntariness moderate the relationship between perceived ease of use and
behavior intention?
(3) Does perceived ease of use influence intention to use.
There were several hypotheses developed to test the relationship between the independent
variables and the dependant variable. The first set of hypotheses was developed to
identify the relationship between computer self-efficacy, facilitating conditions, computer
anxiety, perceived risk, subjective norm, personal innovativeness towards perceived ease
58
of use. The next set of hypotheses was developed to test the moderating role of
voluntariness in the above said relationship.
5.3 Discussions of Major Findings
The study has shown that computer self-efficacy has a strongest positive relationship with
perceived ease of use. Computer self-efficacy was the most salient determinant of
perceived ease of use. This is in line with the research conducted by Agarwal,
Sambamurty and Stair (2000), Venkatesh (2000), Chan and Lu (2004), Ramayah et al
(2004), Ramayah and Aafaqi (2004), Ramayah et al (2005); Hassan (2006) and Gopi
(2006). This indicates that as the tax payer’ self-efficacy increases, they will find it easy
to adopt and use e-Filing. This indicates that concise training provided by the government
or Lembaga Hasil Dalam Negara to the tax payers’ will definitely result in enhancing use
of e-Filing amongst tax payers’ in Malaysia.
Facilitating conditions also has strong positive relationship with perceived ease of
use. Although 88% of the respondents had computer and internet connection at work and
77% of the respondents had computer and internet connection at home, the respondents
think that more facilitating resources like computer and network connections will be a
key factor in influencing ease of using e-Filing. This is in sync with past literature that
found facilitating condition having a direct relationship on infusion and adoption of a
number of new information system innovation (Cheung & Chang, 2000; Jones,
Sundaraman & Chin, 2002; Yu,Lu and Liu, 2005; Gopi, 2006).Government could
provide provisional support to aid tax payers’ to own computers. The provisional support
59
could be in the form of tax exemptions or quick EPF withdrawal for the purpose of
purchasing computers.
Subjective norm also exhibited positive relationship with perceived ease of use.
Subjective norms’ influence in past literature has in certain times shown significant
influence in new technology adoption and in other times not. These literatures have been
cited in detail in chapter 2. In this study, subjective norm has shown a strong influence on
perceived ease of use. This could be due to the fact that e-Filing is a very new
implementation at this moment. At the initial stage the respondents may not be confident
of their own point of view and would be easily influenced by the friends and colleagues
who may have used e-Filing. The influence of subjective norm may diminish over time as
knowledge on e-Filing increases and users are more confident of their own point of view.
Computer anxiety showed negative influence on perceived ease of use. This is in
line with past research which has show that computer anxiety has a negative impact on
constructs like perceived ease of use (Venkatesh, 2000), computer use (Igbaria &
Parasuraman, 1989), computing skills (Harrison & Rainer,1992) affect towards computer
(Compeau & Higgins, 1995) and general and specific computer self efficacy on computer
training outcomes(Hassan, 2006). Providing training and coaching for tax payers’ with
less cognitive capacity would be one of the solutions to encourage use of
e-Filing.
Personal innovativeness is positively related to perceived ease of use. This echoes
the findings of by Agarwal, Lewis and Sambamurty (2003) where technology was found
to have a positive influence on beliefs on ease of use of the technology in the study on
information technology us among knowledge workers. Voluntariness was found to

60
moderate the relationship where, the relationship between personal innovativeness and
perceived ease of use will be stronger when voluntariness is high.
Perceived ease of use positively influenced behavior intention. Past research by Hong et
al (2001), Gefen et al (2003), Heijden (2003), Venkatesh et al (2003) and Heijden (2003)
also found perceived ease of use to influence behavior intention.
Perceived risk was not an important factor to influence tax payers. These finding
were similar in nature with the research of Gopi (2006) where perceived risk was also
found not to be an important factor to influence users of internet stock trading. The
successful proliferation of internet banking the 21st century may have played a part in
giving users confidence that the security of internet based transactions in Malaysia is
save.
The regression tests had presented a strong inference with R square of .458.
Approximately 45.8% variations of perceived ease of use to use e-Filing can be explained
by self-efficacy, facilitating conditions, computer anxiety, subjective norm, personal
innovativeness.
5.4 Implications
The implication of this study must be examined in a managerial and policy perspective to
form effective strategies to encourage usage of e-Filing among Malaysian tax payers.
5.4.2 Managerial Implications
13% of the respondents had used e-Filing in year 2006. 63% of the respondents have
plans to switch to e-Filing in year 2007. This indicates that with careful strategy

61
implementation by the government, e-Filing could be successfully introduced in
Malaysia.
The basic barriers that have stopped respondents from using e-Filing in year 2006 was:
(1) 50% of the respondent stated that having to queue at the Lembaga Hasil office to
get the 16 digit pin number was the reason they had put off using e-Filing this
year. This process is still very much manual.
(2) Not having step by step explanation on how to use e-Filing also was another
reason.
(3) A number of respondents have indicated they were skeptical of the privacy of the
website. However, perceived risk was found not influencing ease of use in this
study.
These barriers can be overcome by allowing application of secure pin number online. The
system used by banks to provide pin numbers to credit cards users could be adopted here.
The findings of this study has indicated computer self efficacy and computer
anxiety as significant factors influencing perceived ease of use. As suggested earlier,
focal training at work place, road shows on how to use e-Filing and a step by step
procedure to use e-Filing could be sent to all tax payers in the country.
Subjective norm was an important factor influencing ease of use. In the early
stages of introducing e-Filing, the managerial team may want to think along the lines of
media endorsement by respected leaders or celebrities to encourage tax payers’ to adopt
e-Filing.
Governments could provide provisional support to aid tax payers’ to own
computers. The provisional support could be in the form of tax exemptions or quick EPF
62
withdrawal for the purpose of purchasing computers. Another important factor would be
to provide reasonable rates for broadband network connections for home users. This
would allow more tax payers to adopt e-Filing.
5.5 Limitations
Despite the useful findings of this study, this empirical study has several limitations that
needs o be acknowledged.
Firstly, the findings cannot be generalized extensively in Malaysia, as the scope of the
study is confined to the state of Penang, therefore caution may be needed before
generalizing the findings to the whole country.
Secondly, the findings in this study depend on the honesty of the respondents. It is
known individuals would agree more on socially desirable answers and disagree more
towards socially undesirable answers rather than fully and truly express the feeling and
opinions.
Thirdly, due to time and resource constraints the study is limited as it consists of a
small sample size of (100) respondents.
Fourthly, the opinion of Lembaga Hasil Dalam Negara could not be incorporated
in this study. The approval process with Lembaga Hasil Dalam Negara was rather lengthy
requiring a few trip to Kuala Lumpur for permission request. In view of the limited time
and resources the formal opinions of Lembaga Hasil Dalam Negara was not included in
this study. However, valuable informal opinions and suggestions by staffs of Lembaga
Hasil Dalam Negeri, Penang was incorporated in this study.
Fifthly, this model accounted for 45.8% of the variance indicating variables other
than those examined are needed to explain additional variance

63
5.6 Future Research
(1) Future research can expand this study to include the effect of time and experience
on the adoption of e-Filing in Malaysia.
(2) Improving the model by incorporating other relevant independent variables and
dependant variables based on new findings from latest literatures at the time.
(3) Further research is needed to determine whether this study can be replicated in
other e-government services.
(4) Lembaga Hasil Dalam Negara could formally be involved in future research to
enable a nationwide survey to be conducted which provides a better
representation of the population and a larger sample size.
5.7 Conclusion
The findings of the research conclude computer self-efficacy, computer anxiety,
subjective norm, facilitating conditions and personal innovativeness are determinants of
perceived ease of using e-Filing. Perceived ease of use is found to be significant in
affecting users’ behavioral intention in using e-Filing in Malaysia.
The findings provided by the study may give empirically justified foundation
for the government to develop strategies for encouraging the adoption of e-Filing. By
understanding the determinants of perceived ease of use of using e-Filing, appropriate
actions can be taken to increase the acceptance of e-Filing in Malaysia.
Continued research is needed to improve this study and to address the limitation
of the present study. As such, it is hoped that this study will give a preliminary insight
and understanding on the tax payers’ acceptance of e-Filing. The present study has
profiled a tax payer willing to use e-Filing and an individual who has positive attitude

64
towards e-Filing, wants to comply with other important people’s opinion on the use of e-
Filing, and has the requisite resources, skills or opportunities.
65
References
Agarwal, R., & Prasad, J. (1998). The Antecedents and Consequences of User Perceptions in Information Technology Adoption, Decision Support System (22:1), pp 15-29.
Agarwal, R. & Prasad, J. (1999). Are individual differences germane to the acceptance of
new technologies? Decision Sciences. Vol. 30 No. 2, pp. 361-391. Agarwal, R., Sambamurthy, V., & Stair, R.M. (2000). Research report: The evolving
relationship between general and specific computer self-efficacy – an empirical assessment. Information System Research, 11(4), 418-430.
Agarwal, R., Lewis,W., & Sambamurthy, V., (2003). Sources of influence on beliefs
about information technology use: An empirical study of knowledge workers. MIS Quarterly,27, 667
Ajzen, I. (1991). The theory of planned behavior. Organizational Behavior and Human
Decision Processes, 50, 179-211. Amirtham,V.,(2006).Factors influencing training at Olympia College. MBA Thesis,
School of Management, University Sains Malaysia, Penang. Bakri, H., & Hartwick, J.,(1994). Measuring User Participation, Use Involvement, and
User Attitude, MIS Quarterly (18:1), pp 59-82. Badri ,M., et al., 1995, A study of measuring the critical factors of quality management.
International of Quality and Reliability Management 2(2), 36-53 Bobbitt, M.L., & Dabholkar, P.A. (2001). Integrating attitudinal theories to understand
and predict use of technology-based self-service. International Journal of Science Industry Management, 12(5), 423-450.
Bassam H., (2006). Effectiveness of computer training:. The role of multilevel computer
self-efficacy. Journal of Organizational and End User Computing,18(1),50 Bhimani, A. (1996). Securing the Commercial Internet. Communications of the ACM.
New York, 39(6), 29-34. Chan, S.C., & Lu, M.T. (2004). Understanding Internet banking adoption and user
behavior: A Hong Kong perspective. Journal of Global Information Management, 12(3),21-43.
Chau, P.Y.K.,& Hu, P.J.H. (2001). Information technology acceptance by individual
professionals: A model comparison approach. Decision Science, 32(4), 699-719.
66
Chen, L.D., Gillenson, M.L., & Sherrel, D.L. (2002). Enticing online consumers: An extended technology acceptance perspective. Information and Management, 39, 705-719.
Cheung, W. & M.K. Chang. (2000). Prediction of Internet and World Wide Web Usage at Work: A Test of an Extended Triandis Model, Decision Support Systems, 30:1, pp. 83-101.
Christian,W., Karen, L., Fion,L.,& Rachael,I. (2003). Enhancing E-government in
Developing Countries: Managing Knowledge through virtual communities. EJISDC (2003),14,4,1-20
Cockburn, C & Wilson, T.D. (1996) Business Use of the World-Wide Web. International
Journal of Information Management, 16(2), 83-102. Compeau, D.R., & Higgins, C.A. (1995). Application of social cognitive theory to
training for computer skills. Information Systems Research, 6(1), 118-143. Compeau, D.R., & Higgins, C.A. (1995b). Computer self-efficacy: development of a
measure and initial test, MIS Quarterly (19:2) pp 189-211 Davis, D. F. (1989). Perceived usefulness, perceived ease of use and user acceptance of
Information Technology. MIS Quarterly,13, 319-340 Davis, D. F., Bagozzi., P, R., & Warsaw, R. P. (1989). User Acceptance of computer
technology a comparison of two theoretical models. Management Science,35, 982-1003
Davis, F.D (1986). A technology acceptance model empirical testing new end-user
information systems: Theory and results. Doctoral dissertation, Sloan School of Management, Massachusetts Institute of Technology.
Dowling, G.R., & Staelin, R. (1994). A model of perceived risk and intended risk
handling activity. Journal of Consumer Research , 21, 119-134 Eri, Y., and Ramayah, T, (2005). Using TAM to explain intention to shop online among
university students, IAMOT 14th International Conference on Management of Technology, Vienna, Austria.
Elasmar, M.G and Carter, M.E. (1996). Use of e-mail by college students and
implications for curriculum. Journal of Mass Communication Educator, 51, 46-54 Frambach, R.T. (1993). An Integrated Model of Organizational Adoption and Diffusion
of Innovations. European Journal of Marketing, 27(5), 22-41.

67
Frambach, R.T. (1995). Diffusion of Innovations in Business –To-Business Markets, Product Development: Meeting the Challenge of the Design-Marketing Interface, John Wiley and Sons Ltd., 249-245
Featherman, M.S. (2001). Extending the technology acceptance model by inclusion of
perceived risk. Proceedings of the Seventh Americans Conference on Information Systems, 758-760.
Fishbein, M., & Ajzen, I. (1975). Belief, attitude, intention. and behavior: An
introduction to theory and research. Reading, MA: Addison-Wesley. Forrester Research Inc., April (2001). eFiling Kick-Starts Government. Fu, J.R., Fan, C.K & Chao. W.P. (2006). Acceptance of electronic tax filing: A study of
tax payers intentions. Journal of Information & Management,43,109-126. Gefen, D., Straub, D.W. and Karahana, E. (2003). Trust and TAM in online shopping: An
integrated model. MIS Quarterly,27, 51-90. Gopi, M.,(2006).Factors influencing user acceptance of internet stock trading in Penang.
MBA Thesis, School of Management, University Sains Malaysia, Penang. Gillooly,C.(1998). Disillusionment. Information Week 669, 46-51 Hair, J.F., Anderson, R.E., Tatham, R.L., & Black, B.C. (1998). Multivariate data
analysis, 5th ed., The Prentice-Hall International, Eaglewood Chiffs.NJ. Harrison, A.W., and Rainer,R.K. (1992). The influence of individual differences on skill
in end-user computing. Journal of Information & Management,9(1),93-111. Heijden, H., Verhage, T., & Creemers, M. (2003). Understanding online purchase
intentions. Contributions from technology and trust perspective. European Journal of Information System, 12, 41-48.
Hong, W., Thong, J.,Wong, W. and Tam, K.Y. (2001). Determinants of user acceptance
of digital libraries: an empirical examination of individual differences and system characteristics. Journal of Management Information Systems, 18, pp. 97-125.
Iqbaria, M., Parasuraman, S., & Baroudi, J.J. (1996). A motivational model of computer
usage, Journal of Management Information System (13:1) , p 127. Jarvenpaa, SL., & Todd, P.A. (1997). Consumer reactions to electronic shopping in the
World Wide Web. International Journal of Electronic Commerce, 1(2), 59-88. Jiang, J.J., M.K. Hus, G. Klien, & B. Lin.(2000). E-commerce User Behavior Model: An
Empirical Study, Human System Management, 19:4, pp. 265-276.
68
Jones, E., S. Sundaram., & W. Chin. Factors Leading to Sales Force Automation Use: A
Longitudinal Analysis, Journal of Personal Selling & Sales Management, 22:3 Summer 2002, pp. 145-157
Karahana, E., & Limayen, M. (2000). Email and Vmail Usage: Generalising Across
Technologies, Journal of Organizational Computing and Electronic Commerce, 10(1), 49-66.
Kidwell, B.,& Jewel, R.D. (2003). An examination of perceived behavioral control:
Internal and external influences on intention. Psychology and Marketing, 20(7), 625-642
King, R.T.(1994). California DMV’s computer overhaul ends up as costly ride to junk
heap. Wall Street Journal, New York, Apr. 27 Lee,B.L.,(2005).Factors influencing email usage: Applying the UTAUT model. MBA
Thesis, School of Management, University Sains Malaysia, Penang. Lee, D., Park, J., & Ahn, J. (2001). On the explanation of factors affecting e-commerce
adoption. Twenty-Second International Conference on Information Systems, 109-120.
Lee, J.E,. & Ho, P.S. (2002). A retail Investor’s perspective on the acceptance if Internet
stock trading. Proceedings of the 36th HICSS, 1-11. Lewis, W., Agarwal. R., & Sambamurthy, V. (2003). Sources of influence on beliefs
about information technology use: An empirical study of knowledge workers. MIS Quarterly, 27(4), 657-678.
Liu, X., & Wei, K.K. (2003). An empirical study of product differences in consumers’ e-
commerce adoption behavior. Electronic Commerce Research and Applications, 2, 229-239.
Lu,J., Liu, C., & Yu, C.S. (2005).Facilitating conditions, wireless trust and adoption
intention. The Journal of Computer Information Systems.46 (1),17. Lucas, H.C., & Spitler, V.K.(1999) .Technology use and performance: A field study of
broker workstations,” Decision Sciences (30:2) , pp 91-231. Mathieson, K. (1991). Predicting user intention: Comparing the technology acceptance
model with the theory of planned behavior. Information System Research, 2(3), 173-191.

69
Mathieson, K., Peacock, E., & Chin, W.W. (2001). Extending the technology acceptances model: The influence of perceived user resources, Database for Advances in Information Systems (32:3) , p 86.
May, O.S. (2005). User Acceptance of Internet Banking in Penang: A model Comparison
Approach, MBA Thesis, School of Management, University Sains Malaysia, Penang.
McCaroll, T. (1991). What new age? Time 138, 44-46 Moore, G.C. & Benbasat, L. (1991). Development of an instrument to measure the
perception of adoption in information technology innovation, Information System Research, Vol. 2 No. 3, pp. 192-222
Morris, M.G., & Venkatesh, V. Age-Diffrences in Technology Adoption Decision –
Implication for a Changing Work-Force, Personnel Psychology (53:2) 200, pp 375-403.
M.W.Darrell, Global e-Government, 2005. Available at
http://www.insidepolitics.org/egovtdata.html, May 16, 2006 Ndubisi, N.O., Gupta, OK., & Ndubisi, G.C. (2005). The moguls’ model of computing:
integrating the moderating impact of users’ persona into the technology acceptance model. Journal of Global Information Technology Management, Mariette, 8(1), pp. 27-47.
Nunnally, J.C., & Bernstein, I.H (1994). Psychometric theory. New York: McGraw Hill. Ramayah, T., Dahlan, N., Teck, T.K., & Aafaqi, B. (2003). Perceived web security and
web-based online transaction intent. Multimedia Cyberspape Journal (MMCJ), Vol. 1.
Ramayah, T., Zainudin, Y., & Youn, F.C. (2003). The effect of self-efficacy on internet
usage in the organization. . Jurnal ANALISIS, 10(2), 187-220. Ramayah, T., Aafaqi, B., & Ignatius, J. (2004). Role of self-efficacy in e-library usage
among students of a public university in Malaysia. Malaysian journal of Library & Information Science, 9(1),pp.39-57.
Ramayah, T., Ignatius, J., & Aafaqi, B.(2005). PC usage among students in a private
institution of higher learning: The moderating role of prior experience. Educators and Education Journal, 2005.
Ramayah, T., (2006a). Doing e-Research with e-Library. The International Journal of
Technology Knowledge & Society,(1)

70
Ramayah, T., (2006b).Interface characteristics, perceived ease of use and intention to use an online library in Malaysia. Information Development,22,(2),123-133
Rogers,E.M.,(1995). Diffusion of Innovations. Free Press, New York Sekaran, U. (2003). Research methods for business: A skill building approach. John
Wiley & Sons Publications Sun, H.,& Zhang,P.(2004). The role of moderating factors in user technology acceptance.
International Journal of Human Studies(IJHCS) Simonson, M.R., Maurer, M., Montag-Torardi, M., Whitaker,M.,(1987). Development of
a standardized test of computer literacy and a computer anxiety index, Journal of Educational Computing Research 3 (2) 231-247.
Taylor, S & Todd, P.(1995). Understanding the information technology usage: A test of
competing models. Information Systems Research, 6(2), 144-176. Teo,T.S.H, Lim, V.G.K., & Lai, R.Y.C. (1999). Intrinsic and extrinsic motivation in
Internet usage. Omega: The International Journal of Management Science,27,25-37
Thatcher, B. J., & Perrewe, L. P. (2002). An empirical examination of individual traits as
antecedents to computer self-efficacy. MIS Quarterly,26, 381-396 The Star, (2002a). Malaysia sees growth in e-government usage, Business, 12 November,
p.11 The Star, (2006a). IRB won’t send out the tax forms from next year, Nation, 1 May, p.1 The Sun, (2006a). eFiling digital certificate, 19 April. p.5 Triandis, H.C. (1977). Interpersonal behavior. Monetary, C.A: Brooks/Cole Venkatesh, V. (2000). Determinants of perceived ease of use: integrating control,
intrinsic motivation, and emotion into the Technology Acceptance Model. International Systems Research, 11, 342-365
Venkatesh, V., & Davis, F.D. (2000). A theoretical expansion of the technology
acceptance model: Four Longitudinal field studies. Management Science, 46(2), 186-204.
Venkatesh, V., & Davis, F.D. (1996).A Model of the Antecedents of Perceived Ease of
Use: Development and Test,” Decision Science (27:3) 1996, pp 451-481.

71
Venkatesh, V., Morris, G. M., Davis, B. G., & Davis, D. F. (2003).User acceptance of information technology: toward a unified view. MIS Quarterly, 27, 425-478.
Zikmund, G. W. (2003). Business Research Methods. Thomson Publications.
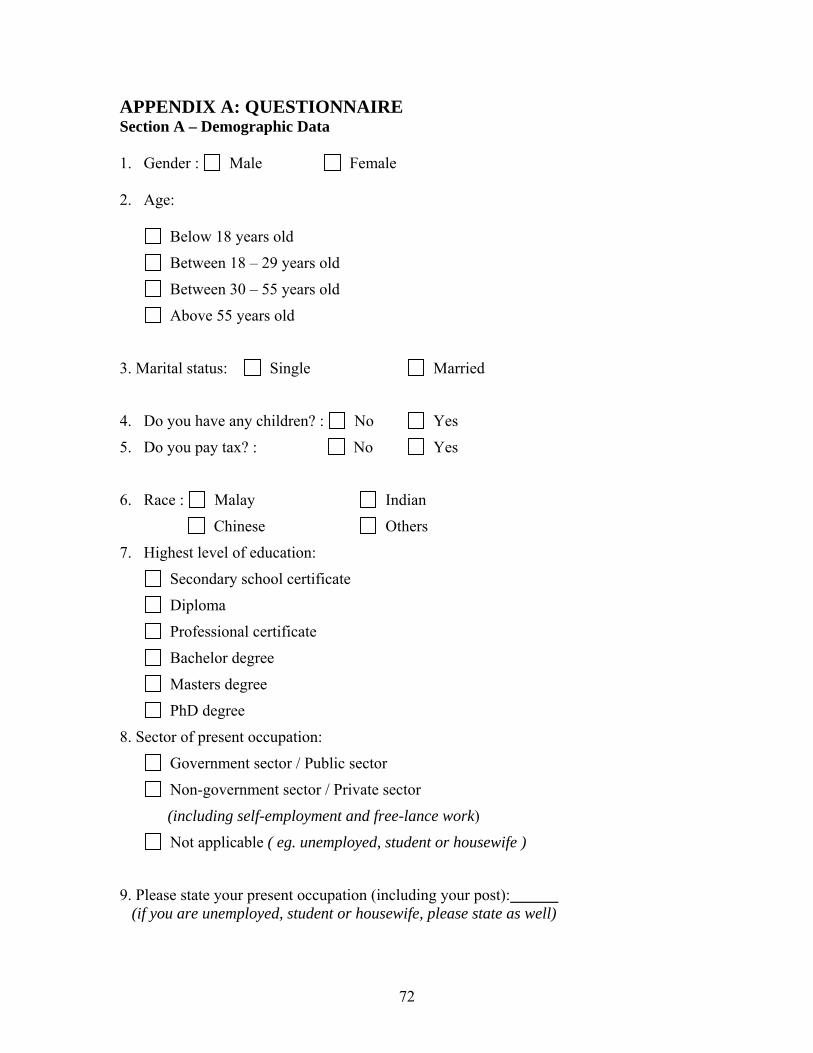
72
APPENDIX A: QUESTIONNAIRE Section A – Demographic Data
1. Gender : Male Female 2. Age:
Below 18 years old
Between 18 – 29 years old
Between 30 – 55 years old
Above 55 years old
3. Marital status: Single Married
4. Do you have any children? : No Yes
5. Do you pay tax? : No Yes
6. Race : Malay Indian
Chinese Others
7. Highest level of education:
Secondary school certificate
Diploma
Professional certificate
Bachelor degree
Masters degree
PhD degree
8. Sector of present occupation:
Government sector / Public sector
Non-government sector / Private sector
(including self-employment and free-lance work)
Not applicable ( eg. unemployed, student or housewife )
9. Please state your present occupation (including your post): (if you are unemployed, student or housewife, please state as well)
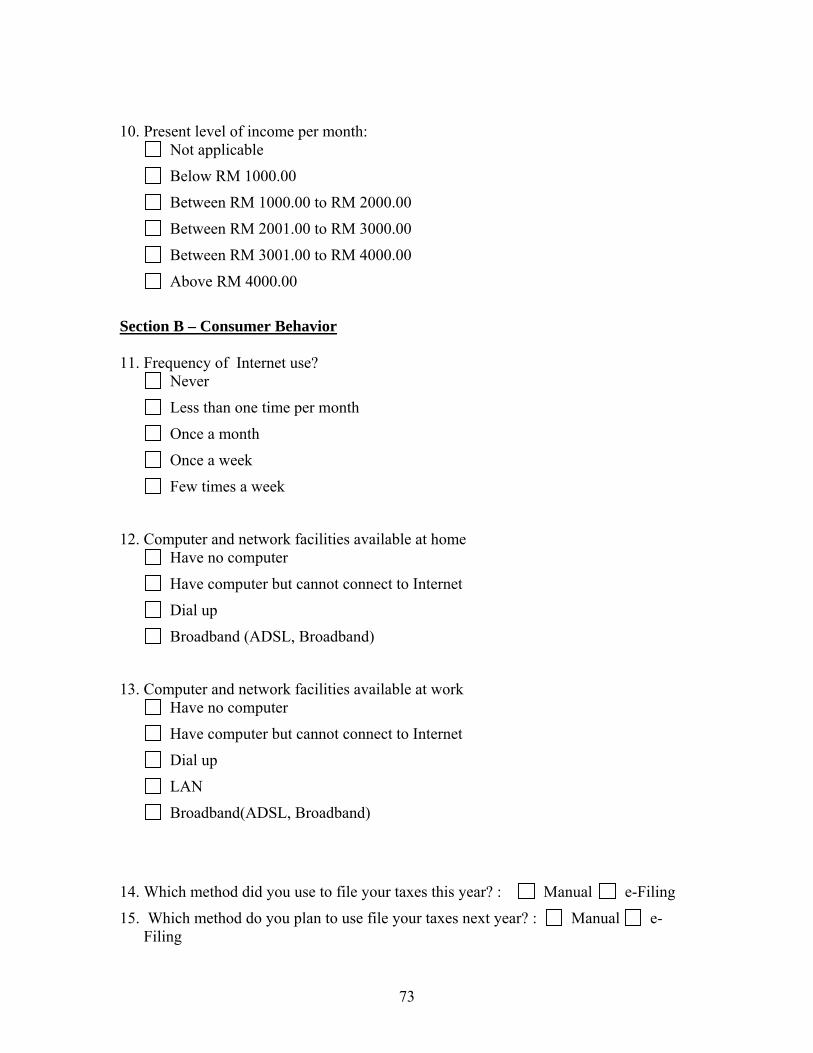
73
10. Present level of income per month: Not applicable
Below RM 1000.00
Between RM 1000.00 to RM 2000.00
Between RM 2001.00 to RM 3000.00
Between RM 3001.00 to RM 4000.00
Above RM 4000.00
Section B – Consumer Behavior
11. Frequency of Internet use?
Never
Less than one time per month
Once a month
Once a week
Few times a week
12. Computer and network facilities available at home Have no computer
Have computer but cannot connect to Internet
Dial up
Broadband (ADSL, Broadband)
13. Computer and network facilities available at work Have no computer
Have computer but cannot connect to Internet
Dial up
LAN
Broadband(ADSL, Broadband)
14. Which method did you use to file your taxes this year? : Manual e-Filing
15. Which method do you plan to use file your taxes next year? : Manual e-Filing
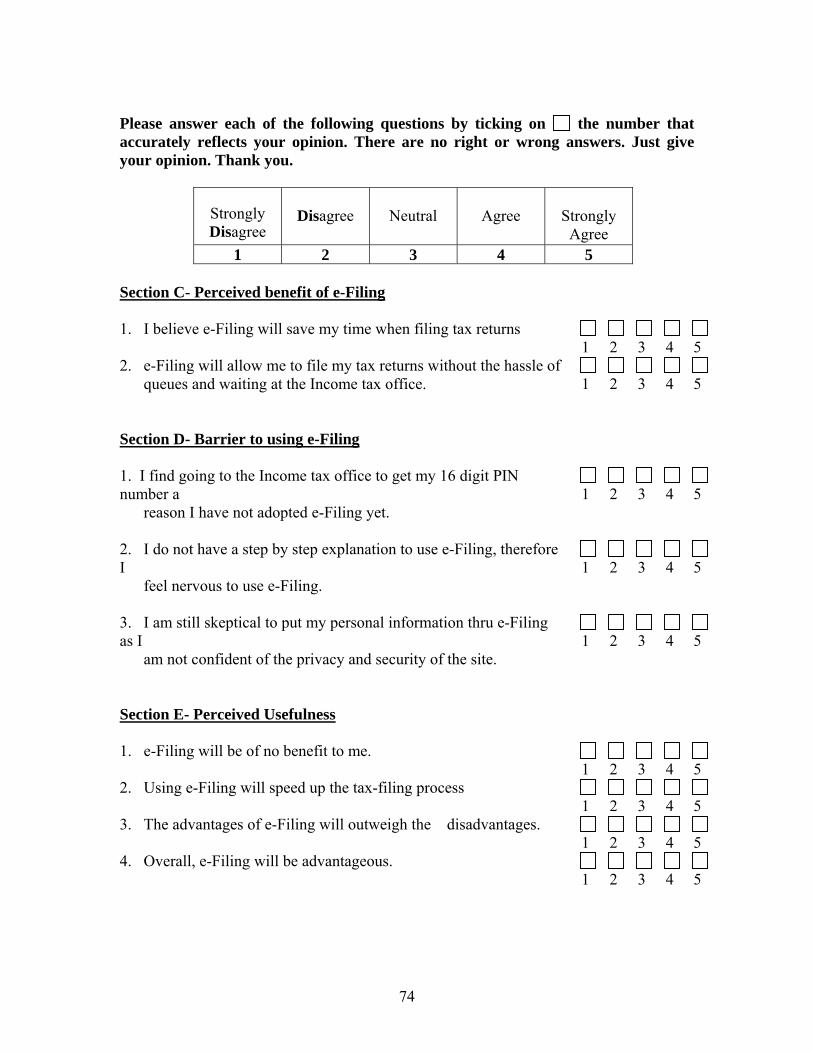
74
Please answer each of the following questions by ticking on the number that accurately reflects your opinion. There are no right or wrong answers. Just give your opinion. Thank you.
Strongly Disagree
Disagree
Neutral
Agree
Strongly Agree
1 2 3 4 5 Section C- Perceived benefit of e-Filing 1. I believe e-Filing will save my time when filing tax returns
1 2 3 4 5 2. e-Filing will allow me to file my tax returns without the hassle of
queues and waiting at the Income tax office.
1 2 3 4 5
Section D- Barrier to using e-Filing 1. I find going to the Income tax office to get my 16 digit PIN number a reason I have not adopted e-Filing yet.
1 2 3 4 5
2. I do not have a step by step explanation to use e-Filing, therefore I feel nervous to use e-Filing.
1 2 3 4 5
3. I am still skeptical to put my personal information thru e-Filing as I am not confident of the privacy and security of the site.
1 2 3 4 5
Section E- Perceived Usefulness 1. e-Filing will be of no benefit to me.
1 2 3 4 5 2. Using e-Filing will speed up the tax-filing process 1 2 3 4 5 3. The advantages of e-Filing will outweigh the disadvantages. 1 2 3 4 5 4. Overall, e-Filing will be advantageous. 1 2 3 4 5
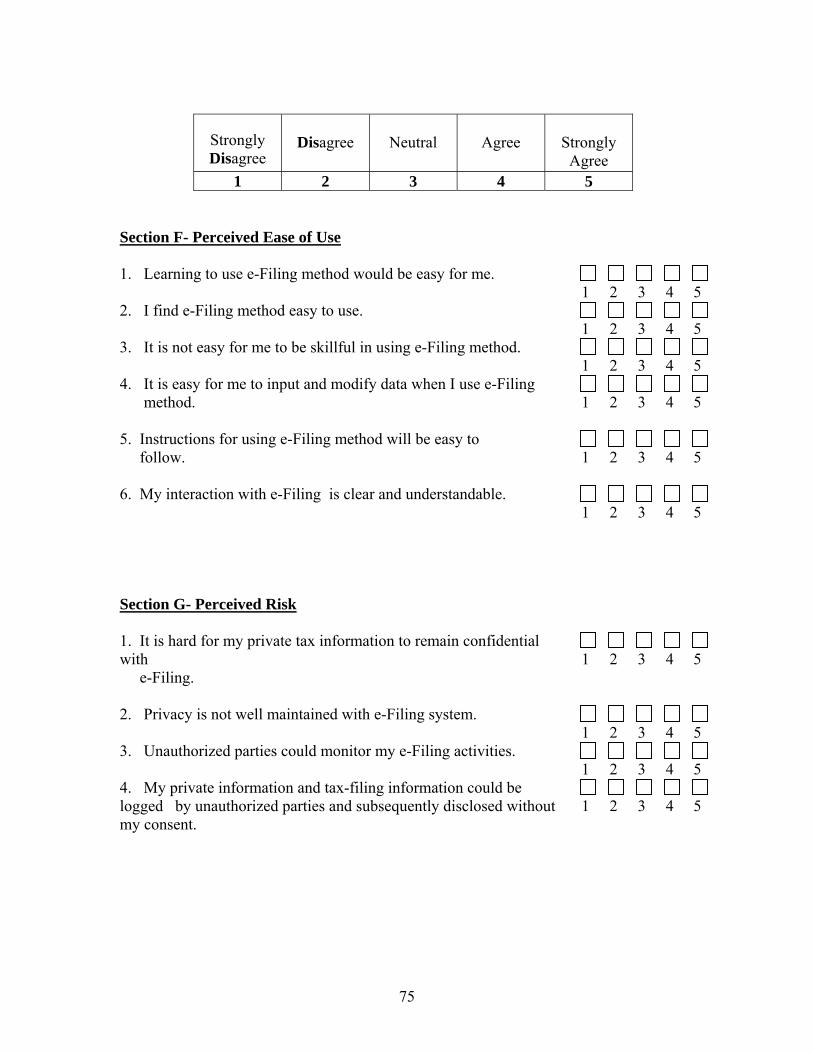
75
Strongly Disagree
Disagree
Neutral
Agree
Strongly Agree
1 2 3 4 5 Section F- Perceived Ease of Use 1. Learning to use e-Filing method would be easy for me.
1 2 3 4 5 2. I find e-Filing method easy to use. 1 2 3 4 5 3. It is not easy for me to be skillful in using e-Filing method. 1 2 3 4 5 4. It is easy for me to input and modify data when I use e-Filing method.
1 2 3 4 5
5. Instructions for using e-Filing method will be easy to follow.
1 2 3 4 5
6. My interaction with e-Filing is clear and understandable. 1 2 3 4 5
Section G- Perceived Risk 1. It is hard for my private tax information to remain confidential with e-Filing.
1 2 3 4 5
2. Privacy is not well maintained with e-Filing system. 1 2 3 4 5 3. Unauthorized parties could monitor my e-Filing activities. 1 2 3 4 5 4. My private information and tax-filing information could be logged by unauthorized parties and subsequently disclosed without my consent.
1 2 3 4 5

76
Section H– Subjective Norms
1. Most people I know use e-Filing.
1 2 3 4 5 2. People who are important to me would think I should choose e-Filing.
1 2 3 4 5
3. People who influence my behavior would approve that I choose e-Filing.
1 2 3 4 5
Strongly Disagree
Disagree
Neutral
Agree
Strongly Agree
1 2 3 4 5 Section I– Computer Anxiety 1. I feel apprehensive about the thought of using a computer to do
my e-Filing
1
2
3
4
5
2. I hesitate to use a computer for fear of making mistakes in my e-Filing that I cannot correct.
1 2 3 4 5
3. I find using a computer to do my e-Filing somewhat intimidating. 1 2 3 4 5
Section J – Computer Efficacy 1. I would feel comfortable doing the Internet e-Filing on my own.
1
2
3
4
5 2. If I wanted to, I could easily operate any of the equipment to use the
e-Filing on my own.
1 2 3 4 5
3. I would be able to use the e-Filing method even is there was no one around to show me how to use it.
1 2 3 4 5
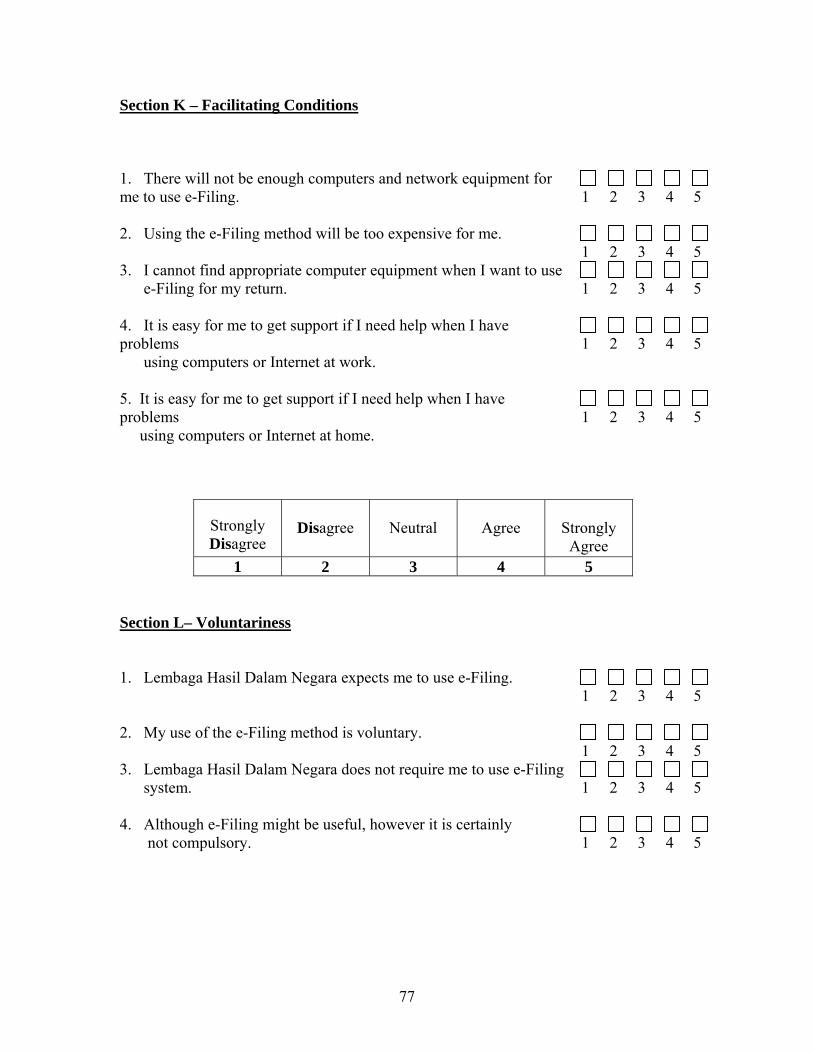
77
Section K – Facilitating Conditions
1. There will not be enough computers and network equipment for me to use e-Filing.
1 2 3 4 5
2. Using the e-Filing method will be too expensive for me. 1 2 3 4 5 3. I cannot find appropriate computer equipment when I want to use e-Filing for my return.
1 2 3 4 5
4. It is easy for me to get support if I need help when I have problems using computers or Internet at work.
1 2 3 4 5
5. It is easy for me to get support if I need help when I have problems using computers or Internet at home.
1 2 3 4 5
Strongly Disagree
Disagree
Neutral
Agree
Strongly Agree
1 2 3 4 5 Section L– Voluntariness
1. Lembaga Hasil Dalam Negara expects me to use e-Filing.
1 2 3 4 5
2. My use of the e-Filing method is voluntary. 1 2 3 4 5 3. Lembaga Hasil Dalam Negara does not require me to use e-Filing system.
1 2 3 4 5
4. Although e-Filing might be useful, however it is certainly not compulsory.
1 2 3 4 5
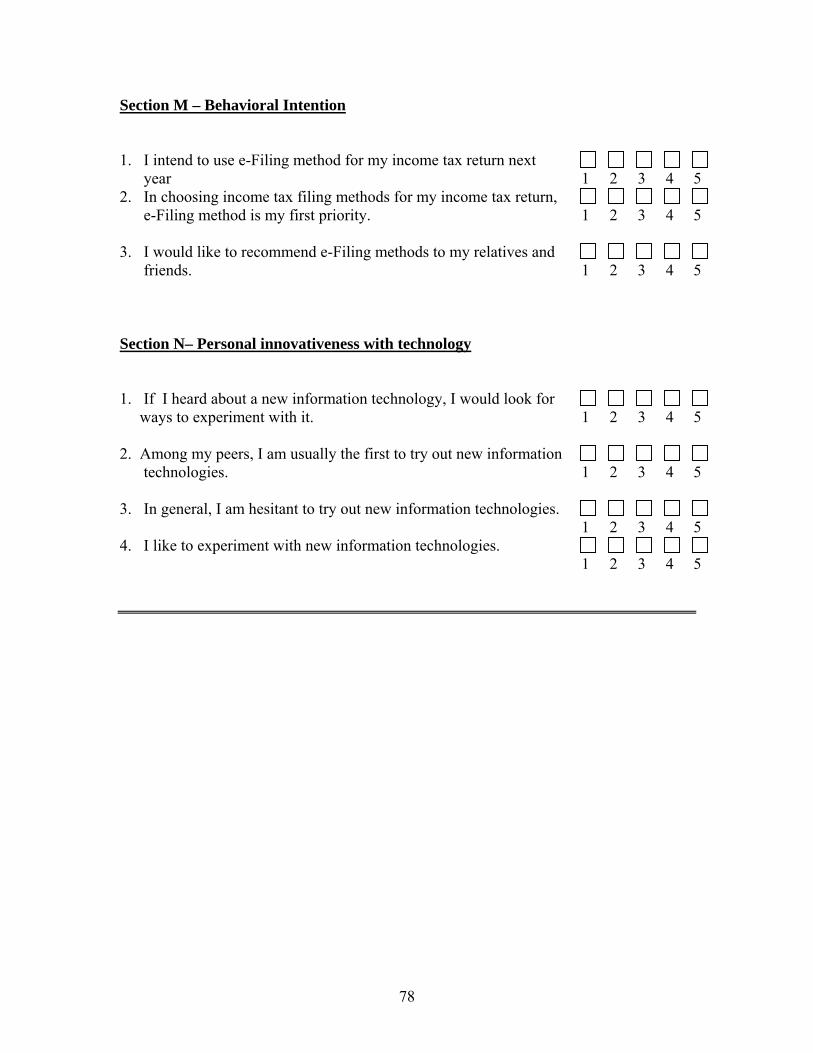
78
Section M – Behavioral Intention 1. I intend to use e-Filing method for my income tax return next
year 1 2 3 4 5 2. In choosing income tax filing methods for my income tax return,
e-Filing method is my first priority.
1 2 3 4 5
3. I would like to recommend e-Filing methods to my relatives and friends.
1 2 3 4 5
Section N– Personal innovativeness with technology
1. If I heard about a new information technology, I would look for ways to experiment with it.
1 2 3 4 5
2. Among my peers, I am usually the first to try out new information technologies.
1 2 3 4 5
3. In general, I am hesitant to try out new information technologies. 1 2 3 4 5
4. I like to experiment with new information technologies. 1 2 3 4 5