Embed Size (px)
Citation preview

Half Yearly Report 1-6/2017
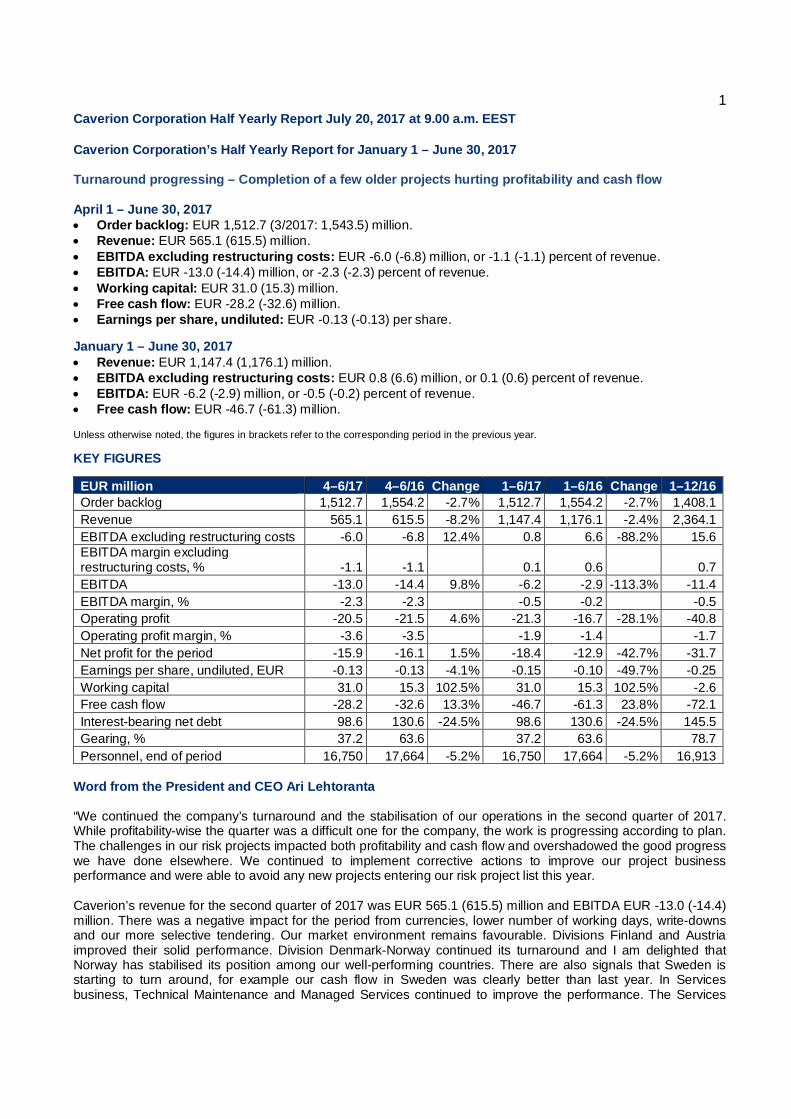
1Caverion Corporation Half Yearly Report July 20, 2017 at 9.00 a.m. EEST
Caverion Corporation’s Half Yearly Report for January 1 – June 30, 2017
Turnaround progressing – Completion of a few older projects hurting profitability and cash flow
April 1 – June 30, 2017· Order backlog: EUR 1,512.7 (3/2017: 1,543.5) million.· Revenue: EUR 565.1 (615.5) million.· EBITDA excluding restructuring costs: EUR -6.0 (-6.8) million, or -1.1 (-1.1) percent of revenue.· EBITDA: EUR -13.0 (-14.4) million, or -2.3 (-2.3) percent of revenue.· Working capital: EUR 31.0 (15.3) million.· Free cash flow: EUR -28.2 (-32.6) million.· Earnings per share, undiluted: EUR -0.13 (-0.13) per share.
January 1 – June 30, 2017· Revenue: EUR 1,147.4 (1,176.1) million.· EBITDA excluding restructuring costs: EUR 0.8 (6.6) million, or 0.1 (0.6) percent of revenue.· EBITDA: EUR -6.2 (-2.9) million, or -0.5 (-0.2) percent of revenue.· Free cash flow: EUR -46.7 (-61.3) million.
Unless otherwise noted, the figures in brackets refer to the corresponding period in the previous year.
KEY FIGURES
EUR million 4–6/17 4–6/16 Change 1–6/17 1–6/16 Change 1–12/16Order backlog 1,512.7 1,554.2 -2.7% 1,512.7 1,554.2 -2.7% 1,408.1Revenue 565.1 615.5 -8.2% 1,147.4 1,176.1 -2.4% 2,364.1EBITDA excluding restructuring costs -6.0 -6.8 12.4% 0.8 6.6 -88.2% 15.6EBITDA margin excludingrestructuring costs, % -1.1 -1.1 0.1 0.6 0.7EBITDA -13.0 -14.4 9.8% -6.2 -2.9 -113.3% -11.4EBITDA margin, % -2.3 -2.3 -0.5 -0.2 -0.5Operating profit -20.5 -21.5 4.6% -21.3 -16.7 -28.1% -40.8Operating profit margin, % -3.6 -3.5 -1.9 -1.4 -1.7Net profit for the period -15.9 -16.1 1.5% -18.4 -12.9 -42.7% -31.7Earnings per share, undiluted, EUR -0.13 -0.13 -4.1% -0.15 -0.10 -49.7% -0.25Working capital 31.0 15.3 102.5% 31.0 15.3 102.5% -2.6Free cash flow -28.2 -32.6 13.3% -46.7 -61.3 23.8% -72.1Interest-bearing net debt 98.6 130.6 -24.5% 98.6 130.6 -24.5% 145.5Gearing, % 37.2 63.6 37.2 63.6 78.7Personnel, end of period 16,750 17,664 -5.2% 16,750 17,664 -5.2% 16,913
Word from the President and CEO Ari Lehtoranta
“We continued the company’s turnaround and the stabilisation of our operations in the second quarter of 2017.While profitability-wise the quarter was a difficult one for the company, the work is progressing according to plan.The challenges in our risk projects impacted both profitability and cash flow and overshadowed the good progresswe have done elsewhere. We continued to implement corrective actions to improve our project businessperformance and were able to avoid any new projects entering our risk project list this year.
Caverion’s revenue for the second quarter of 2017 was EUR 565.1 (615.5) million and EBITDA EUR -13.0 (-14.4)million. There was a negative impact for the period from currencies, lower number of working days, write-downsand our more selective tendering. Our market environment remains favourable. Divisions Finland and Austriaimproved their solid performance. Division Denmark-Norway continued its turnaround and I am delighted thatNorway has stabilised its position among our well-performing countries. There are also signals that Sweden isstarting to turn around, for example our cash flow in Sweden was clearly better than last year. In Servicesbusiness, Technical Maintenance and Managed Services continued to improve the performance. The Services

2business grew by 3.1 percent in the second quarter, while the revenue of the Projects business decreased by17.7 percent.
Our project business performance was burdened by large-scale write-downs particularly in Industrial Solutionsand Germany. The write-downs and remaining project performance risks relate to about 15 risk projects, most ofwhich will be completed this year. I am pleased that we have no new projects added to our risk list this year. Ourprofitability for the period was significantly burdened by cost overruns and write-downs in a set of IndustrialSolutions projects in the new bioproduct plant in Finland, where we plan to finalise our work this summer.
We expect to realise savings from the completed restructuring actions and from discretionary fixed costreductions. In the first half of the year, our personnel expenses decreased by about 3.7 percent and our otheroperating expenses by about 4.4 percent from the previous year. We launched further performance and utilisationimprovement actions in divisions Sweden and Industrial Solutions in the second quarter. These additional actionsamounted to restructuring costs of approximately EUR 6.3 million and their estimated total savings impact isapproximately EUR 2.7 million in 2017 and EUR 5.5 million in 2018. Overall, these actions are estimated to leadto personnel reductions affecting approximately 160 employees in Sweden. In addition there were furtherrestructuring costs of EUR 0.7 million in the second quarter in Industrial Solutions.
In the first half of the year, we made write-downs totalling EUR 18.3 million related to above mentioned riskprojects in divisions Industrial Solutions and Germany. After these write-downs and following our latestassessment completed in July, the remaining project performance risks for the rest of the year are still estimatedto be about EUR 20 million. The increase compared to our earlier estimates is caused almost solely by the abovementioned Industrial Solutions project in Finland where we have made write-downs totalling EUR 11.2 million.With respect to old overdue trade receivables, we have succeeded in collecting certain old receivables withoutmajor impact on profitability. The estimate for full-year risk related to old overdue trade receivables is slightlylower than the earlier anticipated up to EUR 10 million in 2017. The risk related to utilisation is estimated not toexceed the level of up to EUR 10 million indicated earlier. However, we are ready to implement further costsavings during 2017 if necessary.
In early June we issued a EUR 100 million hybrid bond. It was important for us in the middle of our turnaround, asthe hybrid bond strengthened our capital structure and financial position and provided us with a platform to furtherdevelop our business. I am very pleased with the confidence the bond investors showed in our company.
Caverion’s financial performance in 2017 is negatively impacted mainly by our project business performance. Inour current turnaround phase we must first complete the risk projects, restructurings and other corrective actions.We have further strengthened our management team and are currently completing our strategy towards 2020. Wewill tell more about it at our Capital Markets Day in Helsinki on November 7, 2017.”
OUTLOOK FOR 2017
Market outlook for Caverion’s services and solutions
The megatrends in the industry, such as the increase of technology in buildings, energy efficiency requirements,increasing digitalisation and automation as well as urbanisation continue to promote demand for Caverion’sservices and solutions over the coming years.
Services
The underlying demand for Technical Maintenance and Managed Services is expected to remain strong. Astechnology in buildings increases, the need for new services and the demand for Life Cycle Solutions areexpected to increase. Clients’ tendency towards focusing on their core operations continues to open opportunitiesfor Caverion in terms of outsourced operations and maintenance especially for public authorities, industries andutilities.
Projects
The Technical Installation and Large Projects markets are expected to remain on a good and stable level,however price competition is expected to remain tight in Technical Installation projects. In the Large Projectsmarket, new tenders for buildings and industry are expected to remain on a good level and even to somewhatincrease. Low interest rates and availability of financing are expected to support investments. The demand for

3Design & Build of Total Technical Solutions is expected to develop favourably in large and technicallydemanding projects. Good demand from both the public and private sector is expected to continue. Requirementsfor increased energy efficiency, better indoor conditions and tightening environmental legislation will be significantfactors supporting the positive market development.
Turnaround programme ‒ Items affecting EBITDA and operating profit*
EUR million 4–6/17 4–6/16 1–6/17 1–6/16 1–12/16EBITDA -13.0 -14.4 -6.2 -2.9 -11.4EBITDA margin, % -2.3 -2.3 -0.5 -0.2 -0.5Items affecting EBITDA and operating profit- Project write-downs** 12.6 15.0 18.3 15.0 59.0- Restructuring costs 7.0 7.5 7.0 9.5 26.9
* The effect of the risk from overdue trade receivables and the utilisation risk excluded for 2017.** Including cost estimate adjustments, cost overruns and provision increases from the risk project list for 2017.
Guidance for 2017
Caverion’s guidance for 2017 is unchanged. Caverion’s guidance for 2017 is: “Caverion estimates that theGroup’s revenue will remain at the previous year's level in 2017 (2016: EUR 2,364 million). Caverion estimatesthat the Group’s EBITDA excluding restructuring costs will more than double in 2017 (2016: EUR 15.6 million).”
In its guidance Caverion applies the following guidance terminology, with a +/- 2pp (percentage point) threshold tothe said limits.
Positive change Lower limit Upper limit% %
At last year’s level -5% 5%Grows 5% 15%Grows clearly 15% 30%Grows significantly 30% 100%Doubles 100%
Negative change Lower limit Upper limit% %
Decreases -15% -5%Decreases clearly -30% -15%Decreases significantly -30%
INFORMATION SESSION, WEBCAST AND CONFERENCE CALL
Caverion will hold a news conference and webcast on the Half Yearly Report on Thursday, July 20, 2017, at 11:00a.m. (Finnish Time, EEST) at the Glo Hotel Kluuvi (Videowall meeting room), Kluuvikatu 4, 2nd floor, Helsinki,Finland. The news conference can also be viewed live on Caverion’s website at www.caverion.com/investors. It isalso possible to participate in the event through a conference call by calling the assigned number +44 (0)330 3369411 at 10:55 a.m. (Finnish time, EEST) at the latest. Participant code for the conference call is “9305052/Caverion”. More practical information on the news conference can be found on Caverion's website,www.caverion.com/investors.
Financial information and IR events in 2017
Caverion will arrange a Capital Markets Day in Helsinki, Finland on November 7, 2017 at 9:00 a.m. (EET). Furtherinformation on the programme will be published closer to the date.
Interim Report for the first nine months of 2017 will be published on October 27, 2017. Financial reports and otherinvestor information are available on Caverion's website, www.caverion.com/investors, and IR App. The materialsmay also be ordered by sending an e-mail to [email protected].

4CAVERION CORPORATION
For further information, please contact:
Martti Ala-Härkönen, Chief Financial Officer, Caverion Corporation, tel. +358 40 737 6633, [email protected]
Milena Hæggström, Head of Investor Relations, Caverion Corporation, tel. +358 40 5581 328,[email protected]
Distribution: Nasdaq Helsinki, principal media, www.caverion.com

5
GROUP FINANCIAL DEVELOPMENT
Key Figures

6Operating environment in the second quarter and during the first half of 2017
The overall market situation was relatively positive and stable throughout the period. Demand developedfavourably in German, Finnish and Swedish markets. In Industrial Solutions division the market stayed on anormal level in industrial maintenance. Divisions Eastern Europe and Austria remained stable. In Denmark-Norway, the general economy and demand situation are recovering from the previous year, supported by publicdemand.
Services
Demand for Technical Maintenance and Managed Services remained strong. Clients’ willingness to focus on theircore operations opened new opportunities for Caverion in terms of outsourced operations and maintenancemainly for public authorities, industries and utilities. Interest in private public partnerships and other Life CycleSolutions was good in the Nordic countries while these kinds of commercial models still represent only a marginalpart of the entire market.
Projects
The market for Technical Installation and Large Projects business was positive throughout the period. The pricecompetition remained tight in Technical Installation projects. In the market for Large Projects, tendering activityremained on a good level, especially in the public, infrastructure and industrial sectors. The demand for Design &Build of Total Technical Solutions developed favourably within large and technically demanding projects. Lowinterest rates and availability of financing supported investments. Requirements for increased energy efficiency,better indoor climate and tightening environmental legislation supported demand.
Turnaround programme and estimated key risk areas for 2017
Caverion expects to realise savings from the completed restructuring actions and from discretionary fixed costreductions. The full effect of Caverion’s restructuring actions completed in 2016 will be visible in 2017. Theestimated total savings impact of the restructuring actions made last year is approximately EUR 40 million in2017, the additional savings for 2017 vs. 2016 being thus approximately EUR 22 million. Furthermore, theadditional performance and utilisation improvement actions announced in divisions Sweden and IndustrialSolutions in the second quarter of 2017 amounted to restructuring costs of approximately EUR 6.3 million. Theestimated total savings impact of these actions is approximately EUR 2.7 million in 2017 and EUR 5.5 million in2018. In addition there were further restructuring costs of EUR 0.7 million in the second quarter in IndustrialSolutions.
Caverion still has significant risk areas potentially affecting its performance this year. In the first half of the year,Caverion made project write-downs totalling EUR 18.3 million in divisions Industrial Solutions and Germany. Afterthese write-downs and following the latest assessment completed in July, the remaining project performance risksfor the rest of the year are still estimated at about EUR 20 million. The increase compared to the earlier estimatesis caused almost solely by the Industrial Solutions bioproduct plant project in Finland where write-downs totallingEUR 11.2 million have been made this year.
The estimated full-year risk related to old overdue trade receivables is slightly lower than the earlier estimated upto EUR 10 million in 2017. With respect to old overdue trade receivables, Caverion has succeeded in collectingcertain old receivables without major impact on profitability.
The estimated risk related to utilisation should not exceed the level of up to EUR 10 million indicated earlier.Caverion is ready to implement further cost savings during 2017 if necessary.
Turnaround programme ‒ Items affecting EBITDA and operating profit*
EUR million 4–6/17 4–6/16 1–6/17 1–6/16 1–12/16EBITDA -13.0 -14.4 -6.2 -2.9 -11.4EBITDA margin, % -2.3 -2.3 -0.5 -0.2 -0.5Items affecting EBITDA and operating profit- Project write-downs** 12.6 15.0 18.3 15.0 59.0- Restructuring costs 7.0 7.5 7.0 9.5 26.9
* The effect of the risk from overdue trade receivables and the utilisation risk excluded for 2017.** Including cost estimate adjustments, cost overruns and provision increases from the risk project list for 2017.

7
Order backlog
Caverion implemented a stricter project tendering process in the Group since the second quarter of 2016 and inline with this, continued to focus on the tendering process with a target to uplift the project margin in new projectbusiness orders. The order backlog amounted to EUR 1,512.7 million at the end of June, down by 2.0 percentcompared to the end of March 2017 (EUR 1,543.5 million). The order backlog decreased by 2.7 percent from theend of June 2016 (EUR 1,554.2 million). At comparable exchange rates the order backlog decreased by 1.5percent from the end of March 2017 and by 2.1 percent from the end of June 2016.
Revenue
April–June
The revenue for April–June was EUR 565.1 (615.5) million. Revenue decreased by 8.2 percent compared to theprevious year. There was a negative impact for the period from currencies, lower number of working days, write-downs and the Group’s more selective tendering in the project business.
Revenue remained on a par compared to the previous year in Denmark-Norway, Austria and Eastern Europe,while it decreased in other divisions. Project write-downs affected revenue for the period in Germany.
Changes in foreign exchange rates decreased the Group's total revenue for April–June by EUR 5 millioncompared to the previous year, of which the Swedish crown accounted for EUR -6 million, the Norwegian crownfor EUR -1 million and the Russian rouble for EUR 1 million. Revenue decreased by 7.4 percent at previous year’sexchange rates for April–June.
The revenue of the Services business was EUR 289.3 (280.6) million in April–June, an increase of 3.1 percentfrom the corresponding period in the previous year, despite three working days less compared to last year.Services business revenue consisted of the Technical Maintenance revenue of EUR 208.3 (204.9) million and theManaged Services revenue of EUR 80.9 (75.7) million. Revenue declined in the Projects business by 17.7percent from the corresponding period in the previous year due to more selective tendering especially in LargeProjects. The revenue of the Projects business was EUR 275.8 (335.0) million in April–June, consisting of theTechnical Installation revenue of EUR 184.3 (197.9) million and Large Projects revenue of EUR 91.5 (137.0)million.
The Services business accounted for 51.2 (45.6) percent of Group revenue and the Projects business for 48.8(54.4) percent of Group revenue in April–June.
January–June
The revenue for January–June was EUR 1,147.4 (1,176.1) million. Revenue decreased by 2.4 percent comparedto the previous year. Revenue growth was largest in Denmark-Norway and Eastern Europe compared to theprevious year. Project write-downs affected revenue for the period.
Changes in foreign exchange rates increased the Group's total revenue for January–June by EUR 1 millioncompared to the previous year, of which the Swedish crown accounted for EUR -8 million, the Norwegian crownfor EUR 5 million and the Russian rouble for EUR 4 million. Revenue decreased by 2.5 percent at previous year’sexchange rates for January–June.
The revenue of the Services business was EUR 582.0 (543.1) million in January–June, an increase of 7.2 percentfrom the corresponding period in the previous year. Services business revenue consisted of the TechnicalMaintenance revenue of EUR 417.0 (392.5) million and the Managed Services revenue of EUR 165.0 (150.6)million. Revenue declined in the Projects business by 10.7 percent from the corresponding period in the previousyear due to more selective tendering especially in Large Projects. The revenue of the Projects business was EUR565.4 (633.0) million in January–June, consisting of the Technical Installation revenue of EUR 361.6 (383.1)million and Large Projects revenue of EUR 203.8 (249.9) million. Projects business was impacted by project write-downs in the first half of the year.
The Services business accounted for 50.7 (46.2) percent of Group revenue and the Projects business for 49.3(53.8) percent of Group revenue in January–June.

8
Distribution of revenue
Revenue,EUR million
4–6/%
4–6/% Change
1–6/ 1–6/ 1–12/2017 2016 2017 % 2016 % Change 2016
Denmark-Norway 118.3 21% 117.8 19% 0% 243.0 21% 226.7 19% 7% 455.8Sweden 113.2 20% 122.2 20% -7% 231.2 20% 246.5 21% -6% 474.8Germany 114.6 20% 131.6 21% -13% 225.5 20% 256.7 22% -12% 506.6Industrial Solutions 85.8 15% 102.2 17% -16% 180.3 16% 184.0 16% -2% 374.9Finland 75.7 13% 84.0 14% -10% 158.3 14% 155.6 13% 2% 320.7Austria 38.4 7% 38.7 6% -1% 72.7 6% 71.1 6% 2% 153.0Eastern Europe 19.2 3% 19.2 3% 0% 37.0 3% 35.7 3% 4% 78.7Group, total 565.1 100% 615.5 100% -8% 1,147.4 100% 1,176.1 100% -2% 2,364.1Projects business 275.8 49% 335.0 54% -18% 565.4 49% 633.0 54% -11% 1,233.6- Technical
Installation 184.3 33% 197.9 32% -7% 361.6 32% 383.1 33% -6% 782.3- Large Projects 91.5 16% 137.0 22% -33% 203.8 18% 249.9 21% -18% 451.3
Services business 289.3 51% 280.6 46% 3% 582.0 51% 543.1 46% 7% 1,130.6- Technical
Maintenance 208.3 37% 204.9 33% 2% 417.0 36% 392.5 33% 6% 817.8- Managed
Services 80.9 14% 75.7 12% 7% 165.0 14% 150.6 13% 10% 312.8
Profitability
EBITDA
April–June
The EBITDA excluding restructuring costs was EUR -6.0 (-6.8) million, or -1.1 (-1.1) percent of revenue in April–June. The EBITDA for April–June was EUR -13.0 (-14.4) million, or -2.3 (-2.3) percent of revenue.
Profitability was burdened by project business write-downs and restructuring costs. Project write-downs totalledEUR 12.6 (15.0) million in divisions Industrial Solutions and Germany. These write-downs were negative forecastchanges and cost overruns related to earlier identified risk projects. The profitability for the period was significantlyburdened by cost overruns and write-downs in a set of Industrial Solutions projects in the new bioproduct plant inFinland, totalling EUR 9.3 million. These projects are estimated to be finalised this summer.
Costs related to materials and supplies decreased to EUR 157.4 (177.1) million and the external services to EUR108.4 (114.2) million in April–June. In the second quarter, personnel expenses decreased by about 7.7 percentand other operating expenses by about 8.4 percent from the previous year. Personnel expenses for April–Juneamounted to a total of EUR 244.0 (264.4) million. Other operating expenses decreased to EUR 68.3 (74.6) million.Other operating income amounted to EUR 0.1 (0.5) million.
January–June
The EBITDA excluding restructuring costs was EUR 0.8 (6.6) million, or 0.1 (0.6) percent of revenue in January–June. The EBITDA for January–June was EUR -6.2 (-2.9) million, or -0.5 (-0.2) percent of revenue.
Profitability was burdened by project business write-downs and restructuring costs. Project write-downs totalledEUR 18.3 (15.0) million in divisions Industrial Solutions and Germany. These write-downs were negative forecastchanges and cost overruns related to earlier identified risk projects. The profitability for the period was significantlyburdened by cost overruns and write-downs in a set of Industrial Solutions projects in the new bioproduct plant inFinland, totalling EUR 11.2 million. These projects are estimated to be finalised this summer.
Costs related to materials and supplies increased to EUR 321.8 (320.0) million and the external services to EUR209.6 (212.0) million in January–June. The effect of the restructuring actions completed in 2016 were clearlyvisible in the first half of the year. In the first half of the year, personnel expenses decreased by about 3.7 percent

9and other operating expenses by about 4.4 percent from the previous year. Personnel expenses for January–June amounted to a total of EUR 489.3 (508.3) million. Other operating expenses decreased to EUR 133.2(139.4) million. Other operating income amounted to EUR 0.4 (0.8) million.
EBITDA is defined as Operating profit + Depreciation, amortisation and impairment. EBITDA excludingrestructuring costs is defined as Operating profit + Depreciation, amortisation and impairment + restructuringcosts.
Operating profit
April–June
The operating profit for April–June was EUR -20.5 (-21.5) million, or -3.6 (-3.5) percent of revenue.
Depreciation, amortisation and impairment amounted to EUR 7.5 (7.1) million in April–June, of which EUR 5.4million were allocated intangibles related to acquisitions and EUR 2.1 million were other depreciations,amortisation and impairments, the majority of which related to IT.
January–June
The operating profit for January–June was EUR -21.3 (-16.7) million, or -1.9 (-1.4) percent of revenue.
Depreciation, amortisation and impairment amounted to EUR 15.2 (13.8) million in January–June, of which EUR11.2 million were allocated intangibles related to acquisitions and EUR 3.9 million were other depreciations,amortisation and impairments, the majority of which related to IT.
The other factors affecting operating profit have been described in more detail under EBITDA.
Profit before taxes, net profit and earnings per share
Profit before taxes amounted to EUR -24.1 (-17.4) million, net profit to EUR -18.4 (-12.9) million and earnings pershare to EUR -0.15 (-0.10) in January–June. Net financing expenses in January–June were EUR -2.8 (-0.7)million.
The effective tax rate of the Group was 23.9 (26.0) percent in January–June.
Capital expenditure, acquisitions and disposals
Gross capital expenditure on non-current assets included in the balance sheet totalled EUR 7.9 (24.4) millionduring January–June, representing 0.7 (2.1) percent of revenue. Investments in information technology totalledEUR 5.8 (16.0) million during January–June. IT investments were focused on building a harmonised IT infra andcommon platforms, datacenter consolidation as well as implementing a common ERP template. IT systems andmobile tools were also developed to improve the Group’s internal processes and efficiency going forward. Otherinvestments, including acquisitions, amounted to EUR 2.1 (8.4) million. Caverion made no acquisitions ordisposals during the period in 2017.
Cash flow, working capital and financing
The Group's free cash flow was negative although improving from the corresponding period last year. Free cashflow amounted to EUR -46.7 (-61.3) million in January–June. Free cash flow was improved by the lower level ofinvestments compared to last year. The Group's operating cash flow before financial and tax items amounted toEUR -38.1 (-31.1) million in January–June.
Working capital was EUR 31.0 (15.3) million at the end of June. Working capital was negative and there waspositive development in working capital in divisions Finland, Sweden and Denmark-Norway. Working capital wastied by risk projects in divisions Industrial Solutions and Germany. The amount of POC receivables amounted toEUR 297.3 million (292.8) at the end of June. Trade receivables amounted to EUR 315.6 million (334.1) at theend of June.

10Caverion’s cash and cash equivalents amounted to EUR 19.8 million at the end of June (3/2017: EUR 24.7million). In addition, Caverion has undrawn revolving credit facilities amounting to EUR 100.0 million and undrawnoverdraft facilities amounting to EUR 19.0 million.
The Group’s interest-bearing loans and borrowings amounted to EUR 118.4 million at the end of June (3/2017:EUR 189.6 million), and the average interest rate after hedges was 2.35 percent. Approximately 67 percent of theloans have been raised from banks and other financial institutions, approximately 13 percent directly from themoney markets and approximately 17 percent from insurance companies. A total of EUR 45.0 million of theinterest-bearing loans and borrowings will fall due during the next 12 months. The Group’s net debt amounted toEUR 98.6 million at the end of June (3/2017: EUR 164.9 million).
On June 9, 2017 Caverion Corporation issued a EUR 100 million hybrid bond, an instrument subordinated to thecompany's other debt obligations and treated as equity in the IFRS financial statements. The hybrid bond doesnot confer to its holders the rights of a shareholder and does not dilute the holdings of the current shareholders.The coupon of the hybrid bond is 4.625 per cent per annum until June 16, 2020. The hybrid bond does not have amaturity date but the issuer is entitled to redeem the hybrid for the first time on June 16, 2020, and subsequently,on each coupon interest payment date. If the hybrid bond was not redeemed on June 16, 2020, there will be astep-up of 500 basis points in the coupon. The hybrid bond strengthened the capital structure and financialposition of the company. EUR 40 million of the proceeds from the hybrid bond were used to refinance existingbank loan facilities during the period and the remaining part will be used for general corporate purposes.Subsequently, the company’s five existing bank loan facilities were combined into one agreement. Following theEUR 100m hybrid transaction, Caverion’s key figures improved as follows: equity ratio improved to 28.1%(3/2017: 19.2%) and gearing to 37.2% (3/2017: 90.1%).
Caverion’s external loans are subject to a financial covenant based on the ratio of the Group’s net debt toEBITDA. Caverion and its core banks agreed on changes in the loan documentation in connection with the hybridtransaction. Financial covenant shall not exceed 5.0:1 by the end of September 2017 and thereafter the ratio shallnot exceed 3.5:1. At the end of June, the Group’s Net debt to EBITDA was 3.4x according to the confirmedcalculation principles.
Changes in external financial reporting in 2017
Caverion announced in an investor news release on May 29, 2017 that it is launching further actions to addressthe remaining utilisation and performance challenges in Sweden. These actions include reductions in workforce,combining of existing units, better usage of shared resources and integration of its Swedish industrial and buildingsystems operations. In the integration of industrial and building systems operations all of approximately 350employees from the Swedish industrial operations will be transferred to Division Sweden.
The integration will also result in changes in Caverion’s external financial reporting. Going forward, Caverion willreport the figures for its Swedish industrial operations under Division Sweden as of July 1, 2017.
PERSONNEL
Personnel by division, end of period 6/17 3/17 Change 6/17 6/16 Change 12/16Denmark-Norway 3,297 3,254 1% 3,297 3,518 -6% 3,330Sweden 3,049 3,075 -1% 3,049 3,518 -13% 3,172Germany 2,443 2,451 0% 2,443 2,427 1% 2,452Industrial Solutions 2,661 2,664 0% 2,661 2,902 -8% 2,742Finland 2,568 2,470 4% 2,568 2,513 2% 2,439Austria 803 794 1% 803 800 0% 811Eastern Europe 1,817 1,858 -2% 1,817 1,835 -1% 1,841Group Services 112 113 -1% 112 151 -26% 126Group, total 16,750 16,679 0% 16,750 17,664 -5% 16,913
Caverion Group employed 16,740 (17,521) people on average in January–June 2017. At the end of June, theGroup employed 16,750 (17,664) people. Personnel expenses for January–June 2017 amounted to EUR 489.3(508.3) million.
11The effect of the restructuring actions completed in 2016 were clearly visible in the first half of the year. At thesame time some new resources were needed to fulfil critical competence gaps and to grow trainees andapprenticeships. Special attention has been paid to project management and the strengthening of managerialcapabilities. Development activities were continued in divisions to better match business demand with the supplyof resources. Caverion launched further performance and utilisation improvement actions in Sweden in thesecond quarter of 2017. These actions included reductions in workforce, combination of existing units, betterusage of shared resources and integration of our Swedish industrial and building systems operations. Overall,these actions are estimated to lead to personnel reductions affecting approximately 160 employees in Sweden.
Several Group-wide projects were continued such as the implementation of project management capabilities anda common leadership development program. Talent and succession planning as well as the implementation of acommon job structure and basic people processes with a common platform were continued. The well-being ofemployees was a focus area and group-wide safety programme was taken forward.
Changes in Caverion’s Group Management
Ari Lehtoranta started as the President and CEO of Caverion Corporation as of January 1, 2017.
Caverion announced the following changes in Caverion’s Group Management Board and organisation structureon January 9, 2017. The role of the Group level functions Services and Projects was strengthened by increasingtheir areas of responsibility and they will be called business units going forward. Thomas Hietto (born 1967,M.Sc.,Tech.) was appointed as the head of business unit Services and Jarno Hacklin (born 1978, B. Eng.) wasappointed as the head of business unit Projects. Ville Tamminen (born 1974, LL.M, trained on the bench) wasappointed as the head of Division Finland. A new Group function Legal & Governance was also established in thecompany. Anne Viitala (born 1959, LL.M, trained on the bench, eMBA) was appointed as the head of new Groupfunction Legal & Governance. All of the appointed are also members of the Group Management Board ofCaverion Corporation. The appointments took effect as of January 9, 2017, apart from the appointment of ThomasHietto. He started in his position on July 1, 2017. The business unit Services was headed until June 30, 2017 byMatti Malmberg who continues his service at Caverion.
Caverion announced on January 19, 2017 that Erkki Huusko (born 1957, B. Eng., eMBA) was appointed as Headof Division Industrial Solutions and a member of the Group Management Board of Caverion Corporation as ofJanuary 19, 2017. Erkki Huusko has previously worked as Chief Operative Officer in the Division IndustrialSolutions, meanwhile Juhani Pitkäkoski has had total responsibility of the division. Juhani Pitkäkoski will continueto work in the division until July 16, 2017 by supporting the completion of ongoing projects.
Caverion announced on April 3, 2017 that Minna Schrey-Hyppänen, born 1966, M.Sc. (Eng.), M.Sc (Econ), hasbeen appointed as Head of Human Resources and a member of the Group Management Board of CaverionCorporation as of June 26, 2017. Merja Eskola, her predecessor, continues her service at Caverion beingresponsible of strategic resourcing and talent development.
Caverion announced on June 21, 2017 that Sakari Toikkanen (born 1967, Lic (Tech.) has been appointed asHead of Division Industrial Solutions of Caverion Corporation as of June 21, 2017. He will assume the positionuntil a new permanent head of division is hired. Sakari Toikkanen also continues in his role as the Head of IT &Communications & Sales development of Caverion Corporation and as a member of the Group ManagementBoard. Erkki Huusko will continue in specific tasks in the company over the next few months and report to SakariToikkanen.
The responsibility area of Strategy and M&A was transferred to Group function Finance under CFO Martti Ala-Härkönen on June 22, 2017.
SIGNIFICANT SHORT-TERM RISKS AND UNCERTAINTIES
Caverion's typical operational risks relate to its services and project business. These include risks related totendering (e.g. calculation and pricing), contractual terms and conditions, partnering, subcontracting, procurementand price of materials, availability of qualified personnel and project management. To manage these risks, riskassessment and review processes for both the sales and execution phase have been introduced, and riskreservations have been increased. Given the specific risks related to project business, the Group ProjectBusiness Unit was established in the beginning of 2017 and is dedicated to the overall improvement of project riskmanagement, to steering the project portfolio and to improve project management capabilities. Despite all actions

12taken there is a risk that some project risks materialise, which could have a negative impact on Caverion’sfinancial performance and position. Project risk assessment is an ongoing process in the company, and it ispossible that risks may be identified in the other currently running and new projects.
Caverion completed a thorough project risk assessment during 2016, which resulted in significant project write-downs and provisions during 2016. There is also remaining risk in these projects. Although improved projectcontrols have been implemented, it is possible that some of the identified remaining risks may materialise, whichcould lead to further project write-downs and provisions, in addition to the ones already made in the first half of2017, and to disputes and litigations. It is also possible that new risks may emerge in these projects.
According to Group policy, write-offs or provisions are booked on receivables when it is evident that no paymentcan be expected. Caverion Group follows a policy in valuing trade receivables and the bookings include estimatesand critical judgements. The estimates are based on experience on realised write-offs in previous years, empiricalknowledge of debt collection, customer-specific collaterals and analyses as well as the general economic situationof the review period. Caverion completed several risk assessments related to POC and trade receivables in itsproject portfolio during 2016, which led to write-downs on receivables during 2016. Most of these write-downsrelated to POC receivables. A further review and risk assessment will be continued during 2017. There are certainindividual larger receivables where the company is taking significant actions to negotiate and collect thereceivables. There is remaining risk in the identified receivables, and it cannot be excluded that there is also riskassociated with other receivables.
Given the nature of Caverion’s business, Group companies are involved in disputes and legal proceedings inseveral projects. These disputes and legal proceedings typically concern claims made against Caverion forallegedly defective or delayed delivery. In some cases, the collection of receivables by Caverion may result indisputes and legal proceedings. There is a risk that the client presents counter claims in these proceedings. Theoutcome of disputes and legal proceedings is difficult to predict. Write-downs and provisions are booked followingthe applicable accounting rules.
The investigation of violations of competition law related regulations in the technical services industry in Germanycontinues. As part of the investigation German authorities have searched information from various technicalservices providers, including Caverion. Caverion co-operates with the local authorities. Based on the currentlyavailable information, it is still not possible to evaluate the magnitude of the potential risk for Caverion related tothese issues. The timing of the closing of the investigations is also unknown. It is possible that the costs,sanctions and indemnities can be material.
As part of this co-operation Caverion has identified activities during 2009-2011 that are likely to fulfil the criteria ofcorruption or other criminal commitment in one of its client project executed in that time. Caverion has brought itsfindings to the attention of the authorities and supports them to further investigate the case. It is possible thatthese infringements will cause considerable damage to Caverion in terms of fines, civil claims as well as legalexpenses. However, the magnitude of the potential damage cannot be assessed at the moment. Caverion ismonitoring the situation and will disclose any relevant information as applicable under regulations.
Caverion is implementing a robust compliance programme. As part of the programme all employees mustcomplete an annual e-learning module and further training is given across the organisation. All employees arerequired to comply with Caverion’s Code of Conduct, which sets zero tolerance on bribery and corruption.
Goodwill recognised on Caverion’s balance sheet is not amortised, but it is tested annually for any impairment.The amount by which the carrying amount of goodwill exceeds the recoverable amount is recognised as animpairment loss through profit and loss. If negative changes take place in Caverion’s result and growthdevelopment, this may lead to an impairment of goodwill, which may have an unfavourable effect on Caverion’sresult of operations and shareholders’ equity.
Caverion’s external loans are subject to a financial covenant based on the ratio of the Group’s net debt toEBITDA. Breaching this covenant would give the lending parties the right to declare the loans to be immediatelydue and payable. Caverion and its lending parties confirmed the EBITDA calculation principles related to theGroup’s financial covenant (net debt to EBITDA) in December 2016. Furthermore, Caverion concluded anamendment with its lending parties related to the maximum level of the financial covenant in the Q1/2017 testingin March 2017. On June 9, 2017 Caverion issued a EUR 100 million hybrid bond which is treated as equity underIFRS. The hybrid bond issue improved the Group’s liquidity and capital structure, hence also the financialcovenant level. At the same time the company agreed on a maximum level of the financial covenant for the

13Q2/2017 and Q3/2017 testings. The project write-downs made in 2017 have burdened the company’s financialcovenant level in the first half of 2017 and the remaining project risks may result in further project write-downs inthe second half of 2017. The level of the financial covenant ratio is continuously monitored and evaluated againstactual and forecasted EBITDA and net debt figures.
Caverion’s business typically involves granting of guarantees in favour of customers or other stakeholders,especially in large projects, e.g. for advance payments received, for performance of contractual obligations, andfor defects during the warranty period. Such guarantees are typically granted by financial intermediaries on behalfof Caverion. There is no assurance that the company would have continuous access to sufficient guarantees fromfinancial intermediaries at competitive terms or at all, and the absence of such guarantees could have an adverseeffect on Caverion’s business and financial condition. To manage this risk, Caverion’s target is to maintain severalguarantee facilities in the different countries where it operates.
Financial risks are described in more detail in the Financial Statements note 30 and in the financial tables to thisHalf Yearly Report under note 5.
Caverion has made significant investments in IT and system development. There is a risk that the expectedfunctionalities and pay-back are not fully materialised.
Caverion’s website and financial statemens bulletin for 2016 published on February 7, 2017 describes the mostsignificant business risks.
RESOLUTIONS PASSED AT THE ANNUAL GENERAL MEETING
The Annual General Meeting of Caverion, held on March 17, 2017, adopted the Financial Statements for the year2016 and discharged the members of the Board of Directors and the President and CEO from liability. In addition,the Annual General Meeting resolved on the use of the profit shown on the balance sheet and the payment ofdividend, the amendment of the Articles of Association, the composition of members of the Board of Directors andtheir remuneration, the election of the auditor and its remuneration as well as authorised the Board of Directors todecide on the repurchase of the company’s own shares and share issues.
The Annual General Meeting elected a Chairman, Vice Chairman and six ordinary members to the Board ofDirectors. Michael Rosenlew was elected as the Chairman of the Board of Directors, Markus Ehrnrooth as theVice Chairman and Jussi Aho, Joachim Hallengren, Thomas Hinnerskov, Antti Herlin, Anna Hyvönen and EvaLindqvist as members of the Board of Directors for a term continuing until the end of the next Annual GeneralMeeting. The term of Antti Herlin began upon the registration of the amendment of the Articles of Association inthe Trade Register on March 29, 2017.
The stock exchange release on the resolutions passed at the Annual General Meeting is available on Caverion’swebsite at http://www.caverion.com/about-us/media/releases.
The Board of Directors held its organisational meeting on March 17, 2017. At the meeting the Board decided onthe composition of the Human Resources Committee and the Audit Committee. A description of the committees’tasks and charters are available on Caverion’s website at www.caverion.com/investors - Corporate Governance.
DIVIDENDS AND DIVIDEND POLICY
The Annual General Meeting, held on March 17, 2017, decided according to the proposal of the Board ofDirectors that no dividend will be paid for the financial year 2016.
Caverion’s aim is to distribute at least 50 per cent of the result for the year after taxes, excluding changes in fairvalue, as dividend and capital redemption to the company’s shareholders. Even though there are no plans toamend this dividend policy, there is no guarantee that a dividend or capital redemption will actually be paid in thefuture, and also there is no guarantee of the amount of the dividend or return of capital to be paid for any givenyear.

14SHARES AND SHAREHOLDERS
Caverion Corporation is a public limited company organised under the laws of the Republic of Finland,incorporated on June 30, 2013. The company has a single series of shares, and each share entitles its holder toone vote at the General Meeting of the company and to an equal dividend. The company’s shares have nonominal value.
Share capital and number of shares
At the beginning of January 1, 2017, the number of shares was 125,596,092 and the share capital was EUR1,000,000. Caverion held 512,328 treasury shares throughout the whole reporting period January–June 2017.The number of shares outstanding was thus 125,083,764 at the end of June 2017. Own shares held by CaverionCorporation represent 0.41% of the total number of shares and voting rights.
Caverion's Board of Directors approved a long-term share-based incentive plan for the Group’s seniormanagement in December 2015 and continued the said plan in December 2016. The share based incentive planconsists of a Performance Share Plan (PSP) as the main structure supported by a Restricted Share Plan as acomplementary structure for specific situations. Both plans consist of annually commencing individual plans, eachwith a three-year period. The commencement of each new plan is subject to a separate decision of the Board.The first plans commenced at the beginning of 2016. The targets set for the first Performance Share Plan 2016–2018 were not met. No reward will therefore be paid to participants in the Performance Share Plan 2016–2018.The second plans commenced at the beginning of 2017 and any potential share rewards thereof will be deliveredin the spring of 2020. If all targets will be met, the share rewards based on Performance Share Plan 2017-2019will comprise a maximum of approximately 850,000 Caverion shares (gross before the deduction of applicablepayroll tax). More information on the incentive plan was released in stock exchange releases on December 18,2015 and December 21, 2016. Furthermore, more information on the earlier long-term share-based incentive plan2014−2016 for the company’s key senior executives has been released in a stock exchange release on May 26,2014. The targets set for this plan were not met.
Caverion has not made any decision regarding the issue of option rights or other special rights entitling to shares.Caverion or its subsidiaries do not have any Caverion Corporation shares as a pledge.
Authorisations of the Board of Directors
Authorising Caverion's Board of Directors to decide on the repurchase of own shares of the company
The Annual General Meeting of Caverion Corporation, held on March 17, 2017, authorised the Board of Directorsto decide on the repurchase of own shares. The authorisation covers the repurchase of a maximum of 12,000,000company´s own shares using the company's unrestricted equity, at fair value at the date of repurchase, whichshall be the prevailing market price in the trading at the regulated market organised by Nasdaq Helsinki Ltd. Theshares may be repurchased other than pro rata to the shareholders’ existing holdings. The share purchase willdecrease the company’s distributable unrestricted equity. The authorisation is valid for eighteen months from thedate of the resolution of the Annual General Meeting. The Board of Directors has not used the authorisationduring 2017.
Authorising Caverion's Board of Directors to decide on share issues
The Annual General Meeting authorised the Board of Directors to decide on share issues. The authorisation maybe used in full or in part by issuing a maximum of 25,000,000 Caverion shares in one or more issues. The Boardof Directors may decide on a directed share issue in deviation from the shareholders’ pre-emptive rights. TheBoard of Directors would be authorized to decide to whom and in which order the shares will be issued. Theauthorisation can be used e.g. in order to strengthen the Company's capital structure, to broaden the Company'sownership, to be used as payment in corporate acquisitions or when the Company acquires assets relating to itsbusiness and as part of the Company's incentive programmes. In the share issues shares may be issued forsubscription against payment or without charge. The Board of Directors is also authorised to decide on a shareissue without payment directed to the company itself, within the limitations laid down in the Companies Act. Theauthorization empowers the Board of Directors to decide on the terms and conditions of and measures related tothe share issues in accordance with the Companies Act, including the right to decide whether the subscriptionprice will be recognized in full or in part in the invested unrestricted equity reserve or as an increase to the sharecapital.

15
The share issue authorisation also includes the authorisation to transfer own shares that are in the possession ofcompany or may be acquired. This authorisation applies to a maximum of 12,500,000 company’s own shares.The Board of Directors was authorised to decide on the purpose and the terms and conditions for such transfer.The authorisation is valid until March 31, 2018. The Board of Directors has not used the authorisation during2017.
Trading in shares
The opening price of Caverion's share was EUR 7.94 at the beginning of the year 2017. The closing rate on thelast trading day of the review period on June 30 was EUR 7.01. The share price decreased by 12 percent duringJanuary–June. The highest price of the share during the review period January–June was EUR 8.28, the lowestwas EUR 6.64 and the average price was EUR 7.40. Share turnover on Nasdaq Helsinki in January–Juneamounted to 33.3 million shares. The value of share turnover was EUR 246.4 million (source: Nasdaq Helsinki).
Caverion's shares are also traded in other market places, such as BATS Chi-X Europe, Turquoise, Aquis andFrankfurt Stock Exchange (Open Market). During January–June, 7.8 million Caverion Corporation shareschanged hands in alternative public market places, corresponding to approximately 14.3 percent of the total sharetrade. Of the alternative market places, Caverion shares changed hands particularly in BATS Chi-X Europe.Furthermore, during January–June, 13.5 million Caverion Corporation shares changed hands in OTC tradingoutside Nasdaq Helsinki, corresponding to approximately 24.6 percent of the total share trade (source: FidessaFragmentation Index).
Caverion Corporation’s market capitalisation at the end of the review period was EUR 876.8 million. Marketcapitalisation has been calculated excluding the 512,328 shares held by the company as per June 30, 2017.
Number of shareholders and flagging notifications
At the end of June 2017, the number of registered shareholders in Caverion was 29,250 (3/2017: 29,778). At theend of June 2017, a total of 35.6 percent of the shares were owned by nominee-registered and non-Finnishinvestors (3/2017: 34.7%).
Updated lists of Caverion’s largest shareholders and ownership structure by sector as per June 30, 2017, areavailable on Caverion’s website at www.caverion.com/investors.

16HALF-YEARLY REPORT JANUARY 1–JUNE 30, 2017: FINANCIAL TABLES
Condensed consolidated income statement
EUR million 4-6/2017 4-6/2016 1-6/2017 1-6/2016 1-12/2016Revenue 565.1 615.5 1,147.4 1,176.1 2,364.1Other operating income 0.1 0.5 0.4 0.8 1.9Materials and supplies -157.4 -177.1 -321.8 -320.0 -648.2External services -108.4 -114.2 -209.6 -212.0 -450.8Employee benefit expenses -244.0 -264.4 -489.3 -508.3 -989.1Other operating expenses -68.3 -74.6 -133.2 -139.4 -289.2Share of results of associated companies 0.0 0.0 0.0 -0.1 -0.1Depreciation and impairments -7.5 -7.1 -15.2 -13.8 -29.5
Operating profit -20.5 -21.5 -21.3 -16.7 -40.8% of revenue -3.6 -3.5 -1.9 -1.4 -1.7
Financial income and expense, net -1.6 -0.2 -2.8 -0.7 -2.6
Profit before taxes -22.1 -21.7 -24.1 -17.4 -43.5% of revenue -3.9 -3.5 -2.1 -1.5 -1.8
Income taxes 6.2 5.5 5.8 4.5 11.8
Profit for the review period -15.9 -16.1 -18.4 -12.9 -31.7% of revenue -2.8 -2.6 -1.6 -1.1 -1.3
Attributable toEquity holders of the parent company -15.9 -16.1 -18.4 -12.9 -31.7Non-controlling interests 0.0 0.0 0.0 0.0 0.0
Earnings per share attributable to theequity holders of the parent companyEarnings per share, EUR -0.13 -0.13 -0.15 -0.10 -0.25Diluted earnings per share, EUR -0.13 -0.13 -0.15 -0.10 -0.25

17Consolidated statement of comprehensive income
EUR million 4-6/2017 4-6/2016 1-6/2017 1-6/2016 1-12/2016Profit for the review period -15.9 -16.1 -18.4 -12.9 -31.7Other comprehensive incomeItems that will not be reclassified to profit/loss
Change in fair value of defined benefit pension 1.1 -0.3 1.3 -0.7 -4.2-Deferred tax 0.0 0.0 1.3
Items that may be reclassified subsequently toprofit/loss
Cash flow hedges -0.1 -0.4 0.0-Deferred taxChange in fair value of for available for sale
investments 0.0 0.0 0.0 0.0 0.0-Deferred taxTranslation differences -2.3 -0.2 -2.1 0.3 1.0
Other comprehensive income, total -1.2 -0.6 -0.8 -0.9 -1.9Total comprehensive result -17.1 -16.7 -19.2 -13.8 -33.6
Attributable toEquity holders of the parent company -17.2 -16.7 -19.2 -13.8 -33.6Non-controlling interests 0.0 0.0 0.0 0.0 0.0

18Condensed consolidated statement of financial position
EUR million 30.6.2017 30.6.2016 31.12.2016
Assets
Non-current assetsProperty, plant and equipment 25.0 30.1 28.3Goodwill 339.8 339.1 339.8Other intangible assets 47.5 53.4 53.0Shares in associated companies 0.1 0.1 0.1Other investments 1.2 1.4 1.2Other receivables 3.2 2.5 3.3Deferred tax assets 17.6 6.0 10.6
Current assetsInventories 20.5 33.6 30.7Trade receivables 315.6 334.1 378.2POC receivables 297.3 292.8 244.4Other receivables 37.3 51.5 40.4Income tax receivables 8.1 4.6 6.4Cash and cash equivalents 19.8 20.4 47.7Total assets 1,133.0 1,169.7 1,184.3
Equity and liabilities
Equity attributable to equity holders of the parent companyShare capital 1.0 1.0 1.0Hybrid capital 100.0 0.0 0.0Other equity 163.8 204.0 183.6
Non-controlling interest 0.4 0.4 0.4
Equity 265.2 205.4 185.0
Non-current liabilitiesDeferred tax liabilities 50.2 59.2 51.1Pension liabilities 45.7 42.9 45.4Provisions 6.9 8.5 7.1Interest-bearing debts 73.4 65.1 127.6Other liabilities 0.4 0.9 0.6
Current liabilitiesAdvances received 188.4 196.5 192.5Trade payables 197.1 228.6 214.1Other payables 225.0 251.3 258.7Income tax liabilities 7.0 5.3 6.5Provisions 28.6 20.0 30.1Interest-bearing debts 45.0 85.9 65.7
Total equity and liabilities 1,133.0 1,169.7 1,184.3

19Working capital
EUR million 30.6.2017 30.6.2016 31.12.2016Inventories 20.5 33.6 30.7Trade and POC receivables 612.9 627.0 622.7Other current receivables 36.2 51.0 38.9Trade and POC payables -213.9 -252.2 -239.7Other current liabilities -236.3 -247.6 -262.5Advances received -188.4 -196.5 -192.5Working capital 31.0 15.3 -2.6
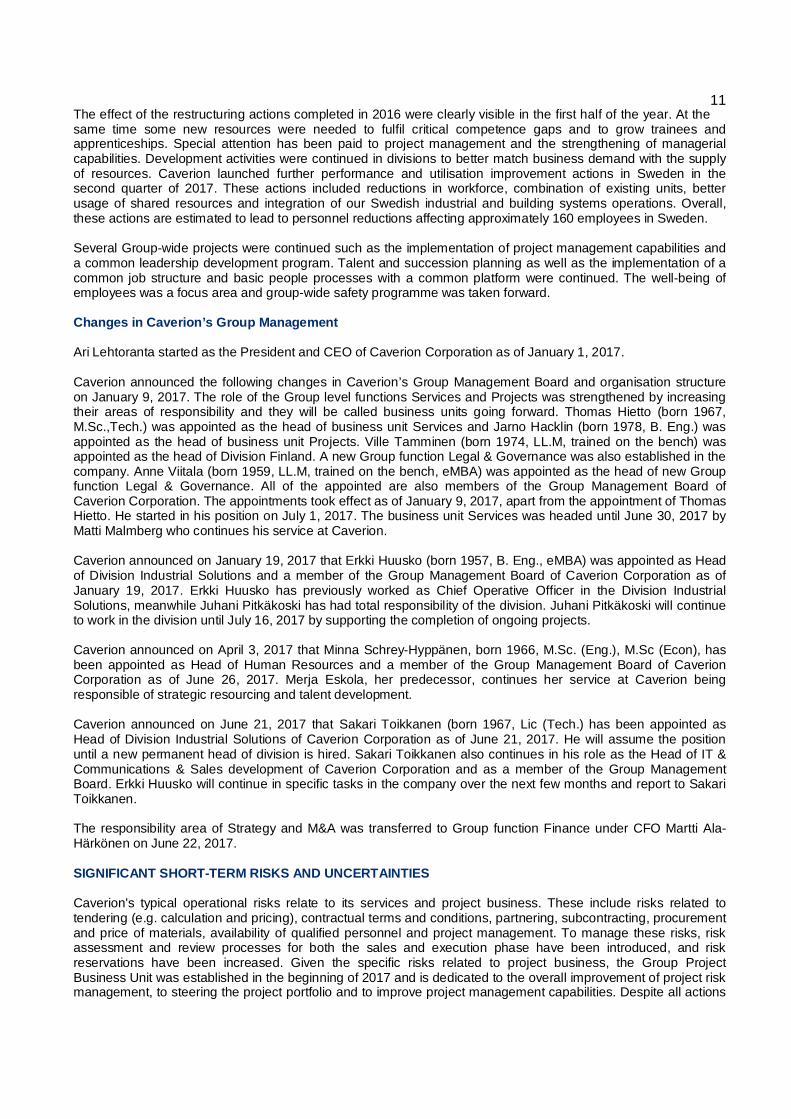
Consolidated statement of changes in equity
Equity attributable to owners of the parent
EUR millionSharecapital
Retainedearnings
Cumulativetranslation
differences
Fairvalue
reserveTreasury
sharesHybridcapital Total
Non-controlling
interestTotal
equity
Equity on January 1, 2017 1.0 193.1 -5.5 -0.7 -3.2 184.7 0.4 185.0Comprehensive income
Profit for the period -18.4 -18.4 0.0 -18.4Other comprehensive income:Change in fair value of definedbenefit pension 1.3 1.3 1.3
-Deferred tax
Cash flow hedgesChange in fair value of available forsale assets 0.0 0.0 0.0
Translation differences -2.1 -2.1 -2.1Comprehensive income, total -17.1 -2.1 0.0 0.0 0.0 -19.2 0.0 -19.2Transactions with owners
Dividend distribution
Share-based payments
Hybrid capital 100.0 100.0 100.0Hybrid capital interests after taxesHybrid capital transaction costs after
taxes -0.8 -0.8 -0.8Transactions with owners, total -0.8 0.0 100.0 99.2 0.0 99.2Equity on June 30, 2017 1.0 175.3 -7.6 -0.7 -3.2 100.0 264.8 0.4 265.2
20
Equity attributable to owners of the parent
EUR millionSharecapital
Retainedearnings
Cumulativetranslation
differences
Fairvalue
reserveTreasury
shares Total
Non-controlling
interestTotal
equityEquity on January 1, 2016 1.0 262.8 -6.5 -0.7 -3.2 253.4 0.4 253.7Comprehensive income
Profit for the period -12.9 -12.9 0.0 -12.9 Other comprehensive income:
Change in fair value of definedbenefit pension -0.7 -0.7 -0.7
-Deferred tax 0.0 0.0 0.0Cash flow hedges -0.4 -0.4 -0.4Change in fair value of available forsale assets 0.0 0.0 0.0
Translation differences 0.3 0.3 0.3Comprehensive income, total -13.6 0.3 -0.5 -13.8 0.0 -13.8Transactions with owners
Dividend distribution -35.1 -35.1 -35.1Share-based payments 0.5 0.0 0.5 0.5
Transactions with owners, total -34.6 0.0 -34.6 -34.6Equity on June 30, 2016 1.0 214.6 -6.3 -1.2 -3.2 205.0 0.4 205.4
Equity attributable to owners of the parent
EUR millionSharecapital
Retainedearnings
Cumulativetranslation
differences
Fairvalue
reserveTreasury
shares Total
Non-controlling
interestTotal
equity
Equity on January 1, 2016 1.0 262.8 -6.5 -0.7 -3.2 253.4 0.4 253.7Comprehensive income
Profit for the period -31.7 -31.7 0.0 -31.7 Other comprehensive income:
Change in fair value of definedbenefit pension -4.2 -4.2 -4.2
-Deferred tax 1.3 1.3 1.3Cash flow hedgesChange in fair value of available forsale assets 0.0 0.0 0.0
Translation differences 1.0 1.0 1.0Comprehensive income, total -34.6 1.0 0.0 -33.6 0.0 -33.6Transactions with owners
Dividend distribution -35.1 -35.1 -35.1Share-based payments
Transactions with owners, total -35.1 -35.1 -35.1Equity on December 31, 2016 1.0 193.1 -5.5 -0.7 -3.2 184.7 0.4 185.0

21Condensed consolidated statement of cash flows
EUR million 4-6/2017 4-6/2016 1-6/2017 1-6/2016 1-12/2016Cash flows from operating activitiesNet profit for the period -15.9 -16.1 -18.4 -12.9 -31.7Adjustments to net profit 5.8 4.6 11.4 12.0 32.8Change in working capital -15.9 -0.8 -31.1 -30.2 -23.5Operating cash flow before financial and taxitems -25.9 -12.3 -38.1 -31.1 -22.4Financial items, net -2.6 -0.3 -3.0 -0.8 -2.2Taxes paid 0.1 -4.1 -2.4 -6.1 -12.4Net cash from operating activities -28.4 -16.7 -43.5 -38.0 -37.0
Cash flows from investing activitiesAcquisition of subsidiaries, net of cash 0.0 -2.2 0.0 -2.2 -4.2Capital expenditure and other investments, net -2.4 -14.0 -6.2 -21.9 -33.1Net cash used in investing activities -2.4 -16.2 -6.2 -24.1 -37.4
Cash flow from financing activitiesChange in current liabilities, net -19.3 61.0 -19.3 61.0 34.6Proceeds from borrowings 0.0 0.0 0.0 0.0 80.0Repayments of borrowings -51.0 -11.0 -54.3 -11.0 -24.9Proceeds from financial leasing debts 0.0 0.0 0.0 0.0 2.8Payments of financial leasing debts -0.6 -0.2 -1.2 -0.5 -3.7Hybrid capital 100.0 0.0 100.0 0.0 0.0Hybrid capital costs and interests -1.0 0.0 -1.0 0.0 0.0Dividends paid and other distribution of assets 0.0 -35.0 0.0 -35.0 -35.1Net cash used in financing activities 28.2 14.7 24.3 14.5 53.8
Change in cash and cash equivalents -2.6 -18.2 -25.5 -47.7 -20.6Cash and cash equivalents at the beginning ofthe period 24.7 38.6 47.7 68.1 68.1Change in the foreign exchange rates -2.2 0.0 -2.4 -0.1 0.2Cash and cash equivalents at the end of theperiod 19.8 20.4 19.8 20.4 47.7
Free cash flow
EUR million 4-6/2017 4-6/2016 1-6/2017 1-6/2016 1-12/2016Operating cash flow before financial and taxitems -25.9 -12.3 -38.1 -31.1 -22.4Taxes paid 0.1 -4.1 -2.4 -6.1 -12.4Net cash used in investing activities -2.4 -16.2 -6.2 -24.1 -37.4Free cash flow -28.2 -32.6 -46.7 -61.3 -72.1
22Notes to the Half Yearly Report
1 Accounting principles
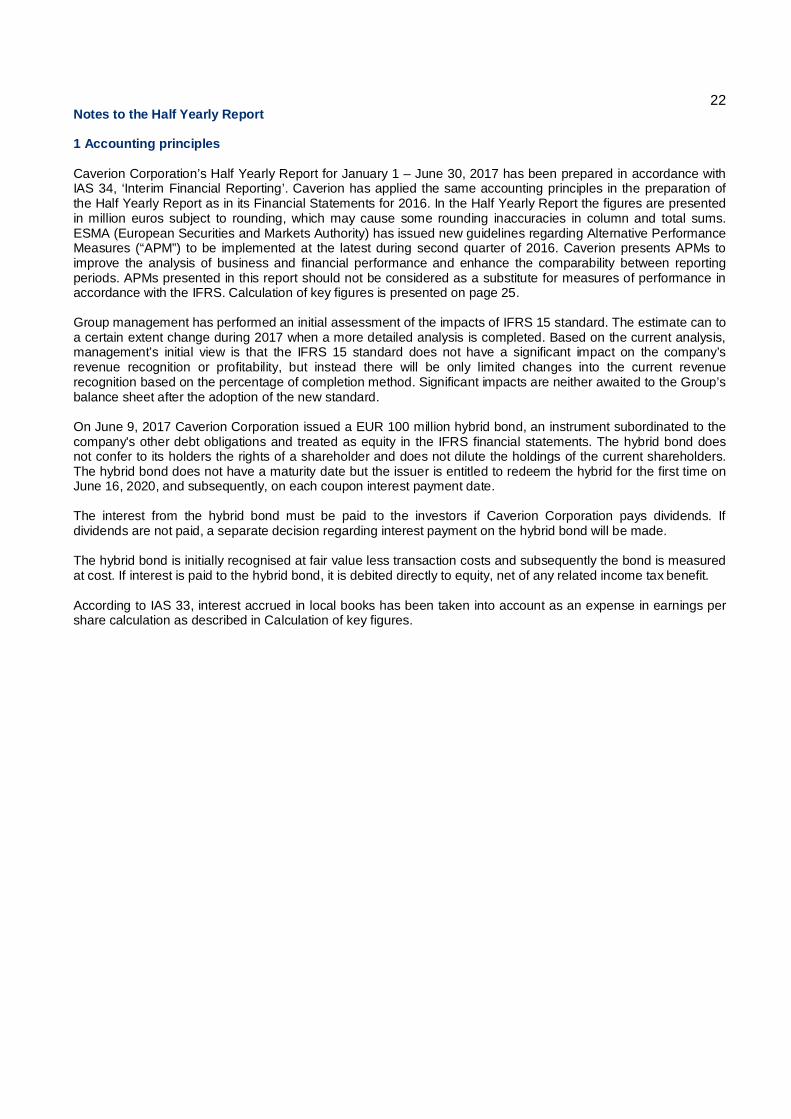
Caverion Corporation’s Half Yearly Report for January 1 – June 30, 2017 has been prepared in accordance withIAS 34, ‘Interim Financial Reporting’. Caverion has applied the same accounting principles in the preparation ofthe Half Yearly Report as in its Financial Statements for 2016. In the Half Yearly Report the figures are presentedin million euros subject to rounding, which may cause some rounding inaccuracies in column and total sums.ESMA (European Securities and Markets Authority) has issued new guidelines regarding Alternative PerformanceMeasures (“APM”) to be implemented at the latest during second quarter of 2016. Caverion presents APMs toimprove the analysis of business and financial performance and enhance the comparability between reportingperiods. APMs presented in this report should not be considered as a substitute for measures of performance inaccordance with the IFRS. Calculation of key figures is presented on page 25.
Group management has performed an initial assessment of the impacts of IFRS 15 standard. The estimate can toa certain extent change during 2017 when a more detailed analysis is completed. Based on the current analysis,management’s initial view is that the IFRS 15 standard does not have a significant impact on the company’srevenue recognition or profitability, but instead there will be only limited changes into the current revenuerecognition based on the percentage of completion method. Significant impacts are neither awaited to the Group’sbalance sheet after the adoption of the new standard.
On June 9, 2017 Caverion Corporation issued a EUR 100 million hybrid bond, an instrument subordinated to thecompany's other debt obligations and treated as equity in the IFRS financial statements. The hybrid bond doesnot confer to its holders the rights of a shareholder and does not dilute the holdings of the current shareholders.The hybrid bond does not have a maturity date but the issuer is entitled to redeem the hybrid for the first time onJune 16, 2020, and subsequently, on each coupon interest payment date.
The interest from the hybrid bond must be paid to the investors if Caverion Corporation pays dividends. Ifdividends are not paid, a separate decision regarding interest payment on the hybrid bond will be made.
The hybrid bond is initially recognised at fair value less transaction costs and subsequently the bond is measuredat cost. If interest is paid to the hybrid bond, it is debited directly to equity, net of any related income tax benefit.
According to IAS 33, interest accrued in local books has been taken into account as an expense in earnings pershare calculation as described in Calculation of key figures.

232 Key figures
6/2017 6/2016 12/2016Revenue, EUR million 1.147,4 1.176,1 2.364,1EBITDA, EUR million -6.2 -2.9 -11.4EBITDA margin, % -0.5 -0.2 -0.5EBITDA excluding restructuring costs, EUR million 0.8 6.6 15.6EBITDA margin excluding restructuring costs, % 0.1 0.6 0.7Operating profit, EUR million -21.3 -16.7 -40.8Operating profit margin, % -1.9 -1.4 -1.7Profit before taxes, EUR million -24.1 -17.4 -43.5 % of revenue -2.1 -1.5 -1.8Profit for the review period, EUR million -18.4 -12.9 -31.7 % of revenue -1.6 -1.1 -1.3
Earnings per share, basic, EUR -0.15 -0.10 -0.25Earnings per share, diluted, EUR -0.15 -0.10 -0.25Equity per share, EUR 2.1 1.6 1.5
Financial income and expenses, net, EUR million -2.8 -0.7 -2.6Equity ratio, % 28.1 21.1 18.7Interest-bearing net debt, EUR million 98.6 130.6 145.5Gearing ratio, % 37.2 63.6 78.7Total assets, EUR million 1.133,0 1.169,7 1.184,3Free cash flow -46.7 -61.3 -72.1Working capital, EUR million 31.0 15.3 -2.6Gross capital expenditures, EUR million 7.9 24.4 38.2% of revenue 0.7 2.1 1.6Order backlog, EUR million 1.512,7 1.554,2 1.408,1Personnel, average for the period 16,740 17,521 17,381
Number of outstanding shares at the end of the period (thousands) 125,084 125,084 125,084Average number of shares (thousands) 125,084 125,084 125,084

243 Financial development by quarter
EUR million4-6/ 1-3/ 10-12/ 7-9/ 4-6/ 1-3/
2017 2017 2016 2016 2016 2016Revenue 565.1 582.3 606.0 582.0 615.5 560.6EBITDA -13.0 6.8 -22.2 13.8 -14.4 11.5EBITDA margin, % -2.3 1.2 -3.7 2.4 -2.3 2.0EBITDA excluding restructuring costs -6.0 6.8 -10.5 19.5 -6.8 -EBITDA margin excluding restructuring costs, % -1.1 1.2 -1.7 3.3 -1.1 -Operating profit -20.5 -0.8 -29.2 5.0 -21.5 4.8Operating profit margin, % -3.6 -0.1 -4.8 0.9 -3.5 0.9
4-6/ 1-3/ 10-12/ 7-9/ 4-6/ 1-3/2017 2017 2016 2016 2016 2016
Earnings per share, basic, EUR -0.13 -0.02 -0.17 0.02 -0.13 0.03Earnings per share, diluted, EUR -0.13 -0.02 -0.17 0.02 -0.13 0.03Equity per share, EUR 2.1 1.5 1.5 1.7 1.6 1.8
Financial income and expenses, net, EUR million -1.6 -1.2 -1.0 -0.9 -0.2 -0.6Equity ratio, % 28.1 19.2 18.7 20.5 21.1 23.5Interest-bearing net debt, EUR million 98.6 164.9 145.5 169.7 130.6 59.2Gearing ratio, % 37.2 90.1 78.7 81.5 63.6 26.7Total assets, EUR million 1,133.0 1,137.3 1,184.3 1,216.0 1,169.7 1,130.6Free cash flow -28.2 -18.5 28.0 -38.8 -32.6 -28.8Working capital, EUR million 31.0 17.3 -2.6 56.1 15.3 15.6Gross capital expenditures, EUR million 2.9 5.0 6.1 7.6 17.3 7.1 % of revenue 0.5 0.9 1.0 1.3 2.8 1.3Order backlog, EUR million 1,512.7 1,543.5 1,408.1 1,450.9 1,554.2 1,589.4Personnel at the end of the period 16,750 16,679 16,913 17,281 17,664 17,499
Number of outstanding shares at end of period(thousands) 125,084 125,084 125,084 125,084 125,084 125,085Average number of shares (thousands) 125,084 125,084 125,084 125,084 125,084 125,086

254 Calculation of key figures
Key figures on financial performance
Equity ratio (%) = Equity + non-controlling interest x 100Total assets - advances received
Gearing ratio (%) = Interest-bearing liabilities - cash and cash equivalents x 100Shareholder’s equity + non-controlling interest
Interest-bearing net debt = Interest-bearing liabilities - cash and cash equivalents
Working capital = Inventories + trade and POC receivables + other current receivables -trade and POC payables - other current payables - advances received -current provisions
Free cash flow = Operating cash flow before financial and tax items – taxes paid – netcash used in investing activities
Share-related key figures
Earnings / share, basic = Net profit for the period (attributable for equity holders) - hybrid capitalexpenses and accrued interests after taxWeighted average number of shares outstanding during the period
Earnings / share, diluted = Net profit for the period (attributable for equity holders) - hybrid capitalexpenses and accrued interests after taxWeighted average dilution adjusted number of shares outstanding duringthe period
Equity / share = Shareholders’ equityNumber of outstanding shares at the end of period
Alternative performance measures(APMs) reported by Caverion
EBITDA = Operating profit (EBIT) + depreciation, amortisation and impairment
EBITDA excluding restructuring costs = Operating profit (EBIT) + depreciation, amortisation and impairment +restructuring costs
5 Financial risk management
Caverion’s main financial risks are liquidity risk, credit risk and market risks including foreign exchange andinterest rate risk. The objectives and principles of financial risk management are defined in the Treasury Policyapproved by the Board of Directors. Financial risk management is carried out by Group Treasury in co-operationwith the subsidiaries.
The objective of capital management in Caverion Group is to maintain an optimal capital structure, maximise thereturn on the respective capital employed and to minimise the cost of capital within the limits and principles statedin the Treasury Policy. The capital structure is modified primarily by directing investments and working capitalemployed.
Caverion’s external loans are subject to a financial covenant based on the ratio of the Group’s net debt toEBITDA. The covenant ratio is continuously monitored and evaluated against actual and forecasted EBITDA andnet debt figures.

26The table below presents the maturity structure of interest-bearing liabilities. The amounts are undiscounted.Cash flows of foreign-denominated liabilities are translated into euro at the reporting date.
EUR million 2017 2018 2019 2020 TotalInterest-bearing liabilities 29.3 29.9 28.7 30.5 118.4
6 Financial assets and liabilities
Those financial assets and liabilities whose carrying amounts do not correspond to their fair values are presentedin the table below.
Jun. 30, 2017 Jun. 30, 2017 Dec. 31, 2016 Dec. 31, 2016
EUR millionCarryingamount Fair value
Carryingamount Fair value
Non-current liabilitiesLoans from financial institutions 59.9 60.5 109.6 111.0Pension loans 11.0 10.8 15.3 15.2Other financial loans 0.5 0.5 0.5 0.5Finance lease liabilities 2.1 2.1 2.1 2.2
Fair values for non-current loans are based on discounted cash flows. The discount rate used is the rate at whichthe Group could draw a similar external loan at the balance sheet date and it consists of a risk-free market rateand a company-specific risk premium in accordance with the maturity of the loan.
The carrying amounts of all other financial assets and liabilities are reasonably close to their fair values.
Derivative instruments
Nominal amountsEUR million Jun. 30, 2017 Dec. 31, 2016--Interest rate derivatives 60.0 70.0--Foreign exchange forwards 51.4 26.9
Fair valuesEUR million Jun. 30, 2017 Dec. 31, 2016--Interest rate derivatives positive fair value negative fair value -0.3 -0.5--Foreign exchange forwards positive fair value 0.4 0.2 negative fair value -0.4 -0.3
The fair values for the derivative instruments have been defined as follows: The fair values of foreign exchangeforward agreements have been defined by using market prices on the closing day. The fair values of interest rateswaps are based on discounted cash flows.
Hedge accounting for interest rate swaps ceased to meet hedge effectiveness criteria and hedge accounting wasdiscontinued during the financial year 2016.

27
7 Commitments and contingent liabilities
EUR million Jun. 30, 2017 Dec. 31, 2016Mortgaged collateral notesGuarantees given on behalf of associated companies 0.2 0.2Parent company’s guarantees on behalf of itssubsidiaries 519.6 533.0Other commitments- Operating leases 168.4 177.5- Other contingent liabilities 0.2 0.2Accrued interest on hybrid bond 0.2
Entities participating in the demerger are jointly and severally responsible for the liabilities of the demerging entitywhich have been generated before the registration of the demerger. As a consequence, a secondary liability up tothe allocated net asset value was generated to Caverion Corporation, incorporated due to the partial demerger ofYIT Corporation, for those liabilities that were generated before the registration of the demerger and remain withYIT Corporation after the demerger. Creditors of YIT Corporation’s major financial liabilities have waived their rightto claim for settlement from Caverion Corporation on the basis of the secondary liability. Caverion Corporation hasa secondary liability relating to the Group guarantees which remain with YIT Corporation after the demerger.These Group guarantees amounted to EUR 265.6 million at the end of June 2017.
The short-term risks and uncertainties relating to the operations have been described above under “Short-termrisks and uncertainties”. It is possible that especially the infringements in compliance may cause considerabledamage to Caverion in terms of fines, civil claims as well as legal expenses. However, the magnitude of thepotential damage cannot be assessed at the moment.

![RUNO Half Yearly Reporting TEMPLATE 4.3 [LIBERIA] PROJECT ...moj.gov.lr/data/uploads/downloads/half-year... · RUNO Half Yearly Reporting TEMPLATE 4.3 [LIBERIA] PROJECT HALF YEARLY](https://img.dokumen.tips/doc/110x75/5fb2e6765197404e462e00b5/runo-half-yearly-reporting-template-43-liberia-project-mojgovlrdatauploadsdownloadshalf-year.jpg)