Embed Size (px)
Citation preview

1
Capital-BudgetingCapital-BudgetingTechniquesTechniques
Chapter 9Chapter 9

2Capital Budgeting ConceptsCapital Budgeting ConceptsCapital Budgeting involves evaluation of (and decision about) projects. Which projects Capital Budgeting involves evaluation of (and decision about) projects. Which projects
should be accepted? Here, our goal is to accept a project which maximizes the shareholder should be accepted? Here, our goal is to accept a project which maximizes the shareholder wealth. Benefits are wealth. Benefits are worthworth more than the cost. more than the cost.
The Capital Budgeting is based on forecasting.The Capital Budgeting is based on forecasting.Estimate future expected cash flows.Estimate future expected cash flows.Evaluate project based on the evaluation method.Evaluate project based on the evaluation method.Classification of ProjectsClassification of Projects
Mutually Exclusive - accept ONE project onlyIndependent - accept ALL profitable projects.

3Capital Budgeting ConceptsCapital Budgeting Concepts
Initial Cash Outlay - amount of capital spent to get Initial Cash Outlay - amount of capital spent to get project going.project going.
Cash FlowsCash Flows

4Capital Budgeting ConceptsCapital Budgeting Concepts
Initial Cash Outlay - amount of capital spent to get Initial Cash Outlay - amount of capital spent to get project going.project going.
If spend $10 million to build new plant then the Initial If spend $10 million to build new plant then the Initial Outlay (IO) = $10 millionOutlay (IO) = $10 million
Cash FlowsCash Flows
CF0 = Cash Flow time 0 = -10 million CF0 = Cash Flow time 0 = -10 million

5Capital Budgeting ConceptsCapital Budgeting Concepts
Initial Cash Outlay - amount of capital spent to get Initial Cash Outlay - amount of capital spent to get project going.project going.
If spend $10 million to build new plant then the Initial If spend $10 million to build new plant then the Initial Outlay (IO) = $10 millionOutlay (IO) = $10 million
Cash FlowsCash Flows
CFn = Sales - Costs CFn = Sales - Costs
Annual Cash Inflows--after-tax CFAnnual Cash Inflows--after-tax CFCash inflows from the project
CF0 = Cash Flow time 0 = -10 million CF0 = Cash Flow time 0 = -10 million
We will determine these in Chapter 10

6Capital Budgeting MethodsCapital Budgeting Methods
Number of years needed to recover your initial Number of years needed to recover your initial outlay.outlay.
Payback PeriodPayback Period
7Capital Budgeting MethodsCapital Budgeting Methods
Number of years needed to recover your initial Number of years needed to recover your initial outlay.outlay.
Payback PeriodPayback Period
P R O J E C TTime A B0 (10,000.) (10,000.)1 3,500 5002 3,500 5003 3,500 4,6004 3,500 10,000

8Capital Budgeting MethodsCapital Budgeting Methods
Number of years needed to recover your initial Number of years needed to recover your initial outlay.outlay.
Payback PeriodPayback Period
0 1 2 3 4
3,500 3,500 3,500 3,500(10,000)
P R O J E C TTime A B0 (10,000.) (10,000.)1 3,500 5002 3,500 5003 3,500 4,6004 3,500 10,000
9Capital Budgeting MethodsCapital Budgeting Methods
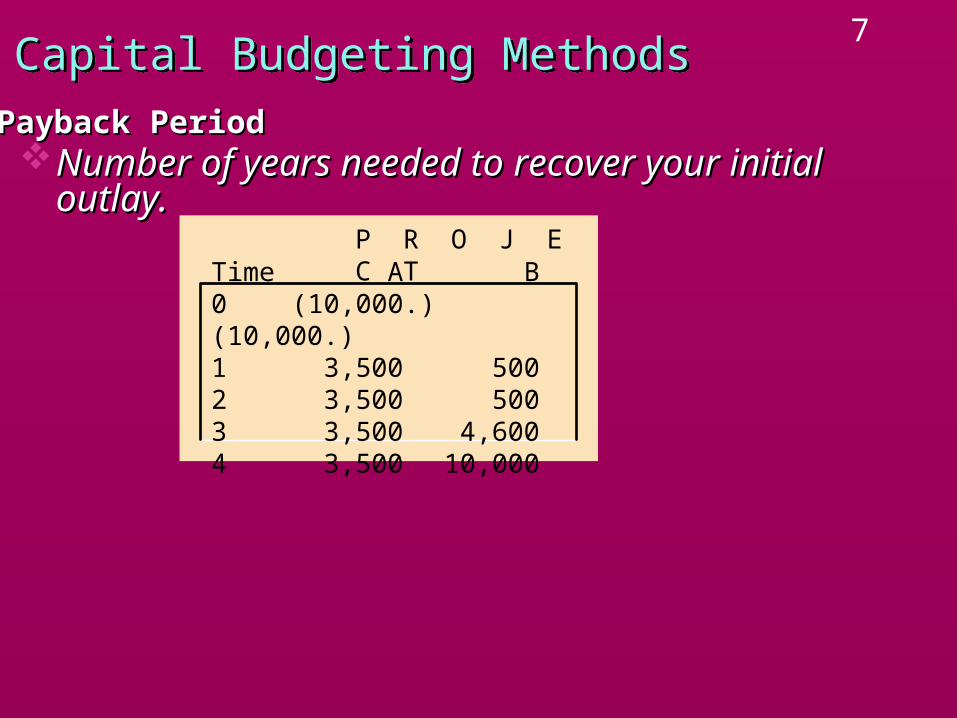
Number of years needed to recover your initial Number of years needed to recover your initial outlay.outlay.
Payback PeriodPayback Period
0 1 2 3 4
3,500-6,500
3,500 3,500 3,500(10,000)Cumulative CF
P R O J E C TTime A B0 (10,000.) (10,000.)1 3,500 5002 3,500 5003 3,500 4,6004 3,500 10,000

10Capital Budgeting MethodsCapital Budgeting Methods
Number of years needed to recover your initial Number of years needed to recover your initial outlay.outlay.
Payback PeriodPayback Period
0 1 2 3 4
3,500-6,500
3,500-3,000
3,500 3,500(10,000)Cumulative CF
P R O J E C TTime A B0 (10,000.) (10,000.)1 3,500 5002 3,500 5003 3,500 4,6004 3,500 10,000

11Capital Budgeting MethodsCapital Budgeting Methods
Number of years needed to recover your initial Number of years needed to recover your initial outlay.outlay.
Payback PeriodPayback Period
0 1 2 3 4
3,500-6,500
3,500-3,000
3,500+500
3,500(10,000)Cumulative CF
P R O J E C TTime A B0 (10,000.) (10,000.)1 3,500 5002 3,500 5003 3,500 4,6004 3,500 10,000

12Capital Budgeting MethodsCapital Budgeting Methods
Number of years needed to recover your initial Number of years needed to recover your initial outlay.outlay.
Payback PeriodPayback Period
0 1 2 3 4
3,500-6,500
3,500-3,000
3,500+500
3,500(10,000)
Payback 2.86 yearsCumulative CF
P R O J E C TTime A B0 (10,000.) (10,000.)1 3,500 5002 3,500 5003 3,500 4,6004 3,500 10,000

13Capital Budgeting MethodsCapital Budgeting Methods
Number of years needed to recover your initial Number of years needed to recover your initial outlay.outlay.
Payback PeriodPayback Period
P R O J E C TTime A B0 (10,000.) (10,000.)1 3,500 5002 3,500 5003 3,500 4,6004 3,500 10,000

14Capital Budgeting MethodsCapital Budgeting Methods
Number of years needed to recover your initial Number of years needed to recover your initial outlay.outlay.
Payback PeriodPayback Period
P R O J E C TTime A B0 (10,000.) (10,000.)1 3,500 5002 3,500 5003 3,500 4,6004 3,500 10,000
0 1 2 3 4
500 500 4,600 10,000(10,000)

15Capital Budgeting MethodsCapital Budgeting Methods
Number of years needed to recover your initial Number of years needed to recover your initial outlay.outlay.
Payback PeriodPayback Period
P R O J E C TTime A B0 (10,000.) (10,000.)1 3,500 5002 3,500 5003 3,500 4,6004 3,500 10,000
0 1 2 3 4
500-9,500
500 4,600 10,000(10,000)Cumulative CF

16Capital Budgeting MethodsCapital Budgeting Methods
Number of years needed to recover your initial Number of years needed to recover your initial outlay.outlay.
Payback PeriodPayback Period
P R O J E C TTime A B0 (10,000.) (10,000.)1 3,500 5002 3,500 5003 3,500 4,6004 3,500 10,000
0 1 2 3 4
500-9,500
500-9,000
4,600 10,000(10,000)Cumulative CF

17Capital Budgeting MethodsCapital Budgeting Methods
Number of years needed to recover your initial Number of years needed to recover your initial outlay.outlay.
Payback PeriodPayback Period
P R O J E C TTime A B0 (10,000.) (10,000.)1 3,500 5002 3,500 5003 3,500 4,6004 3,500 10,000
0 1 2 3 4
500-9,500
500-9,000
4,600-4,400
10,000(10,000)Cumulative CF
18Capital Budgeting MethodsCapital Budgeting Methods
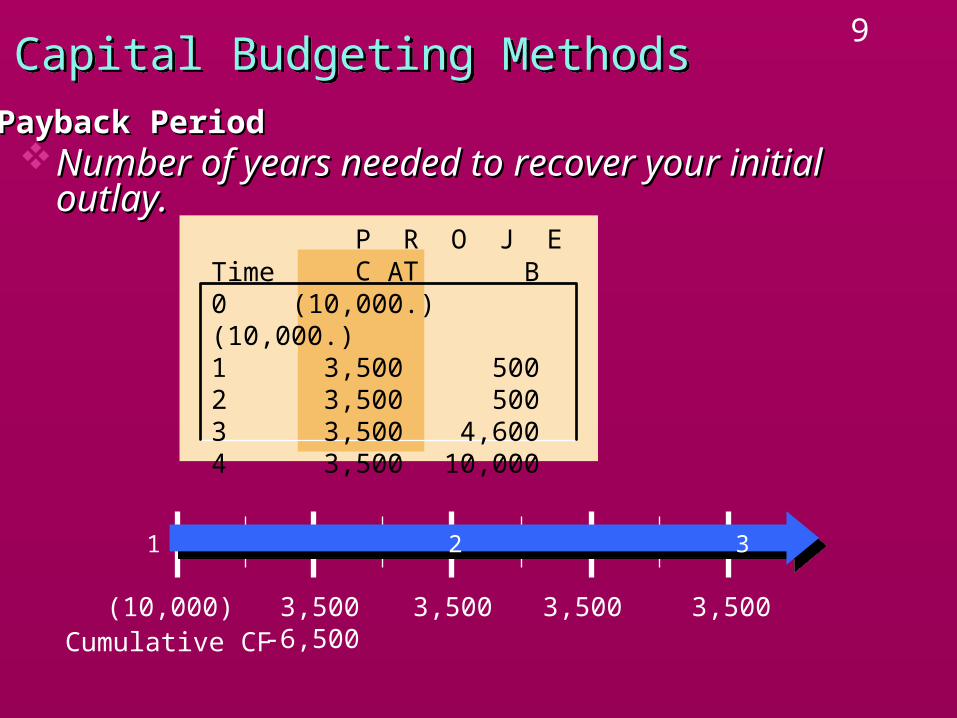
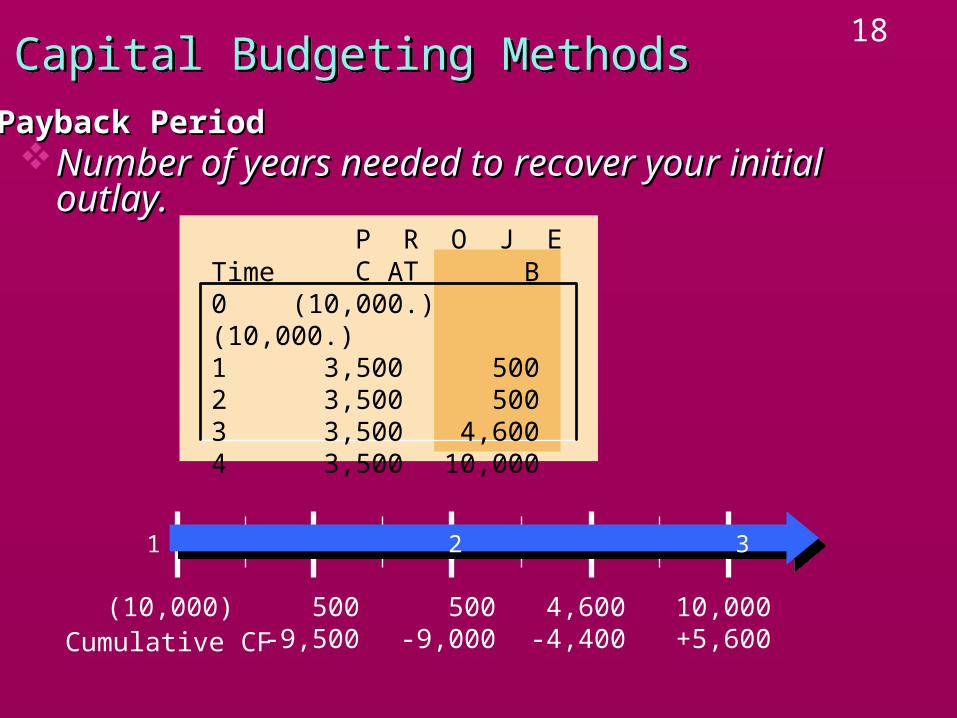
Number of years needed to recover your initial Number of years needed to recover your initial outlay.outlay.
Payback PeriodPayback Period
P R O J E C TTime A B0 (10,000.) (10,000.)1 3,500 5002 3,500 5003 3,500 4,6004 3,500 10,000
0 1 2 3 4
500-9,500
500-9,000
4,600-4,400
10,000+5,600
(10,000)Cumulative CF

19Capital Budgeting MethodsCapital Budgeting Methods
Number of years needed to recover your initial Number of years needed to recover your initial outlay.outlay.
Payback PeriodPayback Period
P R O J E C TTime A B0 (10,000.) (10,000.)1 3,500 5002 3,500 5003 3,500 4,6004 3,500 10,000
0 1 2 3 4
500-9,500
500-9,000
4,600-4,400
10,000+5,600
(10,000)
Payback = 3.44 yearsCumulative CF
20Capital Budgeting MethodsCapital Budgeting Methods
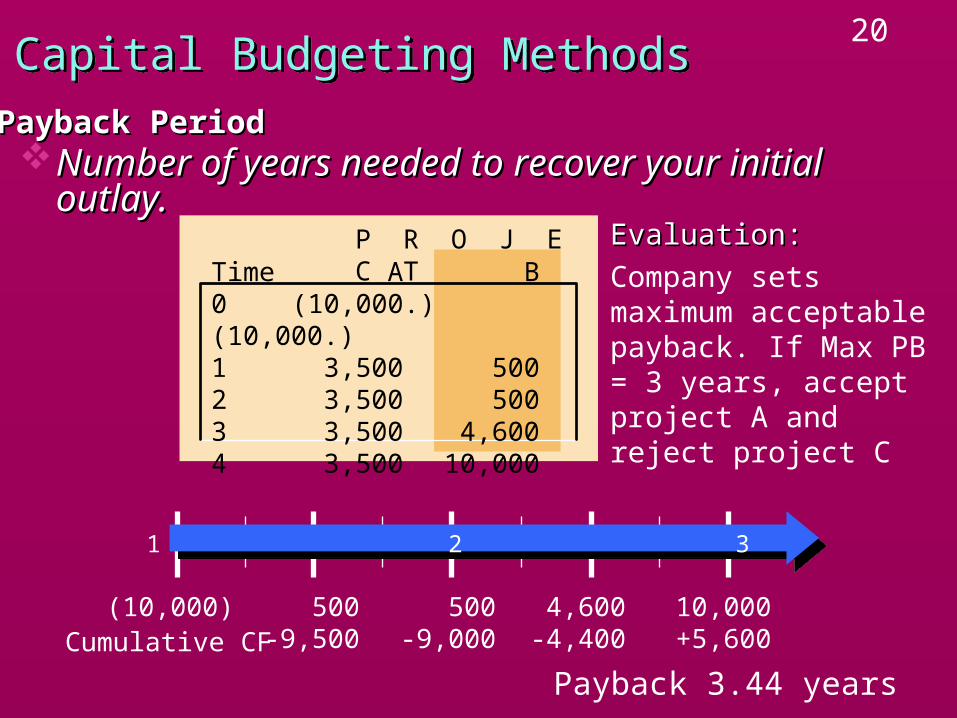
Number of years needed to recover your initial Number of years needed to recover your initial outlay.outlay.
Payback PeriodPayback Period
P R O J E C TTime A B0 (10,000.) (10,000.)1 3,500 5002 3,500 5003 3,500 4,6004 3,500 10,000
0 1 2 3 4
500-9,500
500-9,000
4,600-4,400
10,000+5,600
(10,000)
Payback 3.44 yearsCumulative CF
Evaluation:Evaluation:
Company sets maximum acceptable payback. If Max PB = 3 years, accept project A and reject project C

21•Payback Method•Payback Method
The payback method is not a good method as it does not The payback method is not a good method as it does not consider the time value of money.consider the time value of money.
Which project should you choose?Which project should you choose?
CF0 CF1 CF2 CF3CF0 CF1 CF2 CF3A -100,000 90,000 9,000 1,000A -100,000 90,000 9,000 1,000
B -100,000 1,000 9,000 90,000B -100,000 1,000 9,000 90,000

22•Payback Method•Payback Method
The Discounted payback method can correct this The Discounted payback method can correct this shortcoming of the payback method.shortcoming of the payback method.
To find the discounted pay backTo find the discounted pay back(1) Find the PV of each cash flow on the time line.(1) Find the PV of each cash flow on the time line.(2) Find the payback using the discounted CF and NOT the (2) Find the payback using the discounted CF and NOT the
CF.CF.
Example In Table 9-2Example In Table 9-2

23•Payback Method•Payback Method
Also, the payback method is not a good method as it Also, the payback method is not a good method as it does not consider the cash flows beyond the payback does not consider the cash flows beyond the payback period.period.
24Payback MethodPayback Method
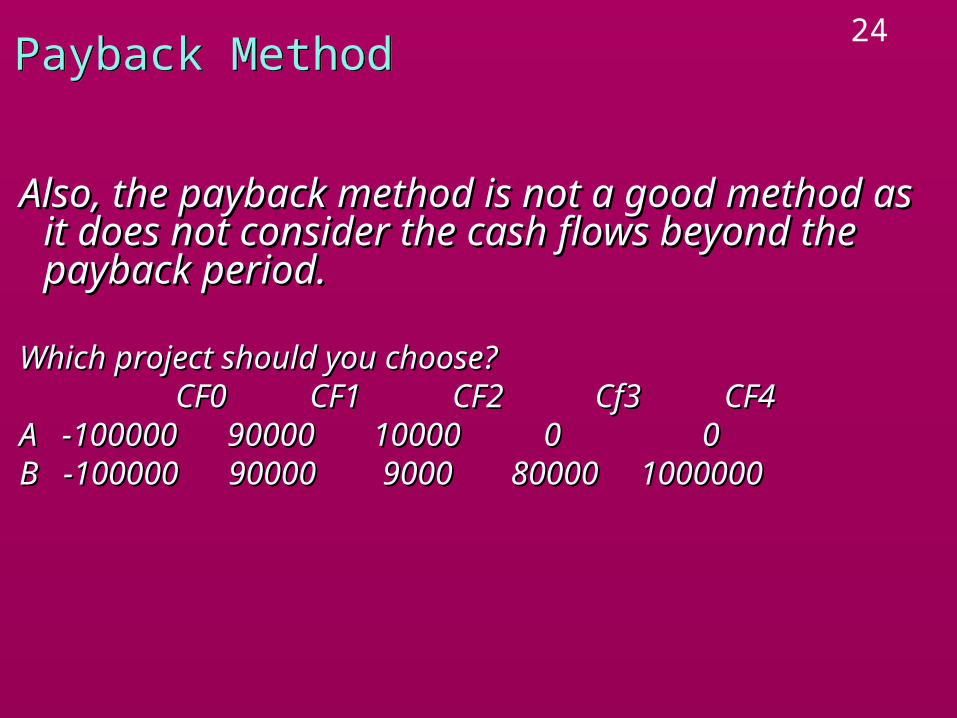
Also, the payback method is not a good method as Also, the payback method is not a good method as it does not consider the cash flows beyond the it does not consider the cash flows beyond the payback period.payback period.
Which project should you choose?Which project should you choose?CF0 CF1 CF2 Cf3 CF4CF0 CF1 CF2 Cf3 CF4
A -100000 90000 10000 0 0A -100000 90000 10000 0 0B -100000 90000 9000 80000 1000000B -100000 90000 9000 80000 1000000

25Payback MethodPayback Method
Also, the payback method is not a good method as it does Also, the payback method is not a good method as it does not consider the cash flows beyond the payback period.not consider the cash flows beyond the payback period.
Which project should you choose?Which project should you choose? CF0 CF1 CF2 Cf3 CF4CF0 CF1 CF2 Cf3 CF4A -100,000 90,000 10,000 0 0A -100,000 90,000 10,000 0 0B -100,000 90,000 9,000 80,000 100,0000B -100,000 90,000 9,000 80,000 100,0000
These two shortcomings often result in an incorrect decisions.These two shortcomings often result in an incorrect decisions.

26Capital Budgeting MethodsCapital Budgeting Methods
Methods that consider time value of money and all Methods that consider time value of money and all cash flowscash flows
Net Present Value:Net Present Value:Present Value of all costs and benefits of a project.Present Value of all costs and benefits of a project.

27Capital Budgeting MethodsCapital Budgeting Methods
Present Value of all costs and benefits of a project.Present Value of all costs and benefits of a project.Concept is similar to Intrinsic Value of a security but Concept is similar to Intrinsic Value of a security but
subtracts cost of the project.subtracts cost of the project.
Net Present ValueNet Present Value
NPV = PV of Inflows - Initial Outlay NPV = PV of Inflows - Initial Outlay
28Capital Budgeting MethodsCapital Budgeting Methods
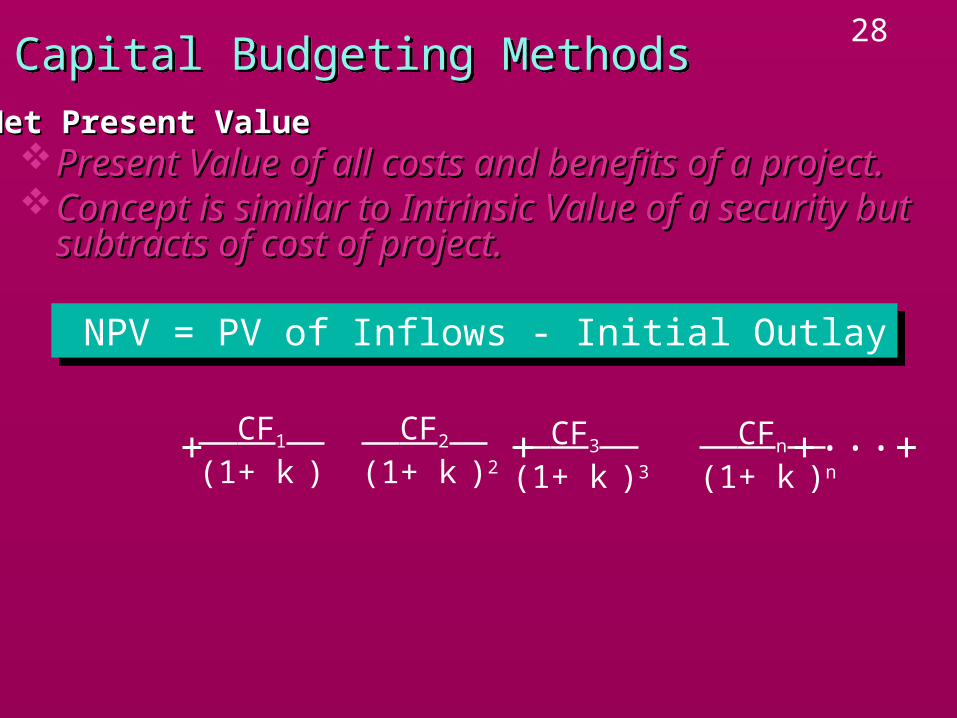
Present Value of all costs and benefits of a project.Present Value of all costs and benefits of a project.Concept is similar to Intrinsic Value of a security but Concept is similar to Intrinsic Value of a security but
subtracts of cost of project.subtracts of cost of project.
Net Present ValueNet Present Value
NPV = PV of Inflows - Initial Outlay NPV = PV of Inflows - Initial Outlay
NPV = + + +···+ – IO CF1 (1+ k )
CF2 (1+ k )2
CF3 (1+ k )3
CFn (1+ k )n

29Capital Budgeting MethodsCapital Budgeting Methods
Net Present ValueNet Present Value
0 1 2 3 4
500 500 4,600 10,000(10,000)
k=10%
P R O J E C TTime A B0 (10,000.) (10,000.)1 3,500 5002 3,500 5003 3,500 4,6004 3,500 10,000

30Capital Budgeting MethodsCapital Budgeting Methods
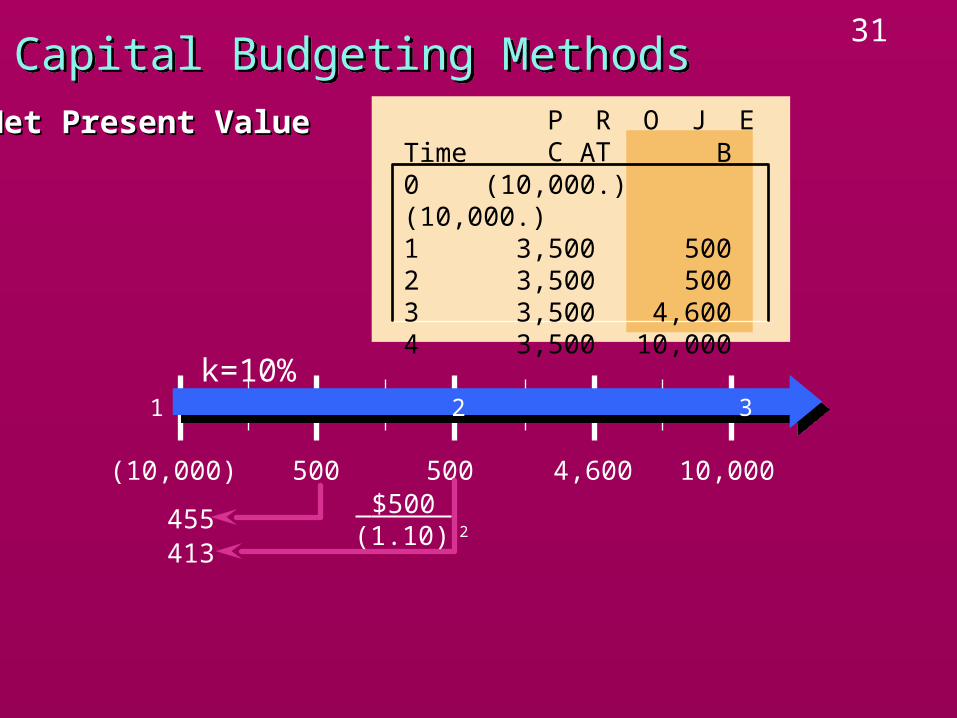
Net Present ValueNet Present Value
0 1 2 3 4
500 500 4,600 10,000(10,000)
455
k=10%
$500 (1.10)
P R O J E C TTime A B0 (10,000.) (10,000.)1 3,500 5002 3,500 5003 3,500 4,6004 3,500 10,000
31Capital Budgeting MethodsCapital Budgeting Methods
Net Present ValueNet Present Value
0 1 2 3 4
500 500 4,600 10,000(10,000)
455413
k=10%
$500 (1.10) 2
P R O J E C TTime A B0 (10,000.) (10,000.)1 3,500 5002 3,500 5003 3,500 4,6004 3,500 10,000
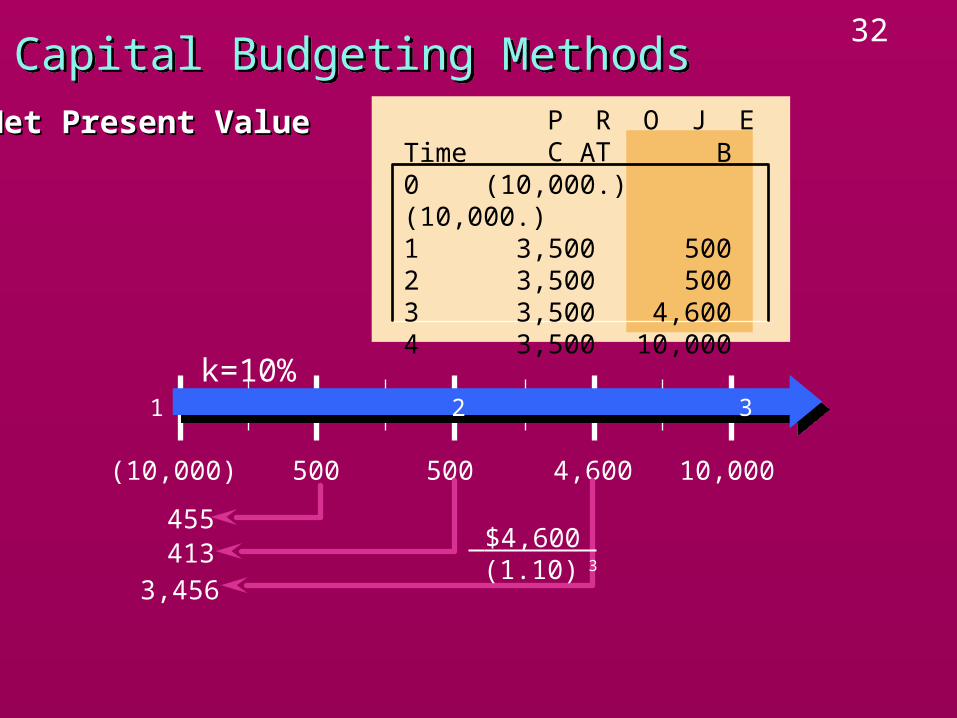
32Capital Budgeting MethodsCapital Budgeting Methods
Net Present ValueNet Present Value
0 1 2 3 4
500 500 4,600 10,000(10,000)
455413
3,456
k=10%
$4,600 (1.10) 3
P R O J E C TTime A B0 (10,000.) (10,000.)1 3,500 5002 3,500 5003 3,500 4,6004 3,500 10,000

33Capital Budgeting MethodsCapital Budgeting Methods
Net Present ValueNet Present Value
0 1 2 3 4
500 500 4,600 10,000(10,000)
455
6,830
4133,456
k=10%
$10,000 (1.10) 4
P R O J E C TTime A B0 (10,000.) (10,000.)1 3,500 5002 3,500 5003 3,500 4,6004 3,500 10,000
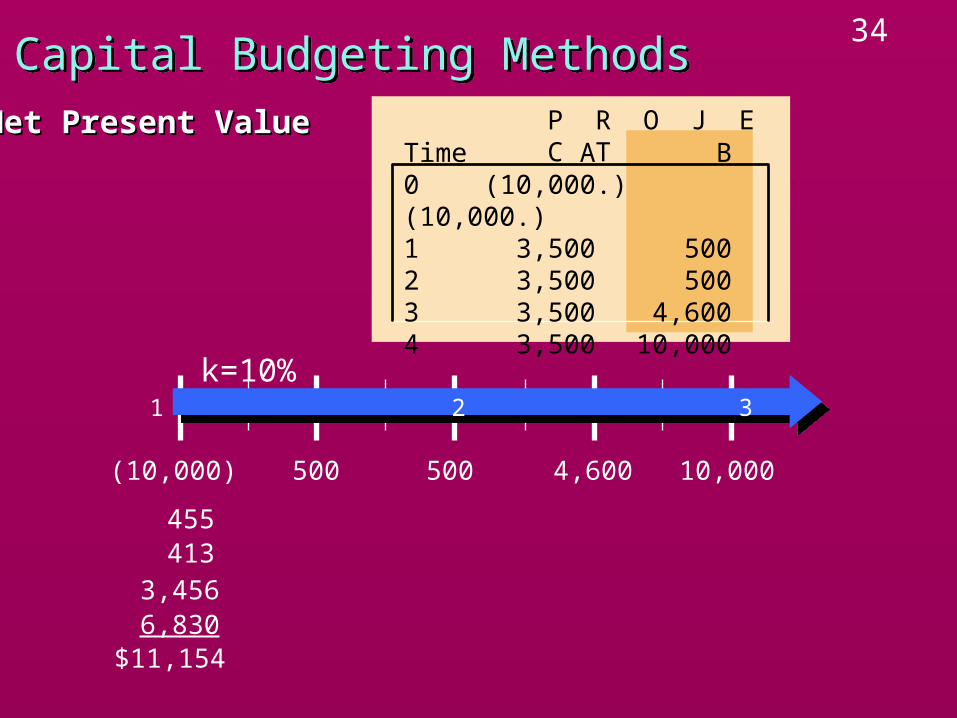
34Capital Budgeting MethodsCapital Budgeting Methods
Net Present ValueNet Present Value
0 1 2 3 4
500 500 4,600 10,000(10,000)
455
$11,1546,830
4133,456
k=10%
P R O J E C TTime A B0 (10,000.) (10,000.)1 3,500 5002 3,500 5003 3,500 4,6004 3,500 10,000
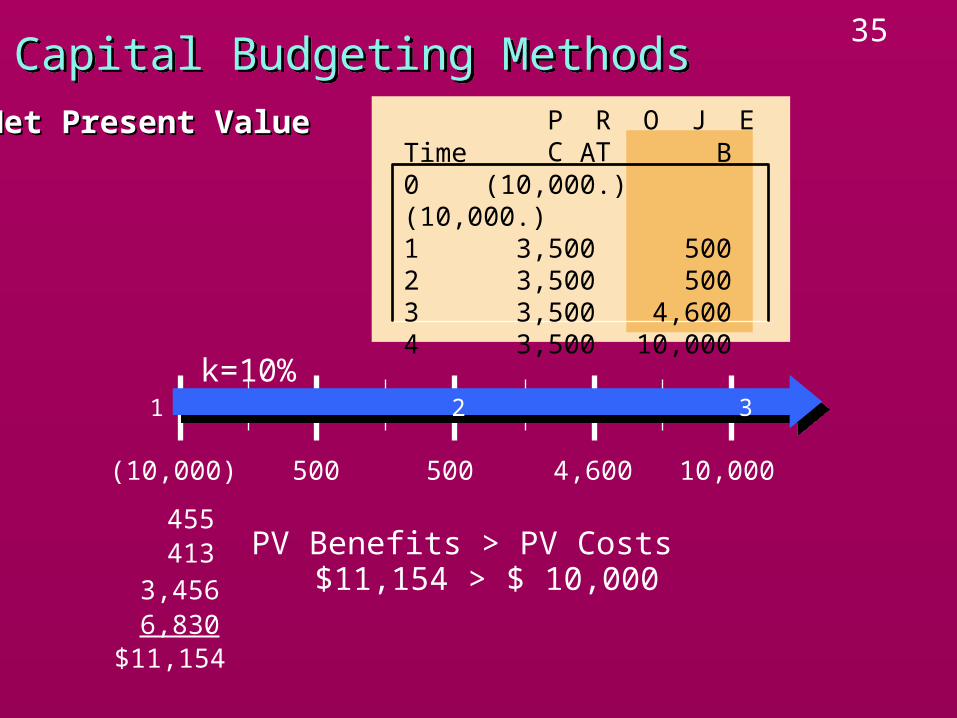
35Capital Budgeting MethodsCapital Budgeting Methods
Net Present ValueNet Present Value
0 1 2 3 4
500 500 4,600 10,000(10,000)
455
6,830
4133,456
k=10%
PV Benefits > PV Costs
P R O J E C TTime A B0 (10,000.) (10,000.)1 3,500 5002 3,500 5003 3,500 4,6004 3,500 10,000
$11,154 > $ 10,000
$11,154

36Capital Budgeting MethodsCapital Budgeting Methods
Net Present ValueNet Present Value
0 1 2 3 4
500 500 4,600 10,000(10,000)
455
6,830
4133,456
k=10%
PV Benefits > PV Costs
P R O J E C TTime A B0 (10,000.) (10,000.)1 3,500 5002 3,500 5003 3,500 4,6004 3,500 10,000
$11,154 > $ 10,000NPV > $0
$1,154 > $0
$11,154
$1,154 = NPV

37Capital Budgeting MethodsCapital Budgeting Methods
Net Present ValueNet Present Value
0 1 2 3 4
3,500(10,000)
k=10%
3,500 3,500 3,500
P R O J E C TTime A B0 (10,000.) (10,000.)1 3,500 5002 3,500 5003 3,500 4,6004 3,500 10,000
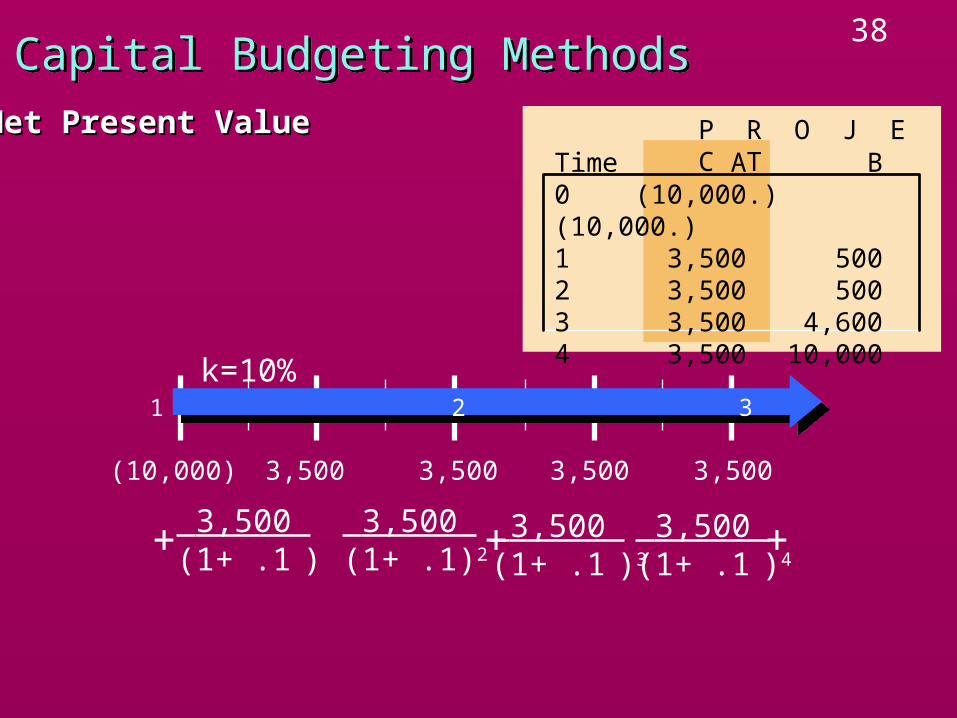
38Capital Budgeting MethodsCapital Budgeting Methods
Net Present ValueNet Present Value
0 1 2 3 4
3,500(10,000)
k=10%
3,500 3,500 3,500
NPV = + + + – 10,000 3,500 (1+ .1 )
3,500 (1+ .1)2
3,500 (1+ .1 )3
3,500 (1+ .1 )4
P R O J E C TTime A B0 (10,000.) (10,000.)1 3,500 5002 3,500 5003 3,500 4,6004 3,500 10,000
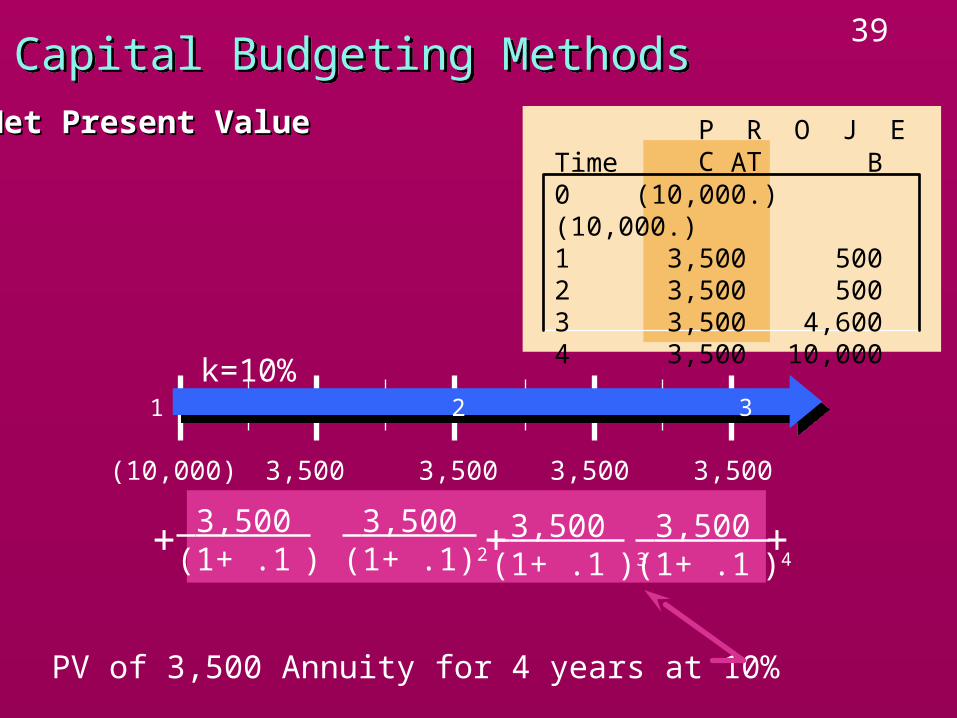
39Capital Budgeting MethodsCapital Budgeting Methods
Net Present ValueNet Present Value
0 1 2 3 4
3,500(10,000)
k=10%
3,500 3,500 3,500
NPV = + + + – 10,000 3,500 (1+ .1 )
3,500 (1+ .1)2
3,500 (1+ .1 )3
3,500 (1+ .1 )4
PV of 3,500 Annuity for 4 years at 10%
P R O J E C TTime A B0 (10,000.) (10,000.)1 3,500 5002 3,500 5003 3,500 4,6004 3,500 10,000
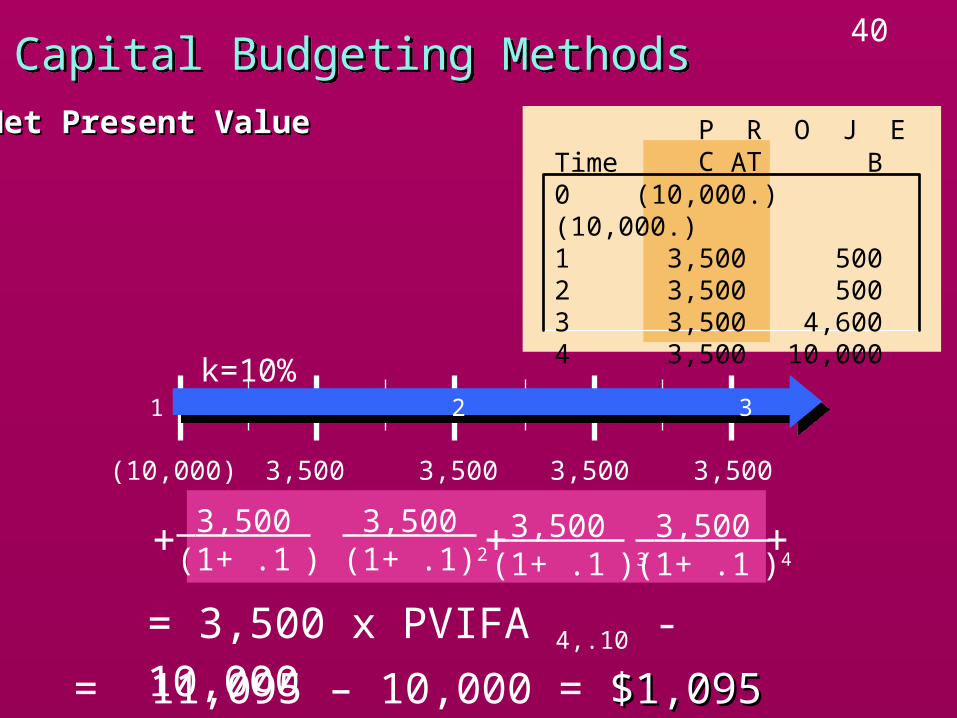
40Capital Budgeting MethodsCapital Budgeting Methods
Net Present ValueNet Present Value
0 1 2 3 4
3,500(10,000)
k=10%
3,500 3,500 3,500
NPV = + + + – 10,000 3,500 (1+ .1 )
3,500 (1+ .1)2
3,500 (1+ .1 )3
3,500 (1+ .1 )4
= 3,500 x PVIFA 4,.10 - 10,000
P R O J E C TTime A B0 (10,000.) (10,000.)1 3,500 5002 3,500 5003 3,500 4,6004 3,500 10,000
= 11,095 – 10,000 = $1,095$1,095

41Capital Budgeting MethodsCapital Budgeting Methods
If projects are independent then If projects are independent then accept all projects with NPV accept all projects with NPV 0. 0.
NPV Decision RulesNPV Decision Rules
ACCEPT A & B

42Capital Budgeting MethodsCapital Budgeting Methods
If projects are independent then If projects are independent then accept all projects with NPV accept all projects with NPV 0. 0.
If projects are mutually exclusive, If projects are mutually exclusive, accept projects with higher NPV.accept projects with higher NPV.
NPV Decision RulesNPV Decision Rules
ACCEPT A & B
ACCEPT B only
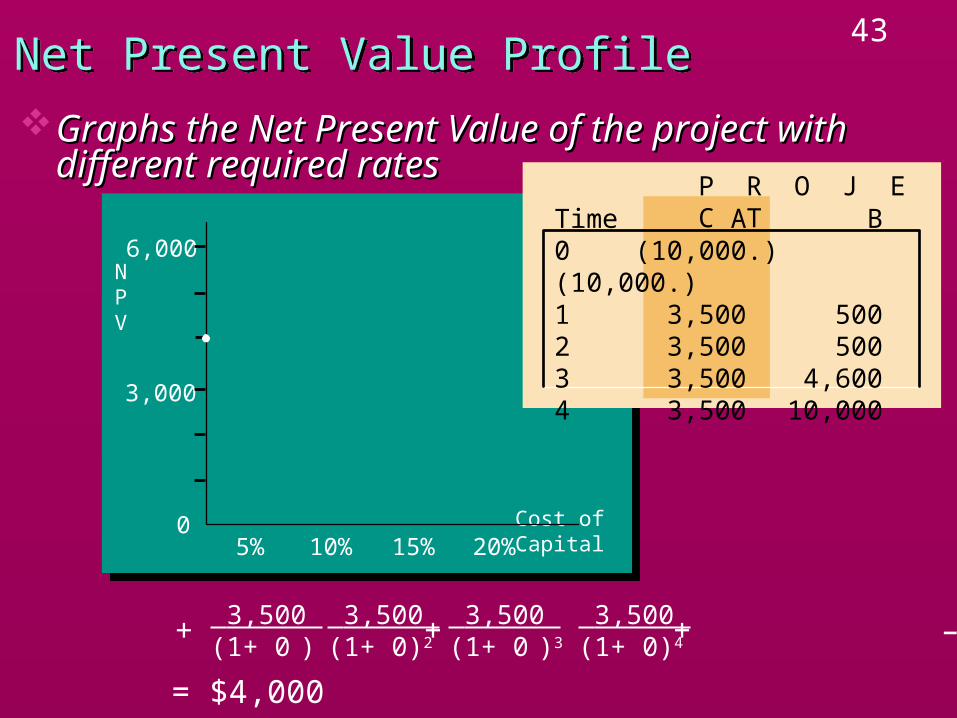
43
10%5%0 Cost of Capital
NPV
6,000
3,000
20%15%
Net Present Value ProfileNet Present Value Profile
Graphs the Net Present Value of the project with Graphs the Net Present Value of the project with different required ratesdifferent required rates
NPV(0%) = + + + – 10,000 3,500 (1+ 0 )
3,500 (1+ 0)2
3,500 (1+ 0 )3
3,500 (1+ 0)4
= $4,000
P R O J E C TTime A B0 (10,000.) (10,000.)1 3,500 5002 3,500 5003 3,500 4,6004 3,500 10,000

44
10%5%0 Cost of Capital
NPV
6,000
3,000
20%15%
Net Present Value ProfileNet Present Value Profile
Graphs the Net Present Value of the project with Graphs the Net Present Value of the project with different required ratesdifferent required rates
NPV(5%) = + + + – 10,000 3,500 (1+ .05 )
3,500 (1+ .05)2
3,500 (1+ .05 )3
3,500 (1+ .05)4
= $2,411
P R O J E C TTime A B0 (10,000.) (10,000.)1 3,500 5002 3,500 5003 3,500 4,6004 3,500 10,000

45
10%5%0 Cost of Capital
NPV
6,000
3,000
20%15%
Net Present Value ProfileNet Present Value Profile
Graphs the Net Present Value of the project with Graphs the Net Present Value of the project with different required ratesdifferent required rates
NPV(10%) = + + + – 10,000 3,500 (1+ .10 )
3,500 (1+ .10)2
3,500 (1+ .10 )3
3,500 (1+ .10)4
= $1,095
P R O J E C TTime A B0 (10,000.) (10,000.)1 3,500 5002 3,500 5003 3,500 4,6004 3,500 10,000

46
10%5%0 Cost of Capital
NPV
6,000
3,000
20%15%
Net Present Value ProfileNet Present Value Profile
Graphs the Net Present Value of the project with Graphs the Net Present Value of the project with different required ratesdifferent required rates
NPV(15%) = + + + – 10,000 3,500 (1+ .15 )
3,500 (1+ .15)2
3,500 (1+ .15 )3
3,500 (1+ .15)4
= – $7.58
P R O J E C TTime A B0 (10,000.) (10,000.)1 3,500 5002 3,500 5003 3,500 4,6004 3,500 10,000

47
10%5%0 Cost of Capital
NPV
6,000
3,000
20%15%
Net Present Value ProfileNet Present Value Profile
Graphs the Net Present Value of the project with Graphs the Net Present Value of the project with different required ratesdifferent required rates
NPV(20%) = + + + – 10,000 3,500 (1+ .20 )
3,500 (1+ .20)2
3,500 (1+ .20 )3
3,500 (1+ .20)4
= – $939
P R O J E C TTime A B0 (10,000.) (10,000.)1 3,500 5002 3,500 5003 3,500 4,6004 3,500 10,000

48
10%5%0 Cost of Capital
NPV
6,000
3,000
20%15%
Net Present Value ProfileNet Present Value Profile
Graphs the Net Present Value of the project with Graphs the Net Present Value of the project with different required ratesdifferent required rates
Connect the Points
P R O J E C TTime A B0 (10,000.) (10,000.)1 3,500 5002 3,500 5003 3,500 4,6004 3,500 10,000

49
10%5%0 Cost of Capital
NPV
6,000
3,000
20%15%
Net Present Value ProfileNet Present Value Profile
Graphs the Net Present Value of the project with Graphs the Net Present Value of the project with different required ratesdifferent required rates
P R O J E C TTime A B0 (10,000.) (10,000.)1 3,500 5002 3,500 5003 3,500 4,6004 3,500 10,000
NPV(0%) = + + + – 10,000 500 (1+ 0 )
500 (1+ 0)2
4,600 (1+ 0 )3
10,000 (1+ 0)4
= $5,600

50
10%5%0 Cost of Capital
NPV
6,000
3,000
20%15%
Net Present Value ProfileNet Present Value Profile
Graphs the Net Present Value of the project with Graphs the Net Present Value of the project with different required ratesdifferent required rates
P R O J E C TTime A B0 (10,000.) (10,000.)1 3,500 5002 3,500 5003 3,500 4,6004 3,500 10,000
NPV(5%) = + + + – 10,000 500 (1+.05)
500 (1+.05)2
4,600 (1+ .05)3
10,000 (1+ .05)4
= $3,130

51
10%5%0 Cost of Capital
NPV
6,000
3,000
20%15%
Net Present Value ProfileNet Present Value Profile
Graphs the Net Present Value of the project with Graphs the Net Present Value of the project with different required ratesdifferent required rates
P R O J E C TTime A B0 (10,000.) (10,000.)1 3,500 5002 3,500 5003 3,500 4,6004 3,500 10,000
NPV(10%) = + + + – 10,000 500 (1+.10)
500 (1+.10)2
4,600 (1+ .10)3
10,000 (1+ .10)4
= $1.154

52
10%5%0 Cost of Capital
NPV
6,000
3,000
20%15%
Net Present Value ProfileNet Present Value Profile
Graphs the Net Present Value of the project with Graphs the Net Present Value of the project with different required ratesdifferent required rates
P R O J E C TTime A B0 (10,000.) (10,000.)1 3,500 5002 3,500 5003 3,500 4,6004 3,500 10,000
NPV(15%) = + + + – 10,000 500 (1+.15)
500 (1+.15)2
4,600 (1+ .15)3
10,000 (1+ .15)4
= –$445

53
10%5%0 Cost of Capital
NPV
6,000
3,000
20%15%
Project B
Net Present Value ProfileNet Present Value Profile
Graphs the Net Present Value of the project with Graphs the Net Present Value of the project with different required ratesdifferent required rates
P R O J E C TTime A B0 (10,000.) (10,000.)1 3,500 5002 3,500 5003 3,500 4,6004 3,500 10,000
Connect the Points

54
10%5%0 Cost of Capital
NPV
6,000
3,000
20%15%
Project B
Net Present Value ProfileNet Present Value Profile
Graphs the Net Present Value of the project with Graphs the Net Present Value of the project with different required ratesdifferent required rates
P R O J E C TTime A B0 (10,000.) (10,000.)1 3,500 5002 3,500 5003 3,500 4,6004 3,500 10,000

55Net Present Value ProfileNet Present Value Profile
Compare NPV of the two projects for different Compare NPV of the two projects for different required ratesrequired rates
10%5%0 Cost of Capital
NPV
6,000
3,000
20%15%
Project B
Crossover point
Project A

56Net Present Value ProfileNet Present Value Profile
Compare NPV of the two projects for different Compare NPV of the two projects for different required ratesrequired rates
10%5%0 Cost of Capital
NPV
6,000
3,000
20%15%
Project B
Crossover point
Project AFor any discount rate < crossover point choose B

57Net Present Value ProfileNet Present Value Profile
Compare NPV of the two projects for different Compare NPV of the two projects for different required ratesrequired rates
10%5%0 Cost of Capital
NPV
6,000
3,000
20%15%
Project B
Crossover point
For any discount rate > crossover point choose A
Project AFor any discount rate < crossover point choose B

58Capital Budgeting MethodsCapital Budgeting Methods
Internal Rate of ReturnInternal Rate of ReturnMeasures the rate of return that will make the PV of future CF Measures the rate of return that will make the PV of future CF
equal to the initial outlay. equal to the initial outlay.
Definition:The IRR is that discount rate at which NPV = 0
IRR is like the YTM. It is the same cocept but the term YTM is used only for bonds.

59Capital Budgeting MethodsCapital Budgeting Methods
Internal Rate of ReturnInternal Rate of ReturnMeasures the rate of return that will make the PV of future CF Measures the rate of return that will make the PV of future CF
equal to the initial outlay. equal to the initial outlay.
The IRR is the discount rate at which NPV = 0
10%5%0 Cost of Capital
NPV
6,000
3,000
20%15%
Project B
NPV = $0

60Capital Budgeting MethodsCapital Budgeting Methods
Internal Rate of ReturnInternal Rate of ReturnMeasures the rate of return that will make the PV of future CF Measures the rate of return that will make the PV of future CF
equal to the initial outlay.equal to the initial outlay.
Or, the IRR is the discount rate at which NPV = 0
10%5%0 Cost of Capital
NPV
6,000
3,000
20%15%
Project B
NPV = $0 IRRA 15%
IRRB 14%

61Capital Budgeting MethodsCapital Budgeting Methods
Internal Rate of ReturnInternal Rate of Return
Determine the mathematical solution for IRRDetermine the mathematical solution for IRR

62Capital Budgeting MethodsCapital Budgeting Methods
Internal Rate of ReturnInternal Rate of Return
Determine the mathematical solution for IRRDetermine the mathematical solution for IRR
0 = NPV = + +···+ – IO CF1 (1+ IRR )
CF2 (1+ IRR )2
CFn (1+ IRR )n

63Capital Budgeting MethodsCapital Budgeting Methods
Internal Rate of ReturnInternal Rate of Return
Determine the mathematical solution for IRRDetermine the mathematical solution for IRR
0 = NPV = + +···+ – IO CF1 (1+ IRR )
CF2 (1+ IRR )2
CFn (1+ IRR )n
IO = + +···+ CF1 (1+ IRR )
CF2 (1+ IRR )2
CFn (1+ IRR )n
Outflow = PV of Inflows

64Capital Budgeting MethodsCapital Budgeting Methods
Internal Rate of ReturnInternal Rate of Return
Determine the mathematical solution for IRRDetermine the mathematical solution for IRR
0 = NPV = + +···+ – IO CF1 (1+ IRR )
CF2 (1+ IRR )2
CFn (1+ IRR )n
IO = + +···+ CF1 (1+ IRR )
CF2 (1+ IRR )2
CFn (1+ IRR )n
Outflow = PV of Inflows
Solve for Discount Rates

65Capital Budgeting MethodsCapital Budgeting Methods
Internal Rate of ReturnInternal Rate of ReturnFor Project BFor Project B
Cannot solve for IRRdirectly, must use Trial & Error
10,000 = + + + 500 (1+ IRR )
500 (1+ IRR )2
10,000 (1+ IRR )4
4,600 (1+ IRR )3
10%5%0 Cost of Capital
NPV
6,000
3,000
20%15%
Project B
IRRB 14%
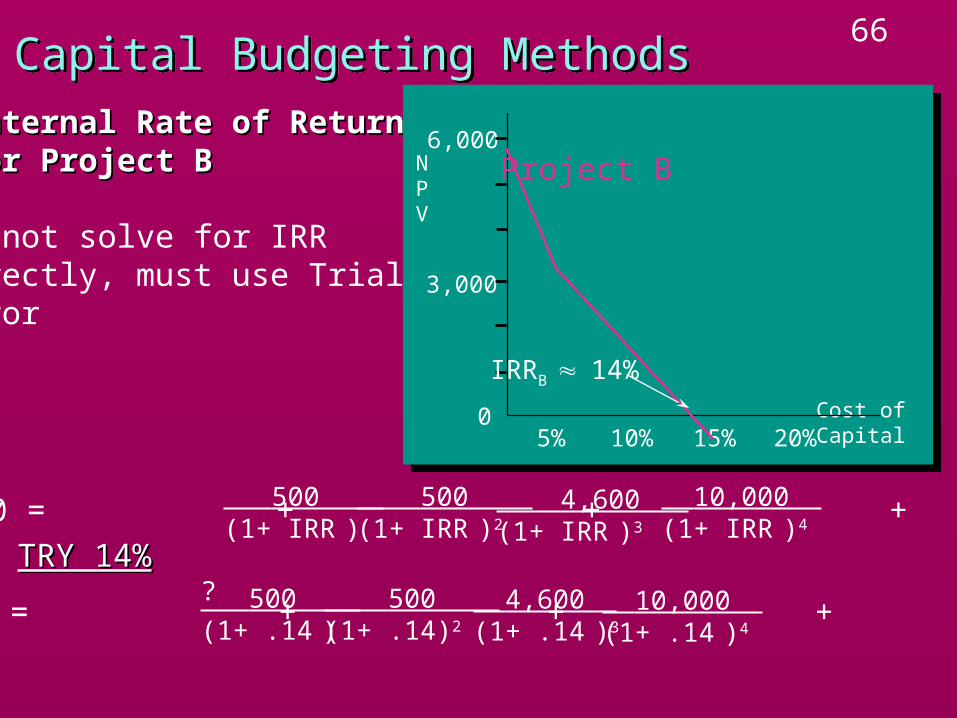
66Capital Budgeting MethodsCapital Budgeting Methods
Internal Rate of ReturnInternal Rate of ReturnFor Project BFor Project B
Cannot solve for IRRdirectly, must use Trial & Error
10,000 = + + + 500 (1+ IRR )
500 (1+ IRR )2
10,000 (1+ IRR )4
4,600 (1+ IRR )3
TRY 14%TRY 14%
10,000 = + + + 500 (1+ .14 )
500 (1+ .14)2
10,000 (1+ .14 )4
4,600 (1+ .14 )3
?
10%5%0 Cost of Capital
NPV
6,000
3,000
20%15%
Project B
IRRB 14%

67Capital Budgeting MethodsCapital Budgeting Methods
Internal Rate of ReturnInternal Rate of ReturnFor Project BFor Project B
Cannot solve for IRRdirectly, must use Trial & Error
10,000 = + + + 500 (1+ IRR )
500 (1+ IRR )2
10,000 (1+ IRR )4
4,600 (1+ IRR )3
TRY 14%TRY 14%
10,000 = + + + 500 (1+ .14 )
500 (1+ .14)2
10,000 (1+ .14 )4
4,600 (1+ .14 )3
?
10,000 = 9,849?
PV of Inflows too low, try lower rate
10%5%0 Cost of Capital
NPV
6,000
3,000
20%15%
Project B
IRRB 14%

68Capital Budgeting MethodsCapital Budgeting Methods
Internal Rate of ReturnInternal Rate of ReturnFor Project BFor Project B
Cannot solve for IRRdirectly, must use Trial & Error
10,000 = + + + 500 (1+ IRR )
500 (1+ IRR )2
10,000 (1+ IRR )4
4,600 (1+ IRR )3
TRY 13%TRY 13%
10,000 = + + + 500 (1+ .13 )
500 (1+ .13)2
10,000 (1+ .13 )4
4,600 (1+ .13 )3
?
10%5%0 Cost of Capital
NPV
6,000
3,000
20%15%
Project B
IRRB 14%

69Capital Budgeting MethodsCapital Budgeting Methods
Internal Rate of ReturnInternal Rate of ReturnFor Project BFor Project B
Cannot solve for IRRdirectly, must use Trial & Error
10,000 = + + + 500 (1+ IRR )
500 (1+ IRR )2
10,000 (1+ IRR )4
4,600 (1+ IRR )3
TRY 13%TRY 13%
10,000 = + + + 500 (1+ .13 )
500 (1+ .13)2
10,000 (1+ .13 )4
4,600 (1+ .13 )3
?
10,000 = 10,155?
10%5%0 Cost of Capital
NPV
6,000
3,000
20%15%
Project B
IRRB 14%
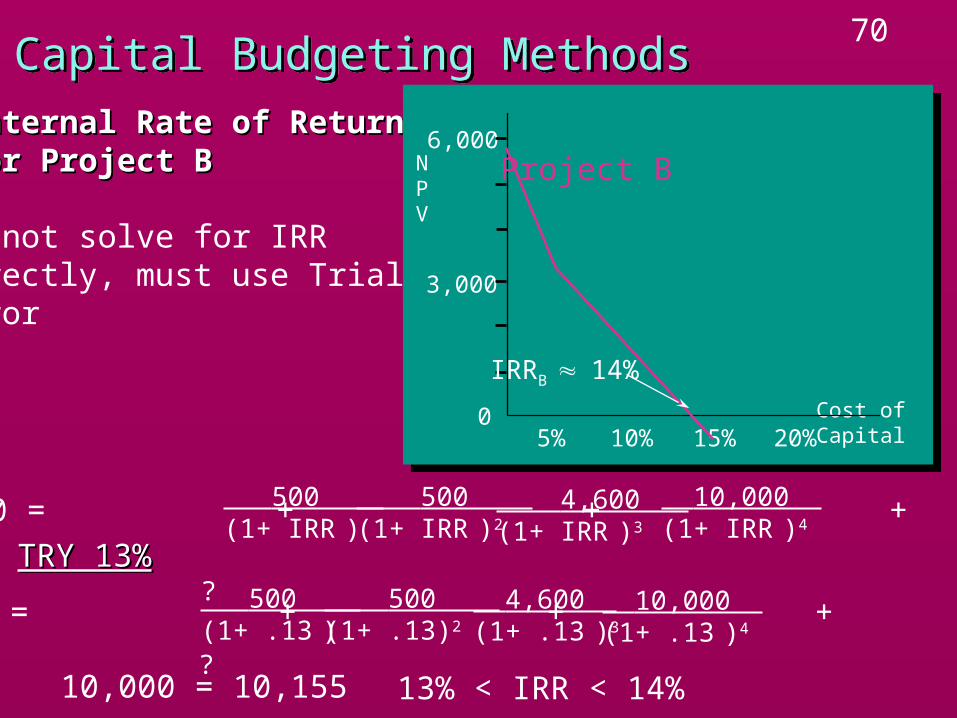
70Capital Budgeting MethodsCapital Budgeting Methods
Internal Rate of ReturnInternal Rate of ReturnFor Project BFor Project B
Cannot solve for IRRdirectly, must use Trial & Error
10,000 = + + + 500 (1+ IRR )
500 (1+ IRR )2
10,000 (1+ IRR )4
4,600 (1+ IRR )3
TRY 13%TRY 13%
10,000 = + + + 500 (1+ .13 )
500 (1+ .13)2
10,000 (1+ .13 )4
4,600 (1+ .13 )3
?
10,000 = 10,155?
13% < IRR < 14%
10%5%0 Cost of Capital
NPV
6,000
3,000
20%15%
Project B
IRRB 14%

71Capital Budgeting MethodsCapital Budgeting MethodsDecision Rule for Internal Rate of ReturnDecision Rule for Internal Rate of Return
Independent ProjectsAccept Projects with IRR required rate
Mutually Exclusive ProjectsAccept project with highest IRR required rate

72Capital Budgeting MethodsCapital Budgeting Methods
Profitability IndexProfitability Index
PI = PV of InflowsInitial Outlay
Very Similar to Net Present ValueVery Similar to Net Present Value
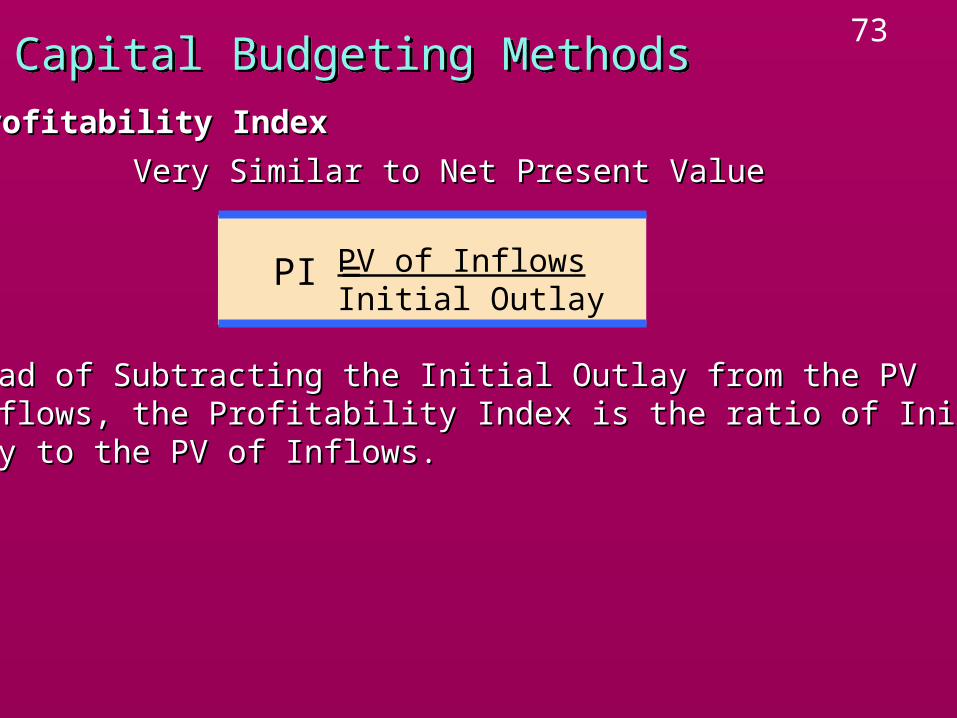
73Capital Budgeting MethodsCapital Budgeting Methods
Profitability IndexProfitability Index
PI = PV of InflowsInitial Outlay
Very Similar to Net Present ValueVery Similar to Net Present Value
Instead of Subtracting the Initial Outlay from the PVInstead of Subtracting the Initial Outlay from the PVof Inflows, the Profitability Index is the ratio of Initialof Inflows, the Profitability Index is the ratio of InitialOutlay to the PV of Inflows. Outlay to the PV of Inflows.

74Capital Budgeting MethodsCapital Budgeting Methods
Profitability IndexProfitability Index
PI = PV of InflowsInitial Outlay
Very Similar to Net Present ValueVery Similar to Net Present Value
Instead of Subtracting the Initial Outlay from the PVInstead of Subtracting the Initial Outlay from the PVof Inflows, the Profitability Index is the ratio of Initialof Inflows, the Profitability Index is the ratio of InitialOutlay to the PV of Inflows. Outlay to the PV of Inflows.
+ + +···+ CF1 (1+ k )
CF2 (1+ k )2
CF3 (1+ k )3
CFn (1+ k )n
PI =IO
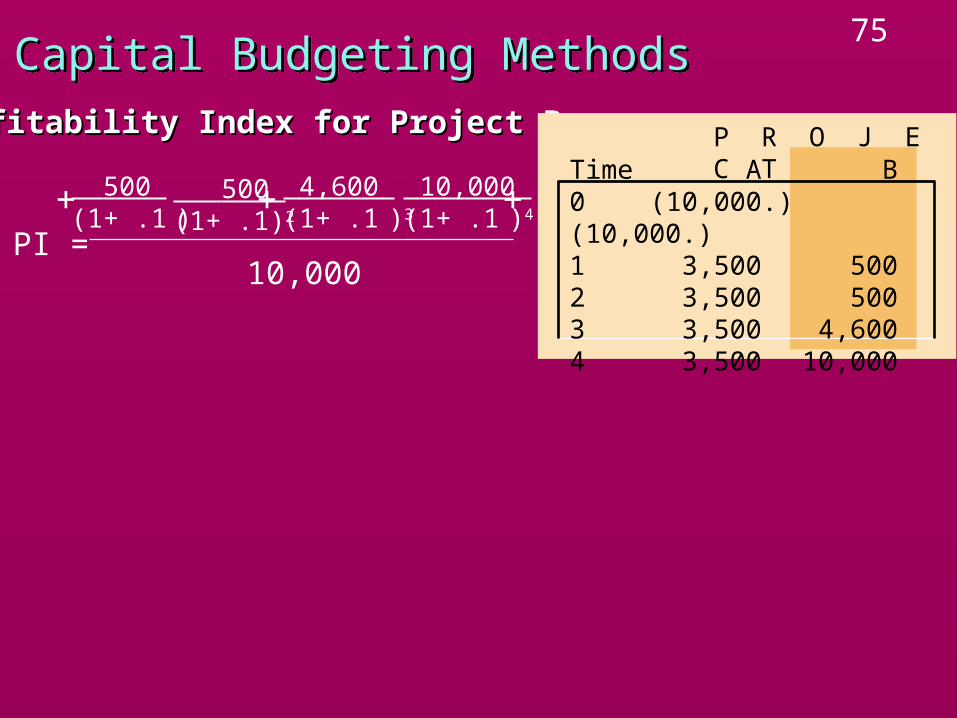
75Capital Budgeting MethodsCapital Budgeting Methods
Profitability Index for Project BProfitability Index for Project B P R O J E C TTime A B0 (10,000.) (10,000.)1 3,500 5002 3,500 5003 3,500 4,6004 3,500 10,000
+ + + 500 (1+ .1 )
500 (1+ .1)2
4,600 (1+ .1 )3
10,000 (1+ .1 )4
10,000PI =

76Capital Budgeting MethodsCapital Budgeting Methods
Profitability Index for Project BProfitability Index for Project B P R O J E C TTime A B0 (10,000.) (10,000.)1 3,500 5002 3,500 5003 3,500 4,6004 3,500 10,000
+ + + 500 (1+ .1 )
500 (1+ .1)2
4,600 (1+ .1 )3
10,000 (1+ .1 )4
10,000PI =
PI = 11,15410,000
= 1.1154

77Capital Budgeting MethodsCapital Budgeting Methods
Profitability Index for Project BProfitability Index for Project B P R O J E C TTime A B0 (10,000.) (10,000.)1 3,500 5002 3,500 5003 3,500 4,6004 3,500 10,000
+ + + 500 (1+ .1 )
500 (1+ .1)2
4,600 (1+ .1 )3
10,000 (1+ .1 )4
10,000PI =
PI = 11,15410,000
= 1.1154
Profitability Index for Project AProfitability Index for Project A
10,000PI =
3,500 x PVIFA 4, .10

78Capital Budgeting MethodsCapital Budgeting Methods
Profitability Index for Project BProfitability Index for Project B P R O J E C TTime A B0 (10,000.) (10,000.)1 3,500 5002 3,500 5003 3,500 4,6004 3,500 10,000
+ + + 500 (1+ .1 )
500 (1+ .1)2
4,600 (1+ .1 )3
10,000 (1+ .1 )4
10,000PI =
PI = 11,15410,000
= 1.1154
Profitability Index for Project AProfitability Index for Project A
10,000PI =
PI = 11,095 10,000
= 1.1095
3,500( ) 1 .10(1+.10)4
1 .10

79Capital Budgeting MethodsCapital Budgeting Methods
Profitability Index Decision RulesProfitability Index Decision Rules Independent ProjectsIndependent Projects
Accept Project if PI 1Mutually Exclusive ProjectsMutually Exclusive Projects
Accept Highest PI 1 Project

80Comparison of MethodsComparison of Methods
Project A Project B ChoosePayback < 3 years < 4 years ANPV $1,095 $1,154 BIRR 14.96% 13.50% API 1.1095 1.1154 B

81Comparison of MethodsComparison of Methods
Time Value of MoneyTime Value of MoneyPayback - Does not adjust for timing differences
(ignore Discounted Payback)NPV, IRR and PI take into account the time value
of money

82Comparison of MethodsComparison of MethodsTime Value of MoneyTime Value of Money
Payback - Does not adjust for timing differencesNPV, IRR and PI take into account the time value of money
Relevant Cash Flows?Relevant Cash Flows?NPV, IRR and PI use all Cash FlowsPayback method ignores Cash Flows that occur after the Payback
Period.

83Comparison of MethodsComparison of MethodsTime Value of MoneyTime Value of Money
Payback - Does not adjust for timing differences NPV, IRR and PI take into account the time value of money
Relevant Cash Flows?Relevant Cash Flows?NPV, IRR and PI use all Cash FlowsPayback method ignores Cash Flows that occur after the Payback
Period.
0 1 2
5,000 5,000(10,000)
Project 1

84Comparison of MethodsComparison of MethodsTime Value of MoneyTime Value of Money
Payback - Does not adjust for timing differences NPV, IRR and PI take into account the time value of money
Relevant Cash Flows?Relevant Cash Flows?NPV, IRR and PI use all Cash FlowsPayback method ignores Cash Flows that occur after the Payback
Period.
0 1 2
5,000 5,000(10,000)
Project 1
0 1 2 3
5,000 5,000(10,000)
Project 2
10,000
Both Projects haveIdentical Payback

85Comparison of MethodsComparison of MethodsNPV & PI indicated accept Project B while IRR indicated that Project A should be accepted. Why?NPV & PI indicated accept Project B while IRR indicated that Project A should be accepted. Why?Sometimes there is a conflict between the decisions based on NPV and IRR methods. Sometimes there is a conflict between the decisions based on NPV and IRR methods. The conflict arises if there is difference in the timing of CFs or sizes of the projects (or both).The conflict arises if there is difference in the timing of CFs or sizes of the projects (or both).The cause of the conflict is the underlying reinvestment rate assumption.The cause of the conflict is the underlying reinvestment rate assumption.Reinvestment Rate AssumptionsReinvestment Rate Assumptions
NPV assumes cash flows are reinvested at the required rate, k.IRR assumes cash flows are reinvested at IRR.
Reinvestment Rate of k more realistic as most projects earn approximately k (due to competition)Reinvestment Rate of k more realistic as most projects earn approximately k (due to competition)NPVNPV is the Better Method for project evaluation is the Better Method for project evaluation
86IRR IRR
Because of its unreasonable reinvestment rate assumption, IRR Because of its unreasonable reinvestment rate assumption, IRR method can result in bad decisions. method can result in bad decisions.
Another problem with IRR is that if the sign of the cash flow changes Another problem with IRR is that if the sign of the cash flow changes more than once, there is a possibility of multiple IRR. See p 340.more than once, there is a possibility of multiple IRR. See p 340.
The problem of unreasonable assumption can be addressed by The problem of unreasonable assumption can be addressed by using Modified IRRusing Modified IRR

87MIRRMIRR
To find MIRRTo find MIRR1.Find the FV of all intermediate CFs using the cost of 1.Find the FV of all intermediate CFs using the cost of
capital (the hurdle rate) as the interest rate.capital (the hurdle rate) as the interest rate.2.Add all FV.2.Add all FV.3. Find that discount rate which makes the PV of the 3. Find that discount rate which makes the PV of the
FV equal to the PV of outflows.FV equal to the PV of outflows.
Drop MIRR computations.Drop MIRR computations.

88