Embed Size (px)
Citation preview

1
CAPITAL BUDGETING ISSUES IN FAST-GROWING ECONOMIES
COST OF CAPITAL

2

3
Plan
NPV is the sum of discounted cash flows
Cash flows come from capital budgeting
Where do discount rates come from?
Cost of capital cost of equity cost of debt weighted average cost of capital practitioner approach (country risks)

4
How to value business opportunities?
Examples
Boeing considers building a component assembly plant in Sao Paulo. The plant would import components from Canada, employ Brazilian workers to assemble the components into modules, and re-exports all of its production back to Bombardier’s facilities in US.
Google analyzes entering the Russian portal market via a joint venture with Yandex search engine.

5
Project valuation in emerging markets can be challenging
how would you go about valuing each investments?
would you construct your cash flow projections in Brazilian Real or Canadian dollars? Then, how would you convert between different currencies?
how would you measure country risks (political risk, corruption) and how would you adjust your cost of capital for country risks?
what about industry characteristics (e.g., aviation vs. internet access)?
How to value business opportunities?

6
Main issues
Main issues arising when investing in EM
recognizing costs and revenues in multiple currencies
assessing country risk and incorporating them into discount rate
country risk includes macroeconomic volatility, potential regulatory or political change, poorly defined property rights and enforcement mechanisms
accounting for business volatility which is different from that of developed economy
accounting for potential events, e.g., expropriation or currency devaluation
These issues make project valuation in EM an art than a science

7
Basic ideaBasic Principles
inflation and risk erode purchasing power of money. Hence, dollar received at 2011 will have different purchasing power from the same dollars received at 2012
we have to discount future cash flows with appropriate discount rates
as future cash flows are also exposed to uncertainty, we calculate expected value of cash flows at each time in the future before discounting
Present Value of Investment
where CFi is the expected cash flow at future year i and DR a discount rate that reflects the risk of the investment
8
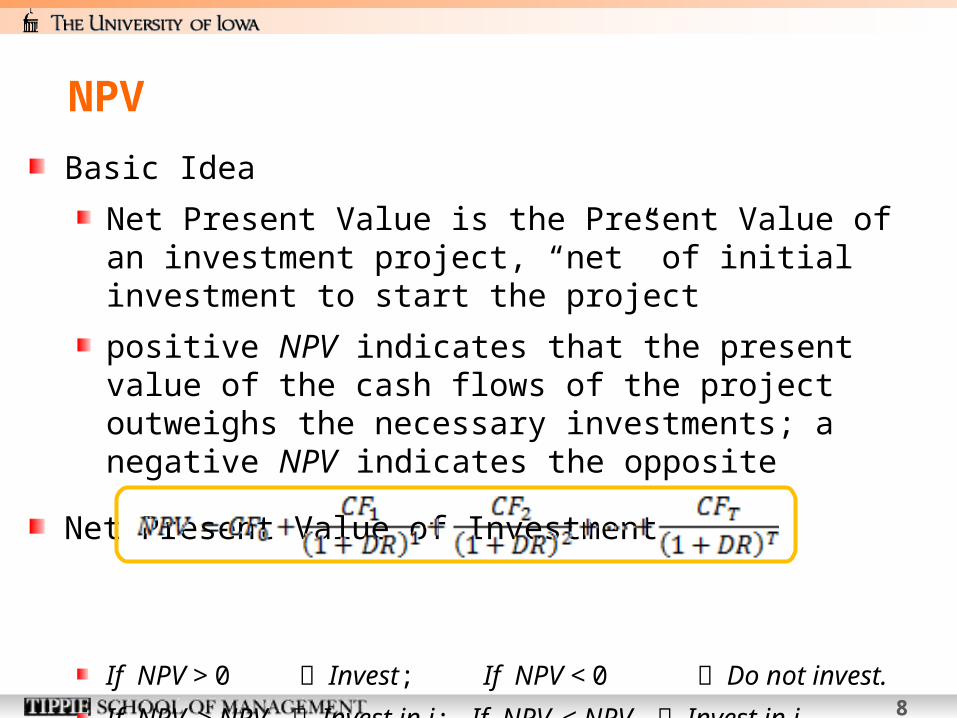
Basic Idea
Net Present Value is the Present Value of an investment project, “net” of initial investment to start the project
positive NPV indicates that the present value of the cash flows of the project outweighs the necessary investments; a negative NPV indicates the opposite
Net Present Value of Investment
If NPV > 0 Invest; If NPV < 0 Do not invest.
If NPVi > NPVj Invest in i; If NPVi < NPVj Invest in j.
NPV
9
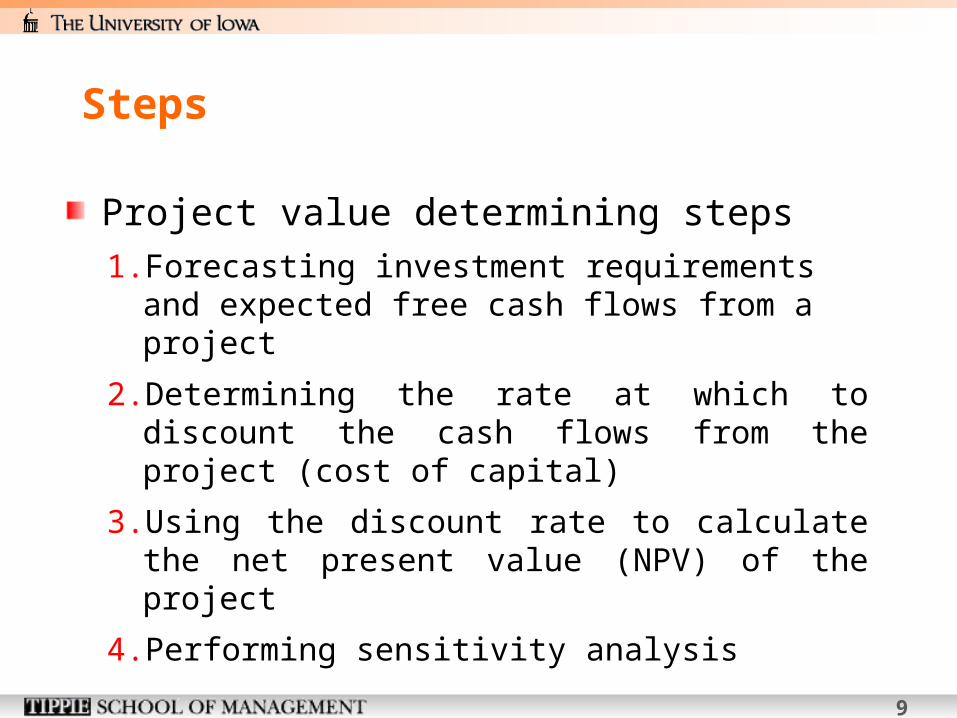
Steps
Project value determining steps
1. Forecasting investment requirements and expected free cash flows from a project
2. Determining the rate at which to discount the cash flows from the project (cost of capital)
3. Using the discount rate to calculate the net present value (NPV) of the project
4. Performing sensitivity analysis

10
Currency conversionForeign exchange terminology and economic relationships
spot rate
forward rate
for any two countries and any two periods, the expected change in the exchange rate is equal to the difference in nominal interest rates, which is equal to the expected difference in inflation rates
what happens if the equality does not hold? Currency arbitrage

11
Revenues and costs in multiple currencies
Capital budgeting with multiple currencies – two approaches
Local currency NPV
• project value is primarily determined by the events within the host country
• revenues and costs occur primarily in local currency, when investment capital is raised locally and free cash flow is reinvested locally
• pros: don’t need to forecast exchange rates
• cons:
• local cost of capital can be severely distorted, especially due to hyperinflation or government’s interest rate manipulation
• when there is (dis) advantage against foreign firms accessing local financing, this approach can (over) undervalue the project, compared to local firms
11

12
Capital budgeting with multiple currencies – two approaches
Period-by period conversion
• produce local currency projections, then convert the period-by period cash flows into home country currency using forward rates or projected exchange rates
• resulting home country cash flows are then discounted at a rate derived from the home country discount rate.
• pros: analyst can explicitly consider how shifts in the exchange rate affect project
• cons:
• few forward rates are available beyond one year
• forecasting can be complicated when local governments intervenes in credit or foreign exchange market
12
Revenues and costs in multiple currencies
13
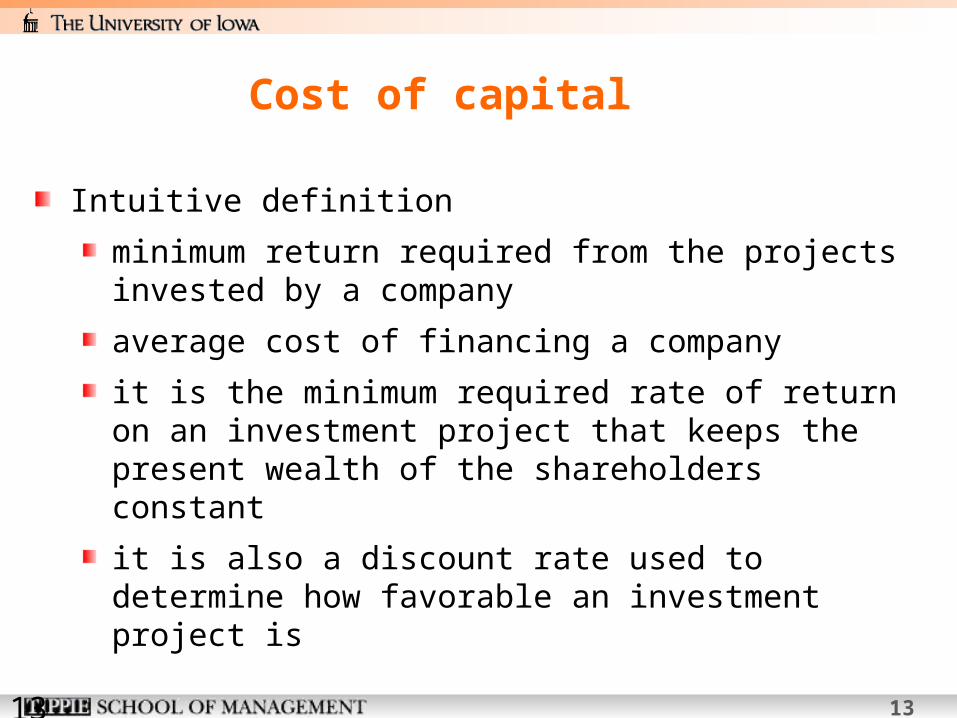
Cost of capital
Intuitive definition
minimum return required from the projects invested by a company
average cost of financing a company
it is the minimum required rate of return on an investment project that keeps the present wealth of the shareholders constant
it is also a discount rate used to determine how favorable an investment project is
13

14
Equity cost of capital
The Capital Asset Pricing Model (CAPM) is a practical way to estimate.
The cost of capital of any investment opportunity equals the expected return of available investments with the same beta.
The estimate is provided by the Security Market Line equation:
r
i=r
f+
i(E[R
Mkt]-r
f)
Risk Premium for Security i

15
Example
Suppose you estimate that Wal-Mart’s stock has a volatility of 16.1% and a beta of 0.20. A similar process for Johnson &Johnson yields a volatility of 13.7% and a beta of 0.54. Which stock carries more total risk? Which has more market risk? If the risk-free interest rate is 4% and you estimate the market’s expected return to be 12%, calculate the equity cost of capital for Wal-Mart and Johnson & Johnson. Which company has a higher cost of equity capital?

16
Market indexes
Report the value of a particular portfolio of securities.
Examples: S&P 500
• A value-weighted portfolio of the 500 largest U.S. stocks Wilshire 5000
• A value-weighted index of all U.S. stocks listed on the major stock exchanges
Dow Jones Industrial Average (DJIA)• A price weighted portfolio of 30 large industrial stocks

17
Market portfolio
Most practitioners use the S&P 500 as the market proxy, even though it is not actually the market portfolio.

18
Market risk premium
Determining the Risk-Free Rate The yield on U.S. Treasury securities Surveys suggest most practitioners use 10 to 30 year
treasuries Where to obtain?
The Historical Risk Premium Estimate the risk premium (E[RMkt]-rf) using the historical
average excess return of the market over the risk-free interest rate
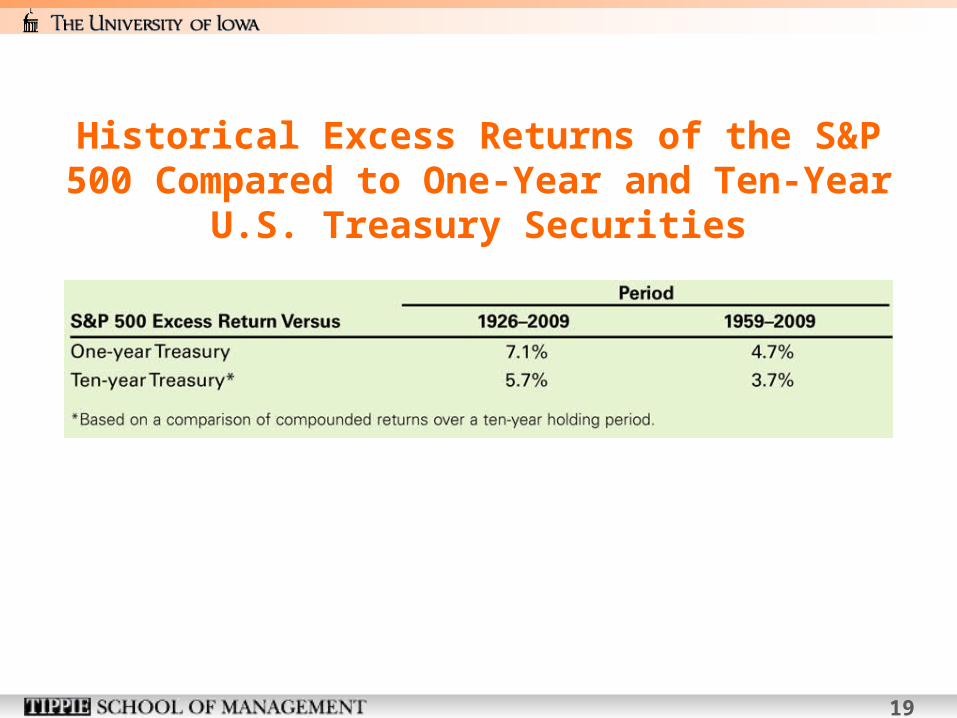
19
Historical Excess Returns of the S&P 500 Compared to One-Year and Ten-Year U.S.
Treasury Securities

20
Beta estimation
Estimating Beta from Historical Returns Recall, beta is the expected percent change in the
excess return of the security for a 1% change in the excess return of the market portfolio.
Consider Cisco Systems stock and how it changes with the market portfolio.

21
Monthly Returns for Cisco Stock and for the S&P 500, 1996–2009

22
Scatterplot of Monthly Excess Returns for Cisco Versus the S&P 500, 1996–2009

23
Beta estimation
Estimating Beta from Historical Returns As the scatterplot on the previous slide shows, Cisco
tends to be up when the market is up, and vice versa.
We can see that a 10% change in the market’s return corresponds to about a 20% change in Cisco’s return. • Thus, Cisco’s return moves about two for one with the
overall market, so Cisco’s beta is about 2.
24
Beta estimation
Estimating Beta from Historical Returns
Beta corresponds to the slope of the best-fitting line in the plot of the security’s excess returns versus the market excess return.

25
Using linear regression
Linear Regression
The statistical technique that identifies the best-fitting line through a set of points.
• αi is the intercept term of the regression.
• βi(RMkt – rf) represents the sensitivity of the stock to market risk. When the market’s return increases by 1%, the security’s return increases by βi%.
• εi is the error term and represents the deviation from the best-fitting line and is zero on average.
(R
i r
f)
i
i(R
Mkt r
f)
i
26
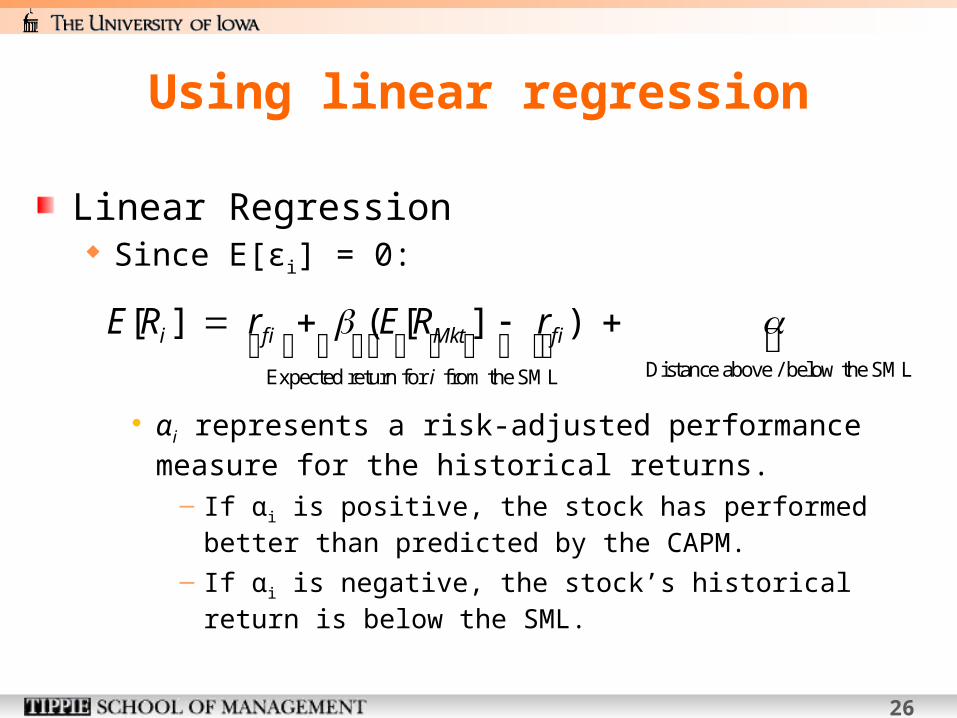
Using linear regression
Linear Regression Since E[εi] = 0:
• αi represents a risk-adjusted performance measure for the historical returns.
– If αi is positive, the stock has performed better than predicted by the CAPM.
– If αi is negative, the stock’s historical return is below the SML.
Distance above / below the SMLExpected return for from the SML
[ ] ( [ ] ) i f i Mkt f i
i
E R r E R r
27
Using linear regression
Linear Regression
Given data for rf , Ri , and RMkt , statistical packages for linear regression can estimate βi.
• A regression for Cisco using the monthly returns for 1996–2009 indicates the estimated beta is 1.80.
• The estimate of Cisco’s alpha from the regression is 1.2%.

28
Practical considerations, comparables approach
All-equity comparables Find an all-equity financed firm in a single line of
business that is comparable to the project. Complications
• there are few firms without debt• creates problems for both your company and finding
comparable companies
Leverage would increase your company’s cost of equity!

29
Equity cost of capital
Leverage makes equity riskier
Debt Betas One can estimate the debt cost of capital using the
CAPM. Debt betas are difficult to estimate because corporate
bonds are traded infrequently. One approximation is to use estimates of betas of bond
indices by rating category.
)1)(/)(( cdUUL ED

30
Average Debt Betas by Rating and Maturity

31
Equity cost of capital
• We often assume that debt beta is zero• Levered equity beta is then
• Intuitively, beta of equity of a levered company is higher for more levered company
• Even further simplifications assume no tax shield effect
)1)(/( cUUL ED
)//( VEUL
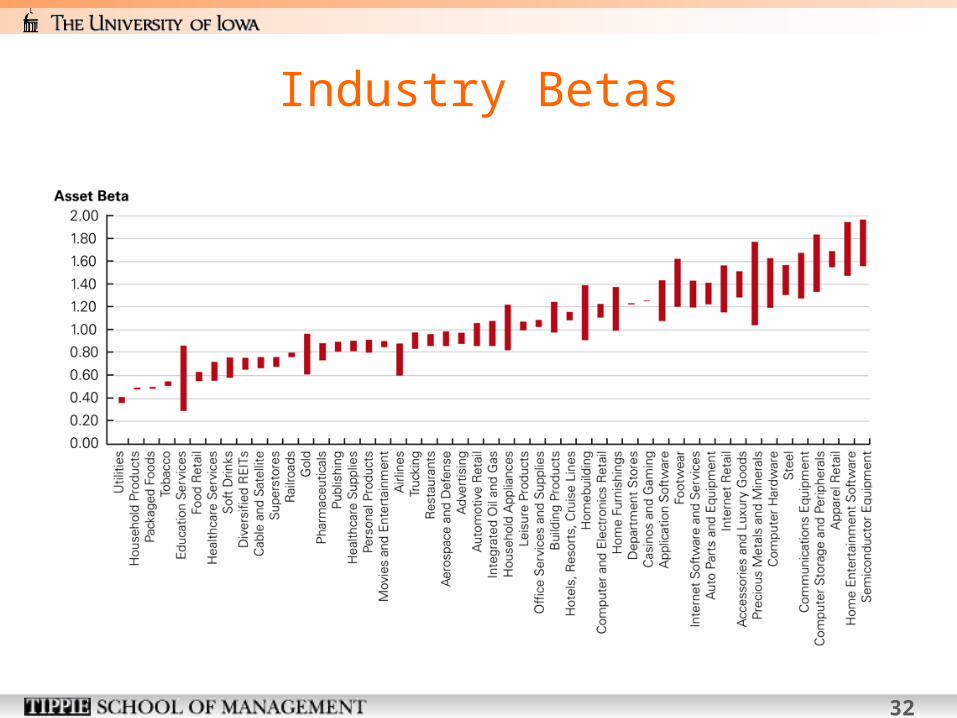
32
Industry Betas
33
Debt cost of capital
Debt Yields Yield to maturity is the IRR an investor will earn from
holding the bond to maturity and receiving its promised payments.
If there is little risk the firm will default, yield to maturity is a reasonable estimate of investors’ expected rate of return.

34
Financing and the Weighted Average Cost of Capital
How might the project’s cost of capital change if the firm uses leverage to finance the project?
Perfect capital markets In perfect capital markets, choice of financing does not
affect cost of capital or project NPV
Taxes – A Big Imperfection When interest payments on debt are tax deductible, the
net cost to the firm is given by: Effective after-tax interest rate = r(1-τC)
35
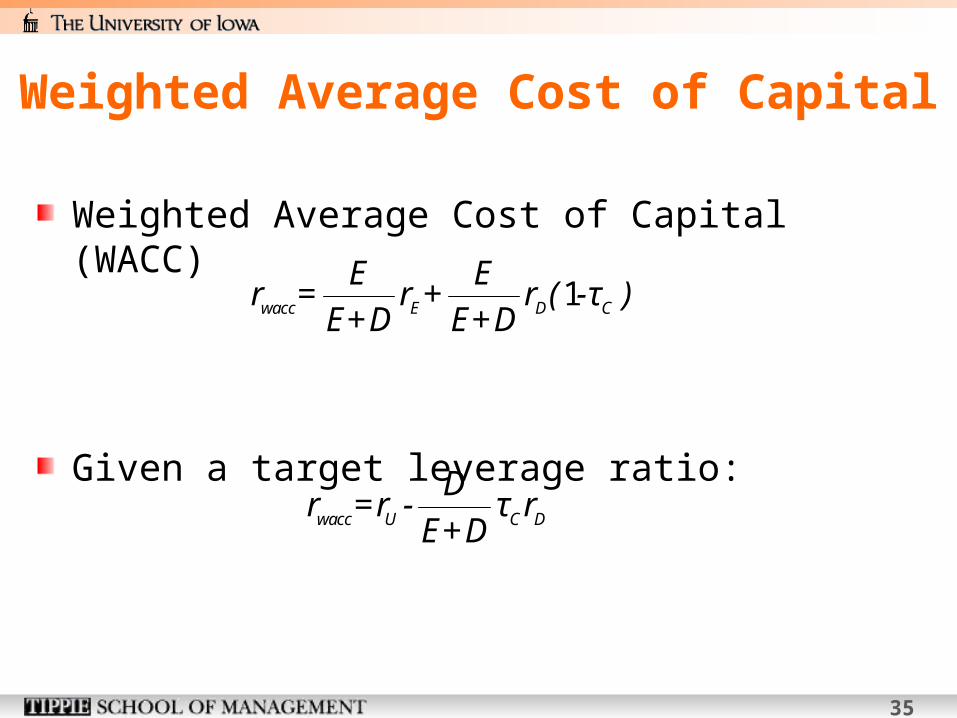
Weighted Average Cost of Capital
Weighted Average Cost of Capital (WACC)
Given a target leverage ratio:
1wacc E D C
E Er = r + r ( -τ )
E+D E+D
wacc U C D
Dr =r - τ r
E+D

36
Example

37
Which factors influence β ? cyclicality of revenues, leverage low β firms : utilities, food retailers, low fixed cost firms, low levered firms high β firms : high tech or homebuilders why is β of homebuilder high? homebuilder’s revenue is more sensitive to business cycle why is β of low levered firm low?
firms with debt should make interest payments regardless of sales or profits
Notes on beta
37

38
What is country risk? ability to service its debt and to support the conversion of local earnings into
home country currency
How to measure country risk? yield on sovereign debt debt yield reflects two risk factors
1) country risk
2) exchange risk
premium
Accounting for country risk
38

39
How to measure cost of equity in EM? add country premium
Equity Cost of Capital = (Rf + country premium) + β·(Rm – Rf)
country premium of developing economies
Accounting for country risk