Embed Size (px)
Citation preview

1
By: Prof. Y. Peter Chiu By: Prof. Y. Peter Chiu
9 / 1 / 2010 9 / 1 / 2010
Advanced P.O.M.Advanced P.O.M.Chap. 3Chap. 3
Aggregate Planning

2
~ Aggregate Planning ~
Macro production planning
The problem of deciding how many
employees the firm should retain — for a manufacturing firm to decide the
quantity and mix of products to be produced
e.g. In Service organizations : — Airlines plans staffing levels for flight
attendants & pilots — Hospitals plans staffing levels for nurses
§.§. A A1: Introduction1: Introduction

3
Macro planning begins with the forecast of demand
The aggregate planning methodology we discussed later, requires the assumption that 〝 demand is deterministic, or known in advance 〞 .
Ways to satisfy demand
— in house production — out-sourced / subcontracting
§.§. A A1: Introduction 1: Introduction ( page 2 )

4
■ Competing objectives of Aggregate planning :
— To react quickly to anticipated changes indemand ( i.e. making frequent and potentially
large changes in the size of the labor force – A chase strategy, may be cost effective short term. )
— To retain a stable workforce.
— To develop a production plan for the firm thatmaximizes profit over the planning horizon subject to constraints on capacity.
§.§. A A1: Introduction 1: Introduction ( page 3 )
5
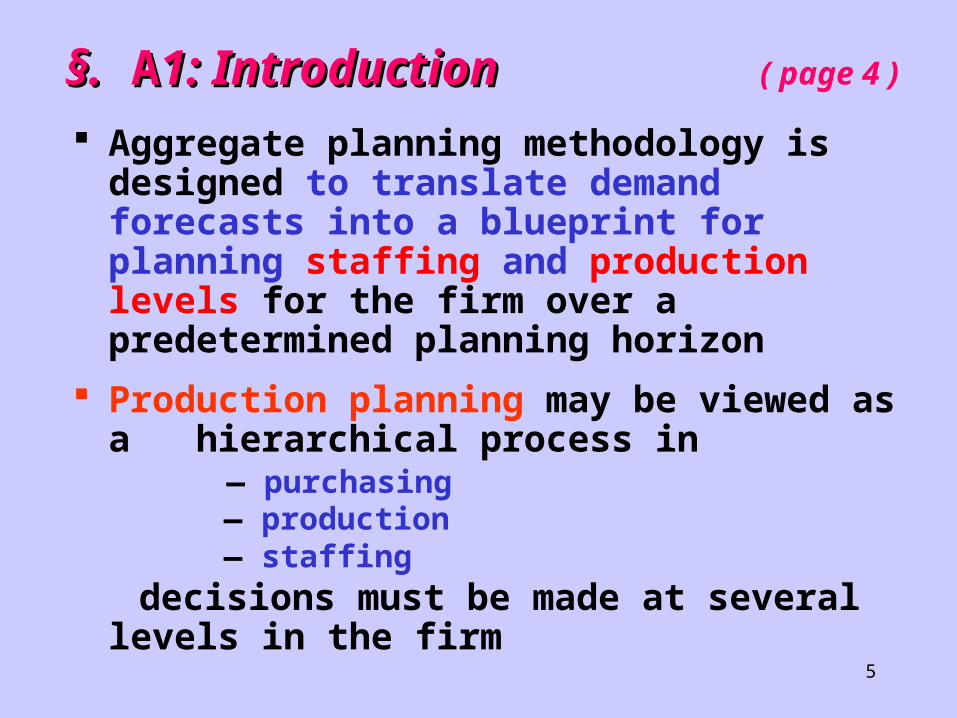
Aggregate planning methodology is designed to translate demand forecasts into a blueprint for planning staffing and production levels for the firm over a predetermined planning horizon
Production planning may be viewed as a hierarchical process in
— purchasing — production — staffing decisions must be made at several levels in
the firm
§.§. A A1: Introduction 1: Introduction ( page
4 )
6
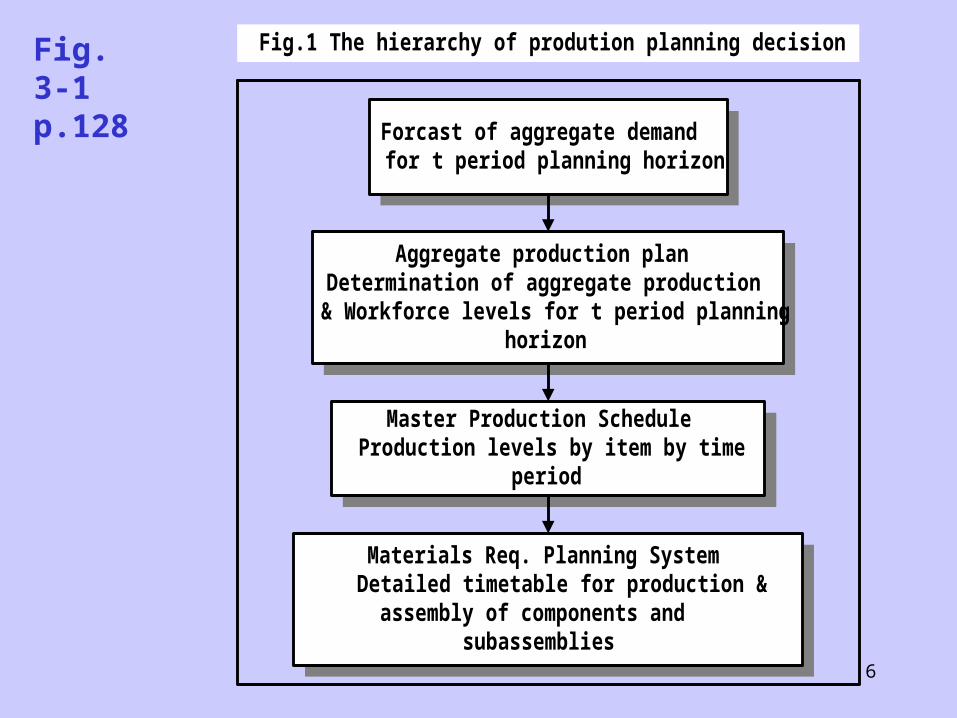
Master Production ScheduleProduction levels by item by time
period
Aggregate production planDetermination of aggregate production& Workforce levels for t period planning
horizon
Materials Req. Planning System Detailed timetable for production &
assembly of components andsubassemblies
Forcast of aggregate demandfor t period planning horizon
Fig.1 The hierarchy of prodution planning decisionFig. 3-1 p.128

7
Aggregate Units of Production
— amount of work required ( worker-years ) — weight ( tons of steel ) — volume ( gallons of gasoline ) — dollar value ( value of inventory in dollars ) ~ Not Always Obvious
§.§. A A1: Introduction 1: Introduction ( page
6 )

8
Example 3-1 ( p.127 ) A plant manager working for a large national
appliance firm is considering implementing an aggregate planning system to determine the workforce and production levels in his plant. This particular plant produces 6 models of TVs. The characteristics of the TVs are :Model # Number of Worker - Hours Required to produce
1 4.2 $285 2 4.9 $345 3 5.1 $395 4 5.2 $425 5 5.4 $525 6 5.8 $725
Selling Price
~ Aggregate Planning ~§.§. A2 A2: Example : Example

9
Example 3-1 ( continued ) The manger notices that the percentages of the
total number of sales for these six models have been fairly constant :
Model # % of the total numbers of sales
1 32% 2 21% 3 17% 4 14% 5 10% 6 6%
§.§. A2 A2: Example : Example ( page 2 )
~ Aggregate Planning ~

10
To find the particular aggregation scheme
(1) Selling price / Number of worker-hours required = $ per Input-Hour
Model # $/hr
1 $285/4.2 = $67.86 2 $345/4.9 = $70.41 3 $395/5.1 = $77.45 4 $425/5.2 = $81.73 5 $525/5.4 = $97.22 6 $725/5.8 = $125.00
§.§. A2 A2: Example : Example ( page 3 )
~ Aggregate Planning ~ Eg. 3-1 / Solution:

11
then
what is $78.34? “Average dollars of output / worker-hour input”
in this particular production plant
Model # $/hr * % of Sales 1 $67.86* 0.32 = $21.72 2 $70.41* 0.21 = $14.79 3 $77.45* 0.17 = $13.17 4 $81.73* 0.14 = $11.44 5 $97.22* 0.10 = $9.72 6 $125.00* 0.06 = $7.50
34.78$
§.§. A2 A2: Example : Example ~ Aggregate Planning ~ ( page 4 )
Eg. 3-1 / Solution:

12
(continued)
(2) The manager decides to define an aggregate unit of production as a fictitious TV
Model # Number of worker-Hours Required 1 4.2*0.32 = 1.34 2 4.9*0.21 = 1.03 3 5.1*0.17 = 0.87 4 5.2*0.14 = 0.73 5 5.4*0.10 = 0.54 6 5.8*0.06 = 0.35
86.4$
§.§. A2 A2: Example : Example ( page 5 )
~ Aggregate Planning ~
Sum = 4.86
Eg. 3-1 / Solution:

13
◆ what is 4.86 hours? “ Average worker-hours required to produce
a fictitious TV”
§.§. A2 A2: Example : Example ( page 6 )
~ Aggregate Planning ~
What if we like to know
“ how many fictitious TV can one worker – one day (8hrs) produce ? ”
[ 1 / 4.86 ] x 8 = 1.646
— Applications of this Avg. worker-hours/ TV :~ If the manager can obtain sales forecast of overall models, then he can use this to plan workforce ~

14
Hierarchy for Aggregate planning ( by Hax & Meal 1975 )
(1) Items : Final products to be delivered to the customer.(SKU-stock keeping unit)
(2) Families : A group of items that share a common manufacturing setup cost
(3) Types : Groups of families with production quantities that are determined by a single aggregate
production plan
■ In our previous example, different models of TVs are families, while type might be large appliances.
■ Hax & Meal aggregation scheme will not necessarily work in every situation
§.§. A3 A3: : Hierarchical production planning (HPP)

15
The goal of aggregate planning is to determine aggregate production quantities and the levels of resources required to achieve these production goals
The primary issues related to the aggregate planning problem include :
◆ Smoothing — 2 key components of smoothing costs are the costs that result from hiring and firing workers
◆ Bottleneck problems — System unable to respond to sudden changes
in demand as a result of capacity restrictions
§.§. A4 A4: Overview of the: Overview of the Aggregate planning problem Aggregate planning problem

16
The primary issues related to the aggregate planning
problem (continued) :
◆ Planning horizon — Not too small T, Not too large T — End-of-horizon effect
◆ Treatment of demand — Assumption of deterministic or known, ignores
the possibility of forecast errors— Needs a buffer for forecast errors— incorporates the effects of seasonal
fluctuations & business cycles
§.§. A4 A4: Overview of the: Overview of the Aggregate planning problem Aggregate planning problem ( page
2 )

17
◆ Smoothing Costs — laid off (firing) workers — hiring workers
◆ Holding Costs — capital tied up in inventory
◆ Shortage Costs — excess demand normally assumes backlogged
◆ Regular time Costs — the cost of producing one unit of
output during regular working hours
◆ Overtime and subcontracting costs
§.§. A5 A5: Costs in Aggregate planning : Costs in Aggregate planning

18
Example 3.2 : ( p.133)
Densepack company is to plan workforce and production levels for the six-month period January to June. The firm produces a line of disk drives for mainframe computers that are plug compatible with several computers produced by major manufacturers.
Forecast demands for the next 6 months for a particular line of drives produced in their plant 1, are 1280, 640, 900,1200, 2000, and 1400. There are currently (end of December) 300 workers employed in plant 1. Ending inventory in December is expected to be 500 units, and the firm would like to have 600 units on hand at the end of June. And It is estimated that :
§.§. A6 A6: A Prototype problem : A Prototype problem

19
Cost of hiring 1 worker,Cost of firing 1 worker,Cost of holding 1 unit of Inventory for 1month,
The plant manager observed that in the past, over 22 working days, with the workforce level constant at 76 workers, the firm produced 245 disk drives.
What is ‘’Number of aggregate units produced by 1 worker in 1 day ?’’
Evaluate : (1) the chase strategy (zero inventory plan) and (2) the constant workforce plan
500$HC1000$FC
80$IC
§.§. A6 A6: A Prototype problem : A Prototype problem ( page 2 )( page 2 )
Example 3.2 : (continued)

20
Starting: 500 units 300 workers 300 workers
Ending: 600 units x worker ? x worker ?
1 1280
6 1400
5 2000
4 1200
3 900
2 640
1 780(- )
6 2000(+)
5 2000
4 1200
3 900
2 640
780
5520
7520
3520
2320
1420
§.§. A6 A6: A Prototype problem : A Prototype problem ( page 3 )( page 3 )
Example 3.2 : Solution

21
K= # of aggregate units produced by one worker in oneday
76 workers work 22 days producing 245 disk drives
14653.0)22( 76
245K
§.§. A6 A6: A Prototype problem : A Prototype problem ( page 4 )( page 4 )
Example 3.2 : Solution

22
(1) Evaluation of chasechase strategy Tabl e 1: I ni t i al Cal cul ati on for Chase Strategy Zero I nventory Pl an for Densepack
A B C D E Number of Mi ni mum Uni ts Produced Number of Number of per Worker Forecasted Workers Requi red month Worki ng Days (B ×. 14653) Net Demand (D/ C Rounded Up)
J anuary 20 2. 931 780 267 February 24 3. 517 640 182 March 18 2. 638 900 342 Apri l 26 3. 810 1200 315 May 22 3. 224 2000 621 J une 15 2. 198 2000 910
§.§. A6 A6: A Prototype problem : A Prototype problem ( page 5 )( page 5 )
Example 3.2 : Solution
23
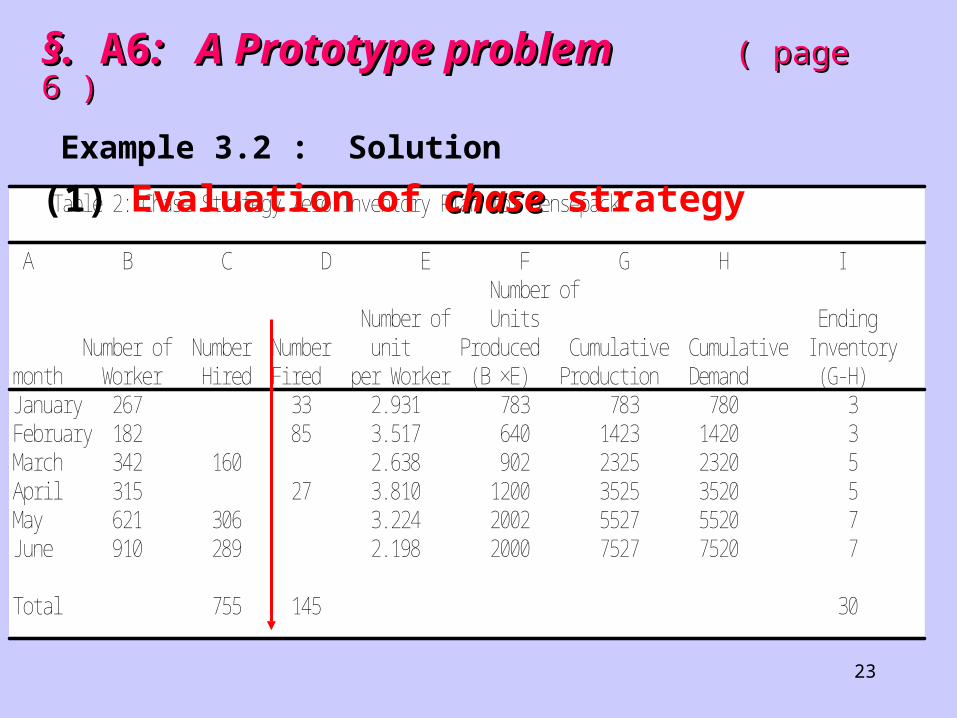
Tabl e 2: Chase Strategy Zero I nventory Pl an for Densepack
A B C D E F G H I Number of Number of Uni ts Endi ng Number of Number Number uni t Produced Cumul ati ve Cumul ati ve I nventory month Worker Hi red Fi red per Worker (B ×E) Producti on Demand (G-H) J anuary 267 33 2. 931 783 783 780 3 February 182 85 3. 517 640 1423 1420 3 March 342 160 2. 638 902 2325 2320 5 Apri l 315 27 3. 810 1200 3525 3520 5 May 621 306 3. 224 2002 5527 5520 7 J une 910 289 2. 198 2000 7527 7520 7
Total 755 145 30
§.§. A6 A6: A Prototype problem : A Prototype problem ( page 6 )( page 6 )
Example 3.2 : Solution
(1) Evaluation of chasechase strategy

24
Tabl e 2: Chase Strategy Zero I nventory Pl an for Densepack
A B C D E F G H I Number of Number of Uni ts Endi ng Number of Number Number uni t Produced Cumul ati ve Cumul ati ve I nventory month Worker Hi red Fi red per Worker (B ×E) Producti on Demand (G-H) J anuary 267 33 2. 931 782 782 780 2 February 182 85 3. 517 640 1422 1420 2 March 342 160 2. 638 902 2324 2320 4 Apri l 315 27 3. 810 1200 3525 3520 5 May 621 306 3. 224 2002 5527 5520 7 J une 910 289 2. 198 2000 7527 7520 7
Total 755 145 30 753 144 13
755*(500)+145*(1000)+30*(80)=$524, 900 600*(80)=4800 + 48, 000 572, 900 $569, 540/ 910 workers
500$HC
80$IC1000$FC
§.§. A6 A6: A Prototype problem : A Prototype problem ( page 7 )( page 7 )
Example 3.2 : Solution
(1) Evaluation of chasechase strategy
753 & 144 & 13

25
Tabl e 3: Computati on of the Mi ni mum Work Force Requi red by Densepack
A B C D Cumul ati ve Rati o Cumul ati ve Number of uni ts B/ C month Net Demand Produced per Worker (Rounded Up)
J anuary 780 2. 931 267 February 1420 6. 448 221 March 2320 9. 086 256 Apri l 3520 12. 896 273 May 5520 16. 120 343 J une 7520 18. 318 411
§.§. A6 A6: A Prototype problem : A Prototype problem ( page 8 )( page 8 )
Example 3.2 : Solution
(2) Evaluation of Constant workforceConstant workforce plan
Hire to max. 411 workers initially
26
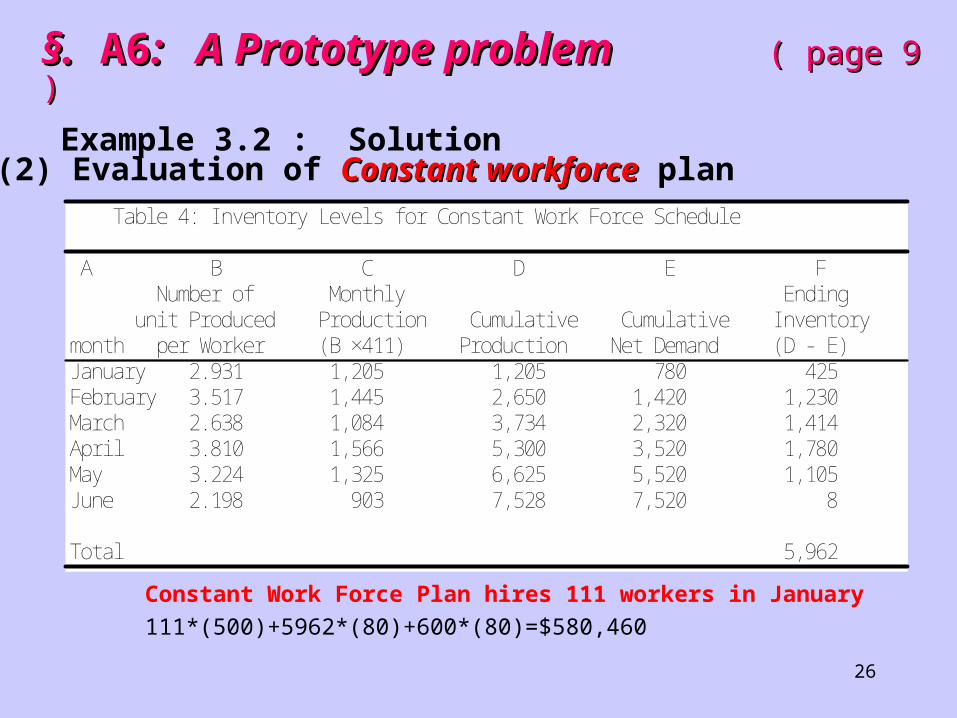
Constant Work Force Plan hires 111 workers in January
111*(500)+5962*(80)+600*(80)=$580,460
Tabl e 4: I nventory Level s for Constant Work Force Schedul e
A B C D E F Number of Monthl y Endi ng uni t Produced Producti on Cumul ati ve Cumul ati ve I nventory month per Worker (B ×411) Producti on Net Demand (D - E) J anuary 2. 931 1, 205 1, 205 780 425 February 3. 517 1, 445 2, 650 1, 420 1, 230 March 2. 638 1, 084 3, 734 2, 320 1, 414 Apri l 3. 810 1, 566 5, 300 3, 520 1, 780 May 3. 224 1, 325 6, 625 5, 520 1, 105 J une 2. 198 903 7, 528 7, 520 8
Total 5, 962
§.§. A6 A6: A Prototype problem : A Prototype problem ( page 9 )( page 9 )
Example 3.2 : Solution
(2) Evaluation of Constant workforceConstant workforce plan

27
(3) Comparison of 2 plans(3) Comparison of 2 plans Chase Strategy Chase Strategy ( Zero Inventory Plan )( Zero Inventory Plan )
■ Hiring & Firing Constantly Appropriate?
H : 755(-2) $522,500
F : 145(-1)
■ Minimum Inventory Level, total I = 30 or 13 (-17) $48,000+$2,400=$50,400
■ Ending at desirable work force level ? 910
Total costs = $569,540 & ending 910 workers
§.§. A6 A6: A Prototype problem : A Prototype problem ( page ( page 10 )10 )
Example 3.2 : Solution

28
(3) Comparison of 2 plans(3) Comparison of 2 plans (continued) Constant Work Force PlanConstant Work Force Plan
■ Minimum hiring & firing (one time) $55,500
500,55 0:111:
timeoneFH
§.§. A6 A6: A Prototype problem : A Prototype problem ( page ( page 11 )11 )
Example 3.2 : Solution
■ More carryovers units, total I = 5962 $476,960
■ Ending at better work force level . 411
Total costs = 580,460 & ending 411 workers

29
(4) Other Suggestions : (A) CHIU’s – Suggestion Ⅰ A B C D E F
J anuary 780 2. 931 267 300 99 February 1420 6. 448 221 300 514 March 2320 9. 086 256 300 405 Apri l 3520 12. 896 273 300 348 May 5520 16. 120 343 513 1 J une 7520 18. 318 411 910 1
H 610 I 1368: : 610*(500)+1368*(80)=$414, 440 910
iD' iK CB / 300 Inv
§.§. A6 A6: A Prototype problem : A Prototype problem ( page ( page 12 )12 )
Example 3.2 : Solution
3.2242.198
$ 414,440 910 workers +600*($80)=$462,440 (19% reductions)
20002000

30
A B C D E F
J anuary 780 2. 931 267 300 99 February 1420 6. 448 221 300 514 March 2320 9. 086 256 300 405 Apri l 3520 12. 896 273 300 348 May 5520 16. 120 343 674 520 J une 7520 18. 318 411 674 1
H 374 I 1887: : 374*(500)+1887*(80)=$337, 960 674
iD' iK CB / 300 Inv
§.§. A6 A6: A Prototype problem : A Prototype problem ( page ( page 13 )13 )
Example 3.2 : Solution(4) Other Suggestions : (B) CHIU’s – Suggestion II
3.2242.198
$ 337,960 674 workers +600*($80)=$385,960 (33% reductions)
20002000
31
§.§. A6.1: A6.1: ClassClassProblems DiscussionProblems Discussion
Chapter 3 : Chapter 3 : ( # 12 ( # 12, 14, 14 ) ) p.139-140p.139-140
Preparation Time : 10 ~ 15 minutesPreparation Time : 10 ~ 15 minutes
Discussion : 10 minutesDiscussion : 10 minutes

By: Prof. Y.P. Chiu 32
The End The End