Embed Size (px)
Citation preview

1
AGRICULTURAL INVESTMENT AGRICULTURAL INVESTMENT PAY-OFFS – THE MALAWI PAY-OFFS – THE MALAWI
CASECASE
Idrissa M. Mwale [email protected]
Ministry of Agriculture – MALAWI.
Presentation made at
Partnership to cut hunger and poverty in AfricaCapital Street, Washnigton DC
12 May 2009Chaired by: Dr. Derek Byerlee – Author, 2008
World Development Report
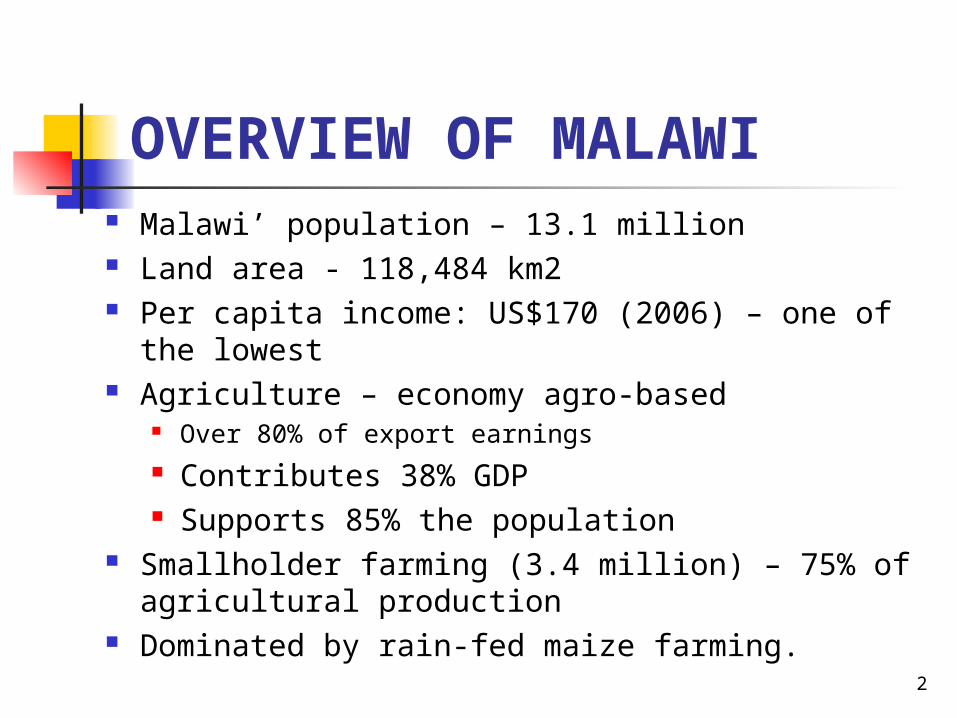
OVERVIEW OF MALAWI Malawi’ population – 13.1 million Land area - 118,484 km2 Per capita income: US$170 (2006) – one of the
lowest Agriculture – economy agro-based
Over 80% of export earnings Contributes 38% GDP Supports 85% the population
Smallholder farming (3.4 million) – 75% of agricultural production
Dominated by rain-fed maize farming. 2
SECTORAL POLICIES
Mandate of the Ministry of Agriculture: to promote and accelerate broad-based, sustainable agricultural development policies to enhance economic growth and contribute to poverty reduction
Farm Input Subsidy Programme is one of them.
3

4
Main Goal for ISP
The main objective of ISP Improve national food security
The immediate objective Improve accessibility and affordability
of agricultural inputs among the most vulnerable farmers in the country

BACKGROUND TO FISP
Dry prolonged spells 2004/2005 season - January and February 2005.
Reduced maize production – average yield dropping to 0.8 tons per ha.
Total maize production reduced to 1.22 million tons, approx 60% of the estimated national maize food requirement.
5
BACKGROUND TO FISP - cont
Government decision – improve smallholder farmers’ access to inputs
Fertilizer and improved hybrid and OPV maize seed – to improve food security
Tobacco farmers to improve rural economies
Legume (Groundnuts, soya, beans) for household nutrition and economic empowerment
6
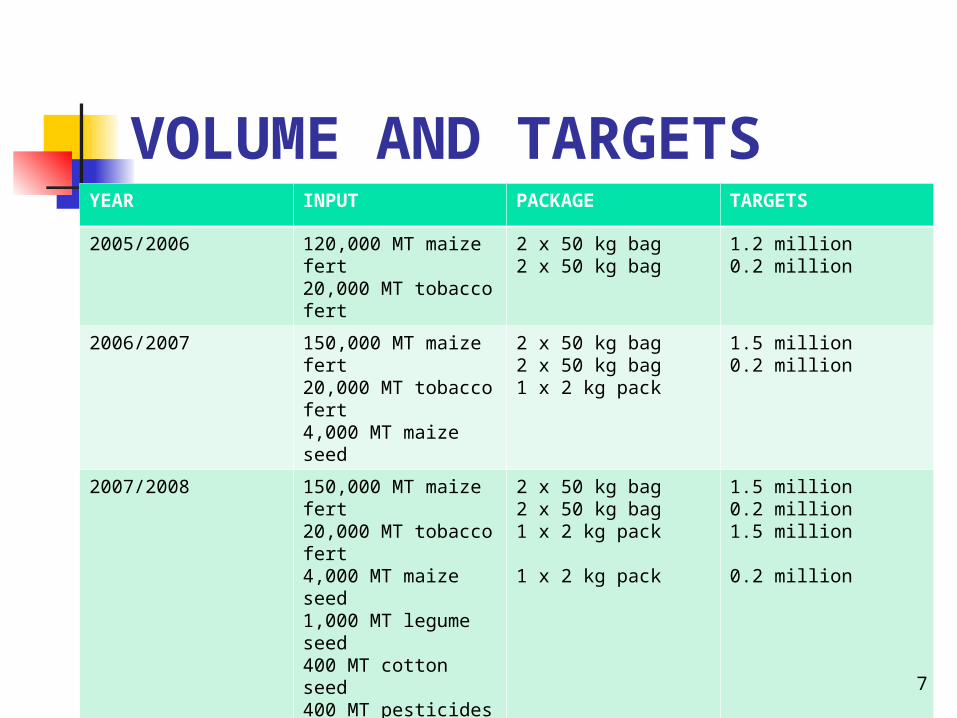
VOLUME AND TARGETS YEAR INPUT PACKAGE TARGETS
2005/2006 120,000 MT maize fert20,000 MT tobacco fert
2 x 50 kg bag 2 x 50 kg bag
1.2 million 0.2 million
2006/2007 150,000 MT maize fert20,000 MT tobacco fert4,000 MT maize seed
2 x 50 kg bag 2 x 50 kg bag 1 x 2 kg pack
1.5 million 0.2 million
2007/2008 150,000 MT maize fert20,000 MT tobacco fert4,000 MT maize seed1,000 MT legume seed400 MT cotton seed400 MT pesticides
2 x 50 kg bag 2 x 50 kg bag 1 x 2 kg pack
1 x 2 kg pack
1.5 million 0.2 million 1.5 million
0.2 million
2008/2009 150,000 MT maize fert20,000 MT tobacco fert4,000 MT maize seed1,000 MT legume seed400 MT cotton seed400 MT pesticides
2 x 50 kg bag 2 x 50 kg bag 1 x 2 kg pack
1 x 2 kg pack
1.5 million 0.2 million 1.5 million
0.2 million
7
8
BENEFICIARY IDENTIFICATION Criteria for beneficiary identification include:-
A Malawian that owns a piece of land Vulnerable household, with low purchasing power Guardian looking after physically challenged persons who are
unable to farm Hard working household Adopter of new technologies Resident of the village The vulnerable group – child headed household, female
headed household, elderly but hard working household
A combination of this is used in identifying the beneficiaries One beneficiary per household will registered
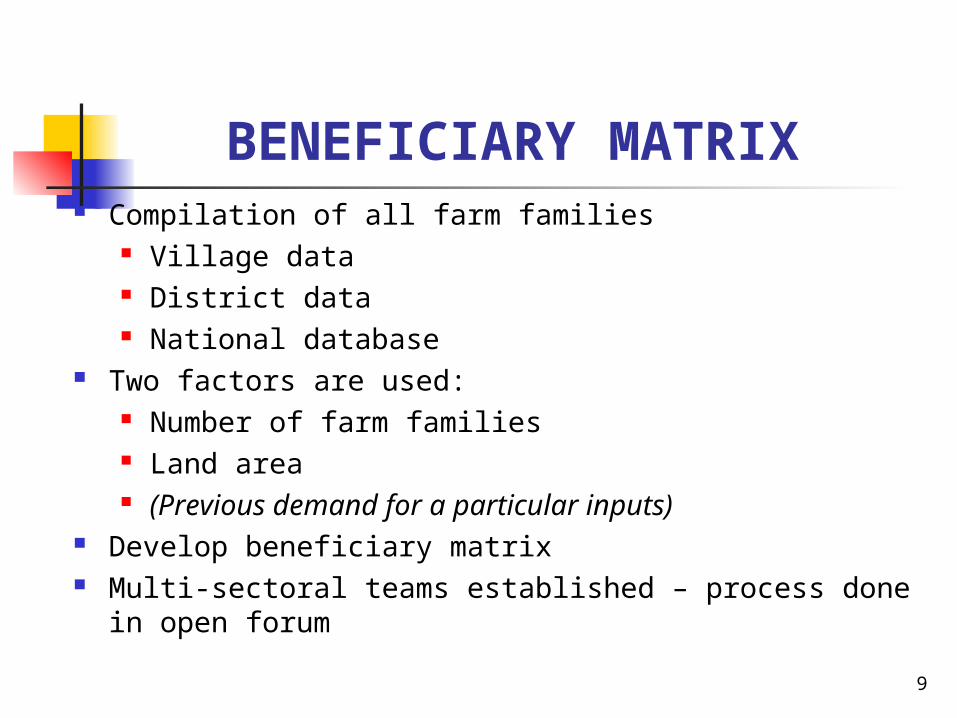
BENEFICIARY MATRIX Compilation of all farm families
Village data District data National database
Two factors are used: Number of farm families Land area (Previous demand for a particular inputs)
Develop beneficiary matrix Multi-sectoral teams established – process done in
open forum
9
TARGETING BENEFICIARIES
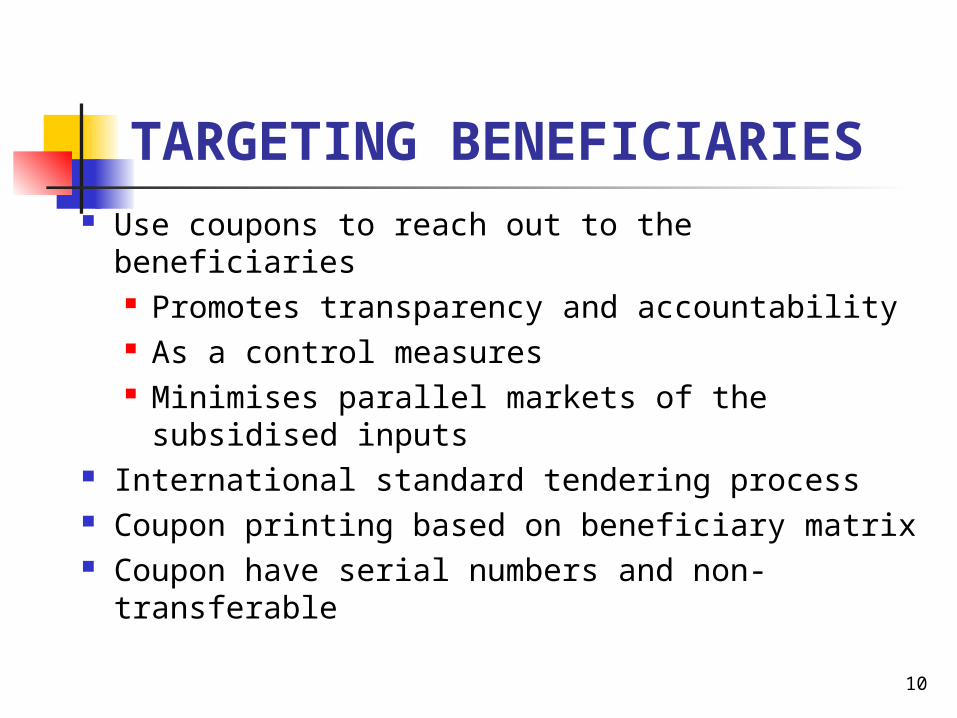
Use coupons to reach out to the beneficiaries Promotes transparency and accountability As a control measures Minimises parallel markets of the subsidised
inputs International standard tendering process Coupon printing based on beneficiary matrix Coupon have serial numbers and non-
transferable
10
PROCUREMENT OF INPUTS AND TRANSPORT SERVICES
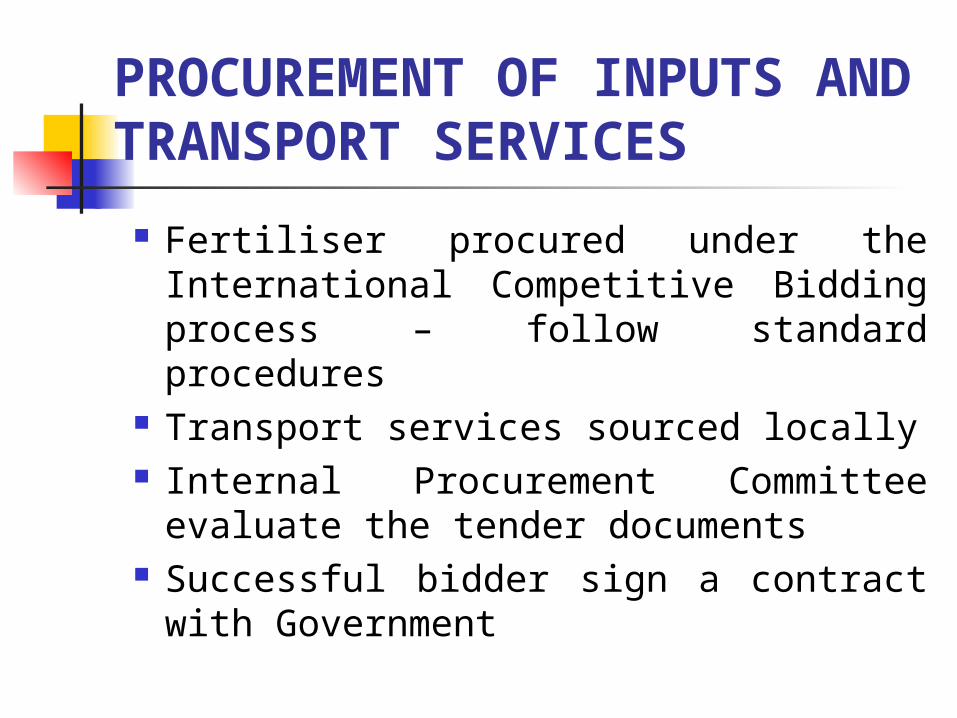
Fertiliser procured under the International Competitive Bidding process – follow standard procedures
Transport services sourced locally Internal Procurement Committee
evaluate the tender documents Successful bidder sign a contract
with Government

DELIVERY & DISTRIBUTION OF INPUTS
Three channels are used as follows: Deliver the fertiliser to designated
warehouses in three main regions Deliver some contracted fertiliser and
retail part through the existing outlets Retail all the contract through the
existing retail outlets Most of the fertiliser is imported by
the private sector – over 80%

COUPON REDEMPTION Farmers free to use the coupons in any
recognised retail shop The Traders collects the top-up from the
farmer and the coupon Submit the coupons together with an
invoice to the Ministry Payment based on submitted coupons
only
COUPON VALUE
14
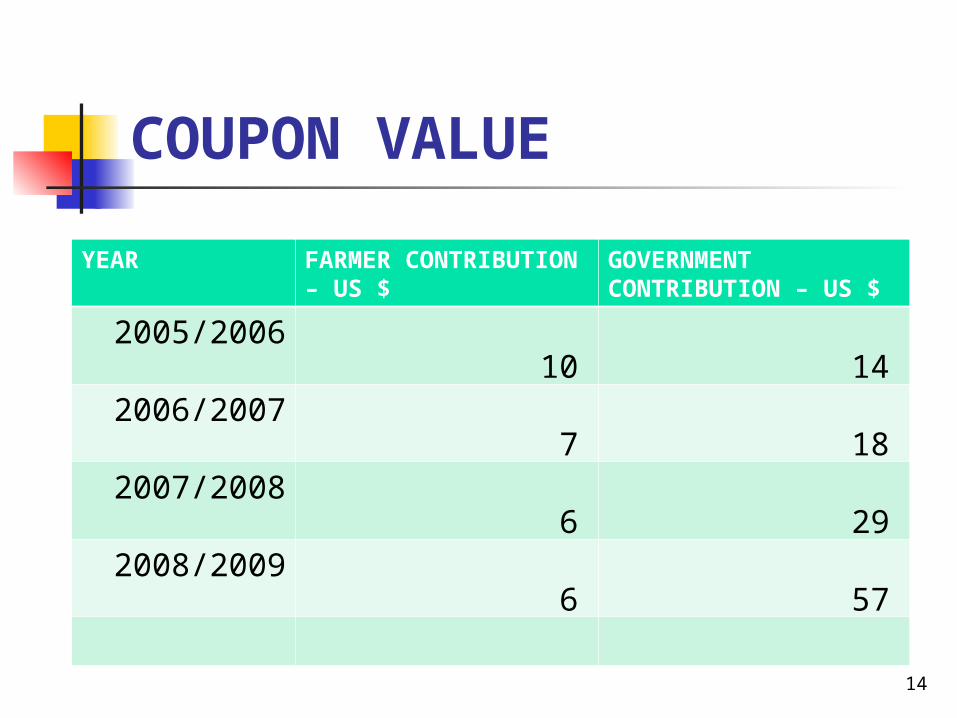
YEAR FARMER CONTRIBUTION – US $
GOVERNMENT CONTRIBUTION – US $
2005/2006 10 14 2006/2007 7 18 2007/2008 6 29 2008/2009 6 57

15
PVT SECTOR PARTICIPATION
Not involved in distribution in 2005/2006 season
In 2006/2007 and 2007/2008 private Sector participation was about 30%
Seed was 100% supplied by the Private Sector
Agro-dealers allowed to participate as long as they link up with the Trader
Increased input uptake among smallholder farmers

PVT SECTOR – CHALLENGES
Did not cover rural areas – concentrated in towns
Demanded an upfront payments In efficiency Exploited the smallholder farmes –
exchange coupons for something else
Were left out in 2008/200916

2007/2008 PROGRAM EXPENDITURES
Description Actual Expenditure
US $
As a % of total
Suppliers of fertilizer 76,428,571
64
Transporters 6,135,714 5
Redemption of fert. coupons 22,857,143
19
Redemption of seed Coupon 7,500,000
6
Operational costs 2,171,429 2
Other Costs 4,671,429 4
Total 119,764,286 100

SUCCESSES OF THE PROGRAMME
Food security at both household and national level
Technology transfer Increased input uptake and use
among smallholder farmers Improved rural economy Promoted private sectors turn-over Improved the country’s foreign
reserves 18
SUCCESSES continued
Met and exceeded the CAADP target – 14% of national budget
Met and exceeded agriculture growth target 6% per annum
Increased national productivity from 800 kg per ha to 2250 kg per ha
19
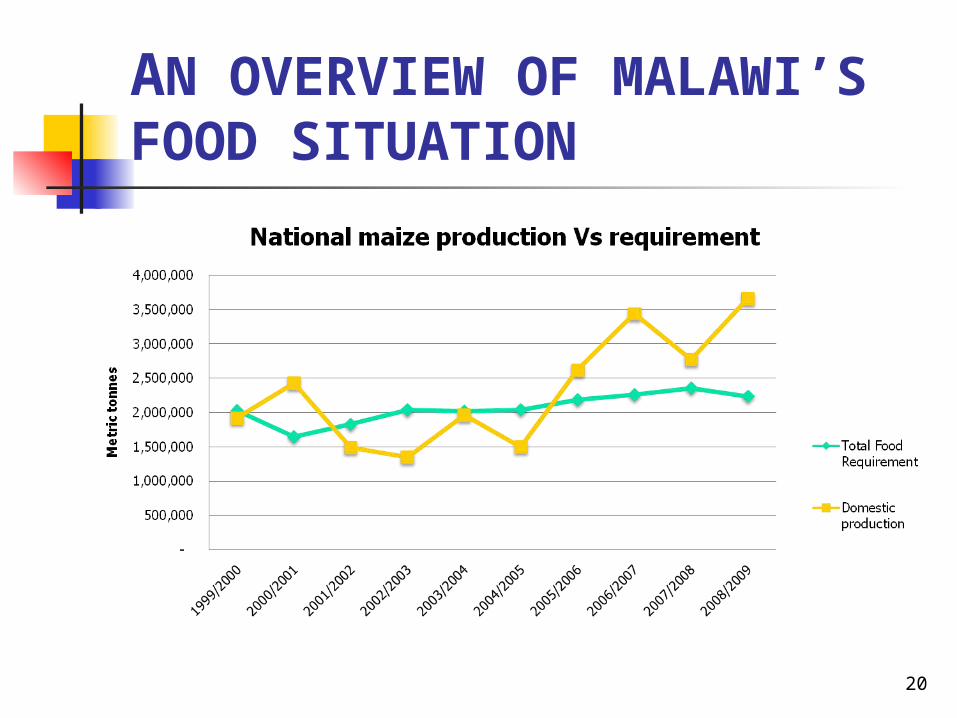
AN OVERVIEW OF MALAWI’S FOOD SITUATION
20
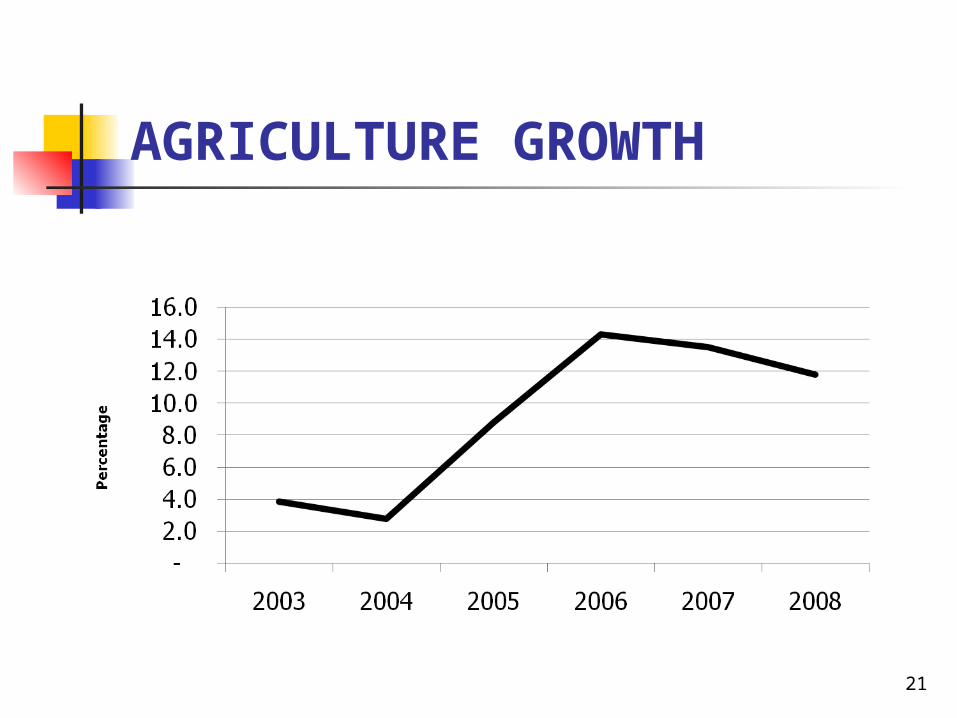
AGRICULTURE GROWTH
21

AN EXTERNAL ASSESSMENT OF THE ISP – FANRPAN, APRIL 2009
Who is FANRPAN Regional policy research and
advocacy network (farmers, government, private sector and researchers) www.fanrpan.org
Objectives: the need to evaluate progress, document & share African success stories
22
Case Study Results
Distribution of the inputs Utilization of the inputs Impact of Govt. support to
smallholder farmers Marketing of production
23
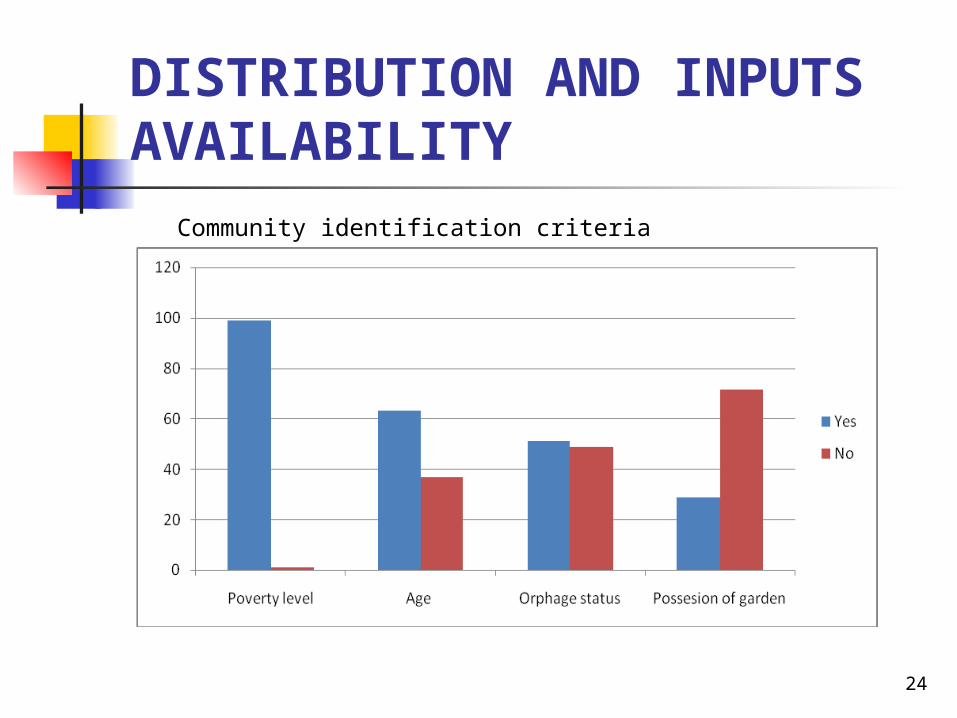
DISTRIBUTION AND INPUTS AVAILABILITY
24
Community identification criteria
BENEFICIARY IDENTIFICATION
70% identified in an open forum 30% reported external influence 68% are repeat recipients 32% are new beneficiaries
25

TIMING OF COUPON DISTRIBUTION AND INPUTS AVAILABILITY
17% distributed in October 68% by November 15% distributed in December Inputs availability – 85% markets
stocked in time There were also commercial sales
26
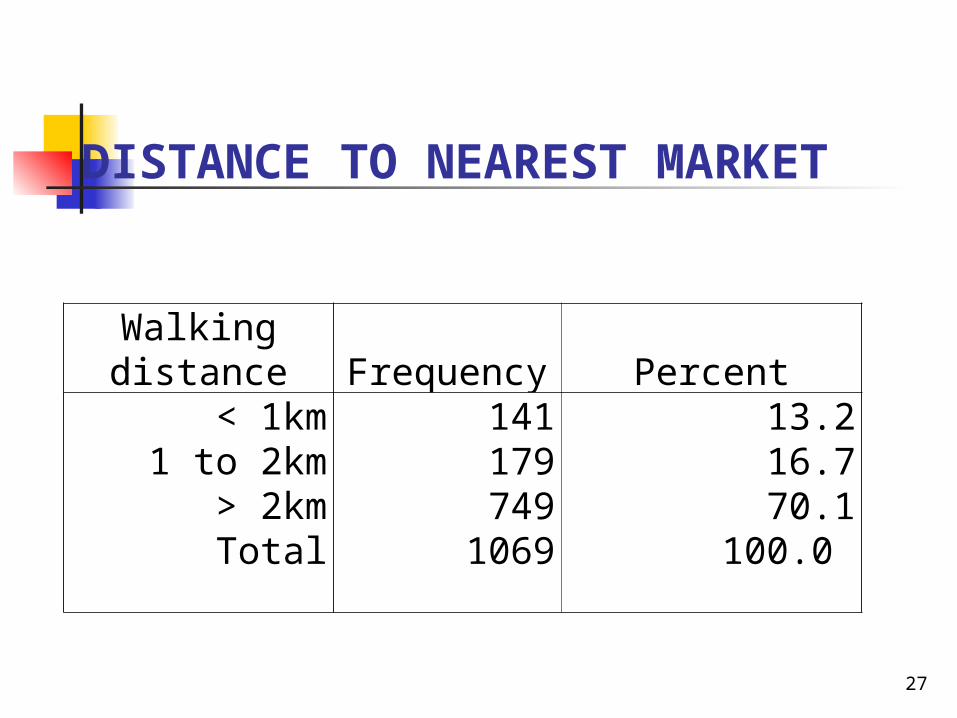
DISTANCE TO NEAREST MARKET
27
Walking distance Frequency Percent
< 1km 141 13.2 1 to 2km 179 16.7 > 2km 749 70.1 Total 1069 100.0
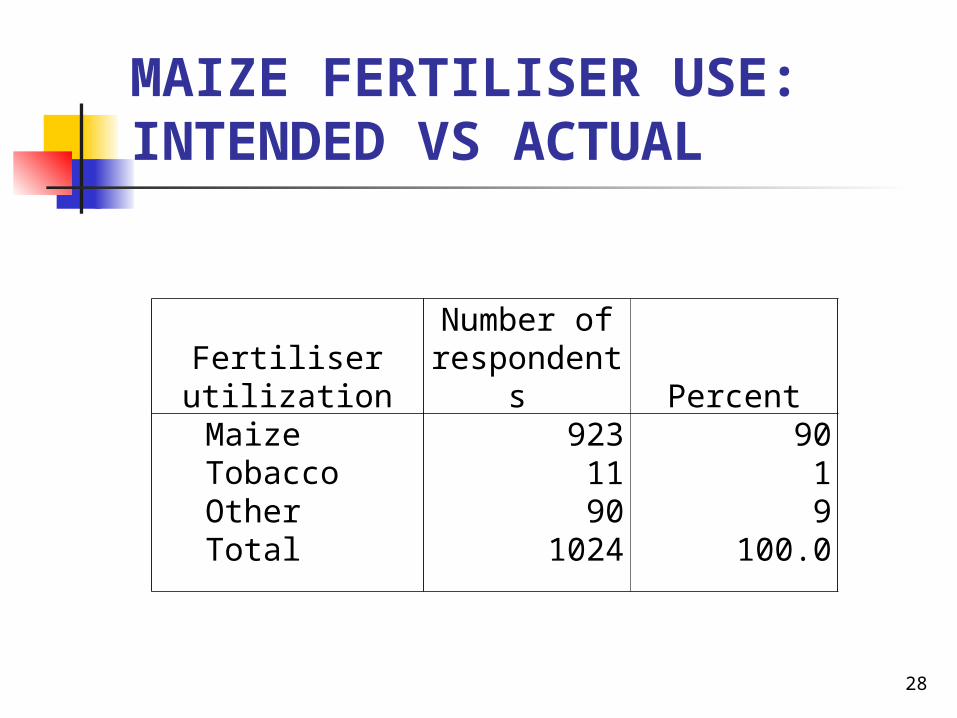
MAIZE FERTILISER USE: INTENDED VS ACTUAL
28
Fertiliser utilizationNumber of
respondents PercentMaize 923 90
Tobacco 11 1 Other 90 9 Total 1024 100.0
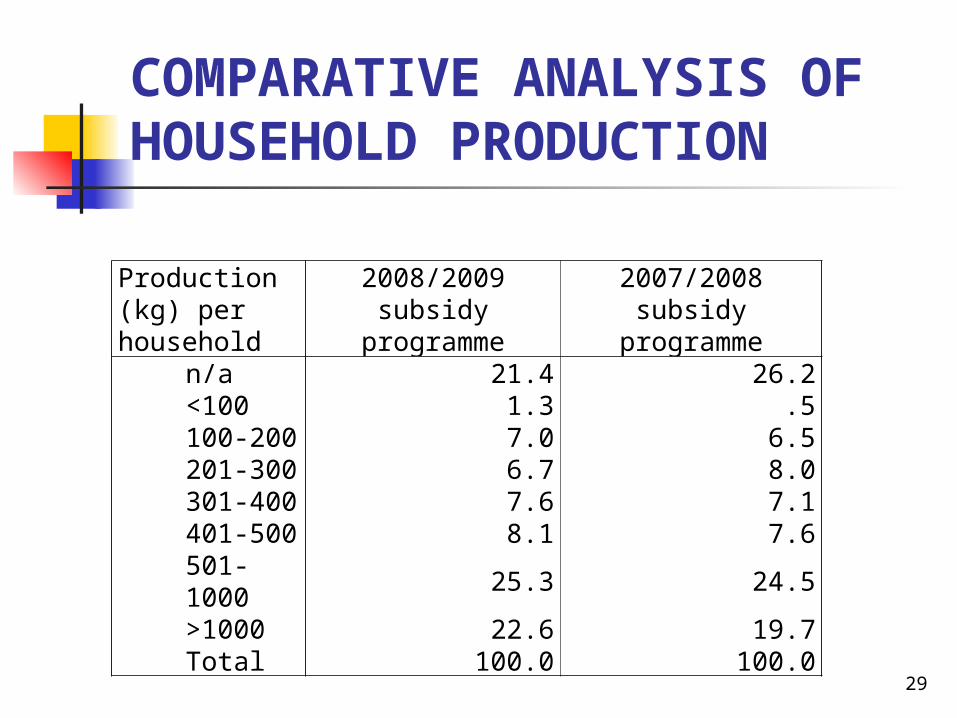
COMPARATIVE ANALYSIS OF HOUSEHOLD PRODUCTION
29
Production (kg) per household
2008/2009 subsidy programme
2007/2008 subsidy programme
n/a 21.4 26.2 <100 1.3 .5 100-200 7.0 6.5 201-300 6.7 8.0 301-400 7.6 7.1 401-500 8.1 7.6 501-1000 25.3 24.5 >1000 22.6 19.7 Total 100.0 100.0
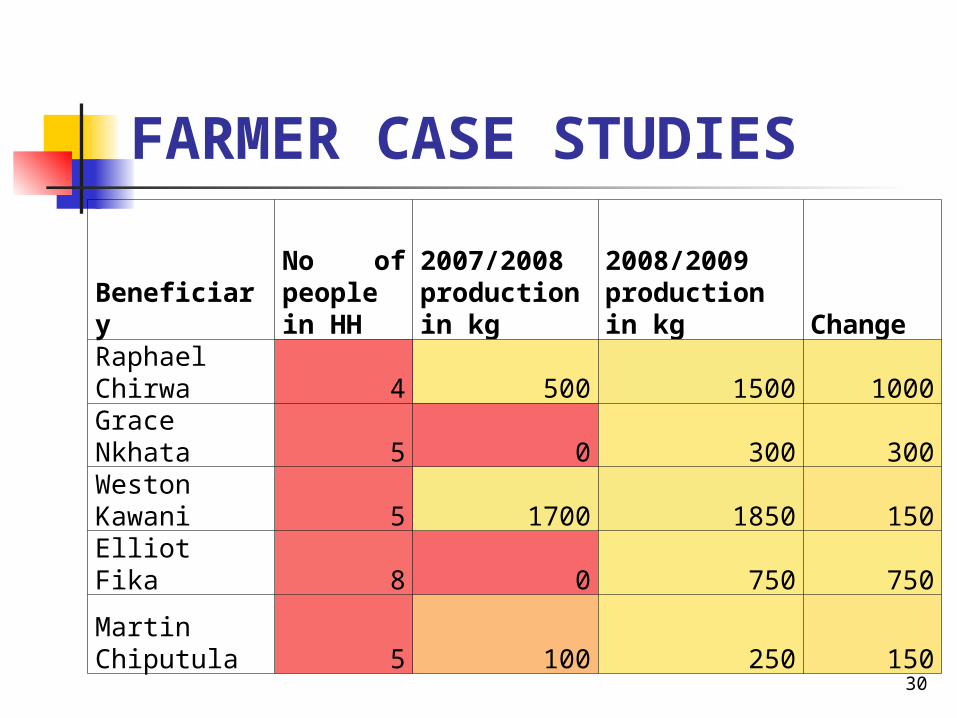
FARMER CASE STUDIES
30
Beneficiary
No of people in HH
2007/2008 production in kg
2008/2009 production in kg Change
Raphael Chirwa 4 500 1500 1000
Grace Nkhata 5 0 300 300
Weston Kawani 5 1700 1850 150
Elliot Fika 8 0 750 750
Martin Chiputula 5 100 250 150
FARMING FIRST
Safeguarding the environment Share knowledge Builds local access Protect harvest Enable access to markets Prioritize research imperatives
31
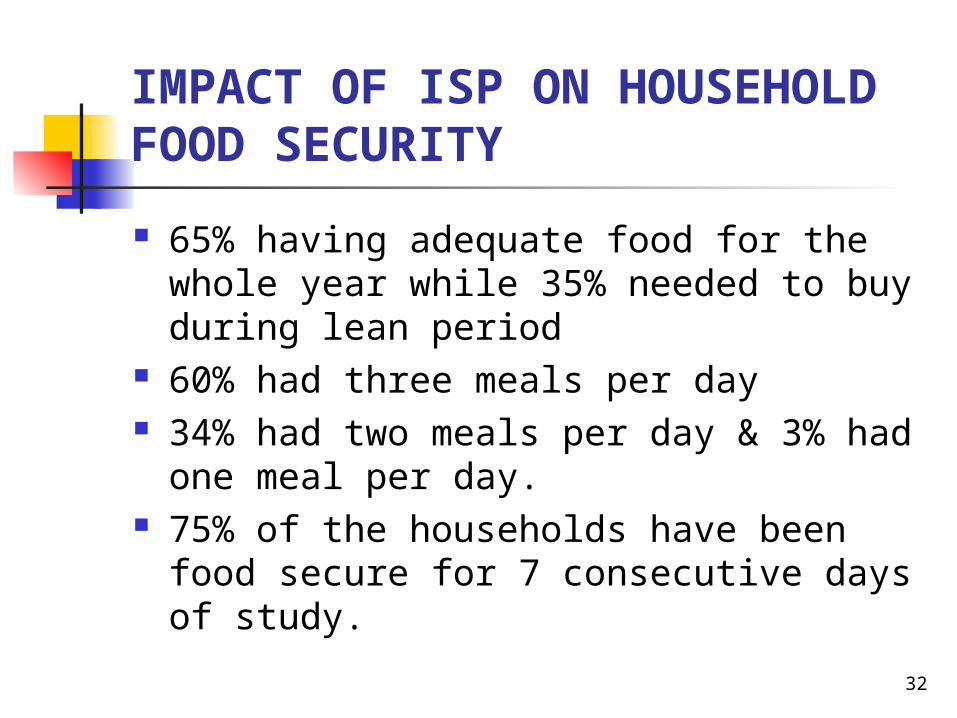
IMPACT OF ISP ON HOUSEHOLD FOOD SECURITY
65% having adequate food for the whole year while 35% needed to buy during lean period
60% had three meals per day 34% had two meals per day & 3% had
one meal per day. 75% of the households have been food
secure for 7 consecutive days of study.
32

FANRPAN Food Security Policy Leadership Award
FANRPAN PRIZE Sponsor Mr. Mark Matunga of Microsoft Corporation announces his organisation’s
prize

FANRPAN Food Security Policy Leadership Award
FANRPAN PRIZE Sponsor Mr. Les Hillowitz of Croplife International announces his organisation’s prize
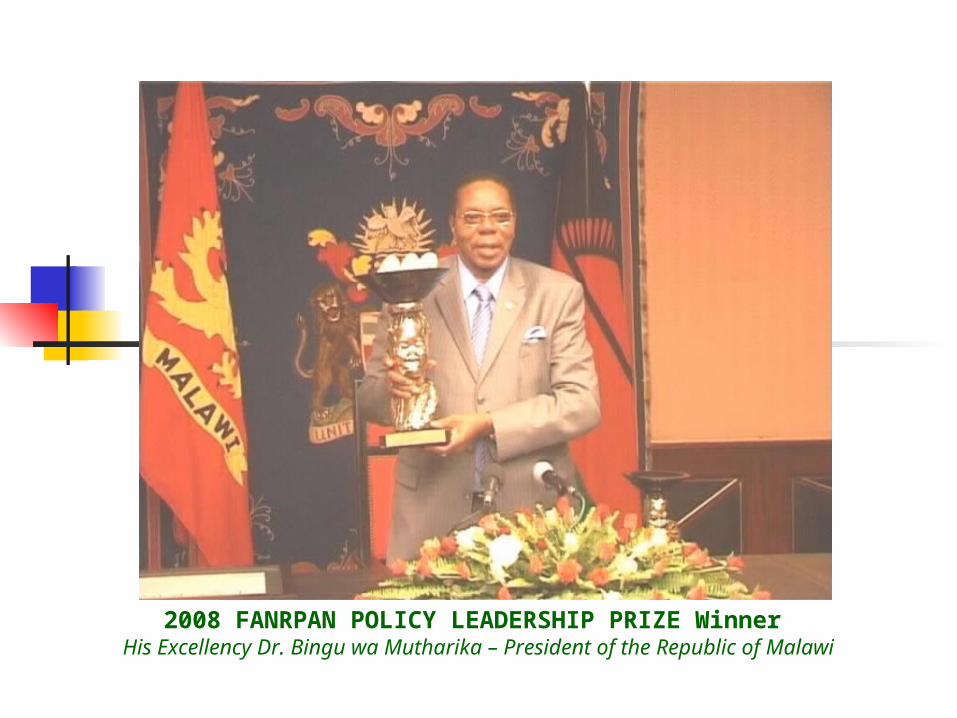
FANRPAN Food Security Policy Leadership Award
2008 FANRPAN POLICY LEADERSHIP PRIZE Winner His Excellency Dr. Bingu wa Mutharika – President of the Republic of Malawi

CONCLUSION There is need to have right policies in place Investment in agriculture is the key to
poverty alleviation Research Extension linkages should be
strengthened Political leadership & commitment is
necessary Collective action (private sector, govt.,
farmers and researchers) is essential for the success of programmes
36

37
AFRICA AND ITS PARTNERS CAN DO IT!!
ZIKOMO – THANK YOU.