Embed Size (px)
Citation preview

1
Adapted from: National Career Development Association Global Conference 2007 presentation: 2004-14 Employment Outlook from the Bureau of
Labor Statistics, Terry Schau, Bureau of Labor Statistics
Used with permission.
Where the Jobs Are

2
The BLS Projections Process
10 year projections; updated every two years
Projections are based on a long-term view of the economy
States underlying assumptions clearly and presents model-based findings
Assumes a long-run full-employment economy

3
Employment Outlook: 2004-14
Industry output and employment
• Occupational employment

4
Service-providing industries continueto lead employment growth
Millions of nonagriculture wage-and-salary jobs
23 22 22
92
110
129
1994 2004 2014, 1994 2004 2014,
Goods producing
Service providing
projected projected

5
Goods-producing and service-providing industries by share of total employment and output, 2004
Percent
15.0
27.3
75.8
66.7
Goods producing Service providing
Nonagriculture wage and salaryemployment
Output

6172241360486
606766807
9831,0051,034
1,1471,305
1,5812,058
2,5564,387
Educational services, privateMiningUtilities
Other servicesTransportation and warehousing
Leisure and hospitalityFederal Government
Wholesale tradeInformation
ConstructionRetail trade
Health care and social assistance
Professional and business servicesFinancial activities
Manufacturing
Two industry sectors—manufacturing and financial activities—accounted for more than one third of total output in 2004
Billions of dollars
Service providingGoods producing
State and local government

7523570
2,7282,7663,183
4,2505,655
6,2106,965
8,05212,479
14,18714,330
15,03516,414
18,891
MiningUtilities
Federal GovernmentEducational services, private
InformationTransportation & warehousing
Wholesale tradeOther services
ConstructionFinancial activities
Leisure and hospitalityHealth care and social assistance
ManufacturingRetail trade
Professional and business servicesState and local government
Nearly 27 percent of all workers held jobs in State and local government and in professional and business services in 2004
Thousands of nonfarm wage-and-salary jobs, 2004
Service providingGoods producing

8
Wage and salary employment growth by industry sector, projected 2004-14 Employment change in thousands
State and local government
Professional and business services
Health care and social assistance
Utilities
Manufacturing
Information
Wholesale trade
Other services
Construction
Financial activities
Educational services, private
Retail trade
Transportation and warehousing
Leisure and hospitality
Mining
-777-46
-8364476506
734
792849898
1,6492,128
2,215
4,2954,566
Service providingGoods producing
9
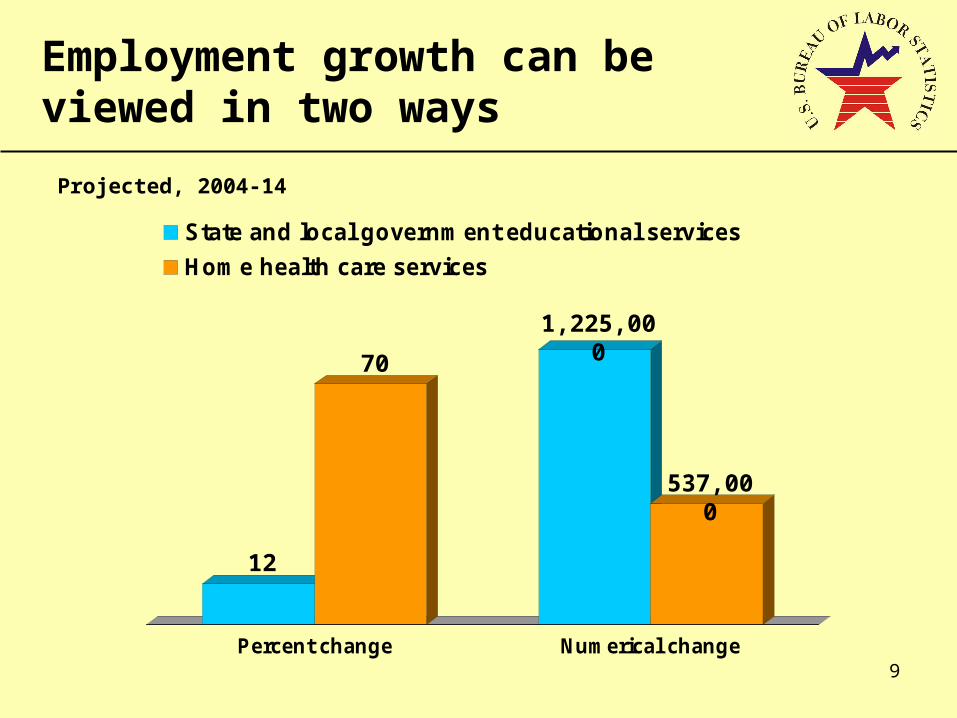
Employment growth can be viewed in two ways
Percent change Numerical change
State and local government educational services
Home health care services
Projected, 2004-14
12
70
1,225,000
537,000

10
47
47
49
50
50
55
61
68
70
The 10 detailed industries with the fastest-growing wage and salary employment, projected 2004-14
Percent change
Educational support services, privateHome health care services
Software publishers
Community care facilities for the elderly
Outpatient care centers, except mental health and substance abuse
Residential mental health and substance abuse facilitiesOffices of all other health practitioners
Residential mental retardation facilitiesFacilities support services
Management, scientific, and technical consulting services
79

11
The 10 detailed industries with the largest wage and salary employment growth, projected 2004-14
Employment change, in thousands
471
472
537
592
648
701
760
764
783
Employment services
Local government educational services
Local government, excluding education and hospitals
Full-service restaurants
General medical and surgical hospitals, private
Limited-service eating places
Home health care services
Colleges, universities, and professional schools, private
Management, scientific, & technical consulting services
Offices of physicians
1,580

12
The industries with the most projected job lossesEmployment change in thousands, projected 2004-14
-37
-38
-40
-46
-48
-53
-56
-65
-140
-168Wired telecommunications carriers
Cut and sew apparel manufacturing
Basic chemical manufacturing
Rubber product manufacturing
Computer and peripheral equipment manufacturing
Crop production, primary job
Semiconductor & other electronic component mfg
Foundries
Fabric mills
Printing and related support activities

13
Employment Outlook: 2004-14
• Industry output and employment
Occupational employment

14
Wage and salary jobs will account for most of the employment growth
Millions of jobs
116.5
12.7
133.5
12.1
152.1
12.4
1994 2004 2014,
Wage and salary Self-employed and unpaid family workers
129.2145.6
164.5
projected

15
Employment in 8 of 10 major occu-pational groups are projected to increasePercent change, projected 2004-14
-1
-.7
6
10
11
11
12
14
19
21
Farming, fishing, and forestry
Production
Office and administrative support
Sales and related
Transportation and material moving
Installation, maintenance, and repair
Construction and extraction
Management, business, and financial
Service
Professional and related

16
Professional workers account for more than 3 out of 10 new jobs
Employment change in thousands, projected 2004-14
-79
-13
657
931
1,116
1,380
1,476
2,155
5,257
6,046
Production
Farming, fishing, and forestry
Installation, maintenance, and repair
Construction and extraction
Transportation and material moving
Office and administrative support
Sales and related
Management, business, and financial
Service
Professional and related

17
7 of the 10 fastest growing detailed occupations are health related, 3 are computer related
Percent change, projected 2004-14
41
43
43
43
44
48
50
52
55
Home health aides
Network systems and data communications analysts
Physician assistants
Computer software engineers, applications
Physical therapist assistants
Dental hygienists
Computer software engineers, systems software
Dental assistants
Personal and home care aides
56
Medical assistants

18
The 10 occupations projected to add the most new jobs
Employment change in thousands, projected 2004-14
287
308
325
350
367
376
440
471
703
736
Waiters and waitresses
Food preparation/serving workers
Retail salespersons Registered nurses
Customer service representativesJanitors and cleaners
Home health aides
Nursing aides
General & operations mgrs.
Personal & home care aides

19
Occupational employment declines often stem from technological change
Numerical change in thousands, projected 2004-14
-42
-43
-48
-49
-59
-63
-93
-93 Sewing machine operators
Stock clerks and order fillers
Farmers and ranchers
File clerks
Order clerks
Mail clerks and mail machine operators, except postal service
Computer operators
Secretaries except legal, medical, and executive
Telemarketers
Cutting, punching, and press machine setters, operators, and tenders, metal and plastic
-115
-155
20
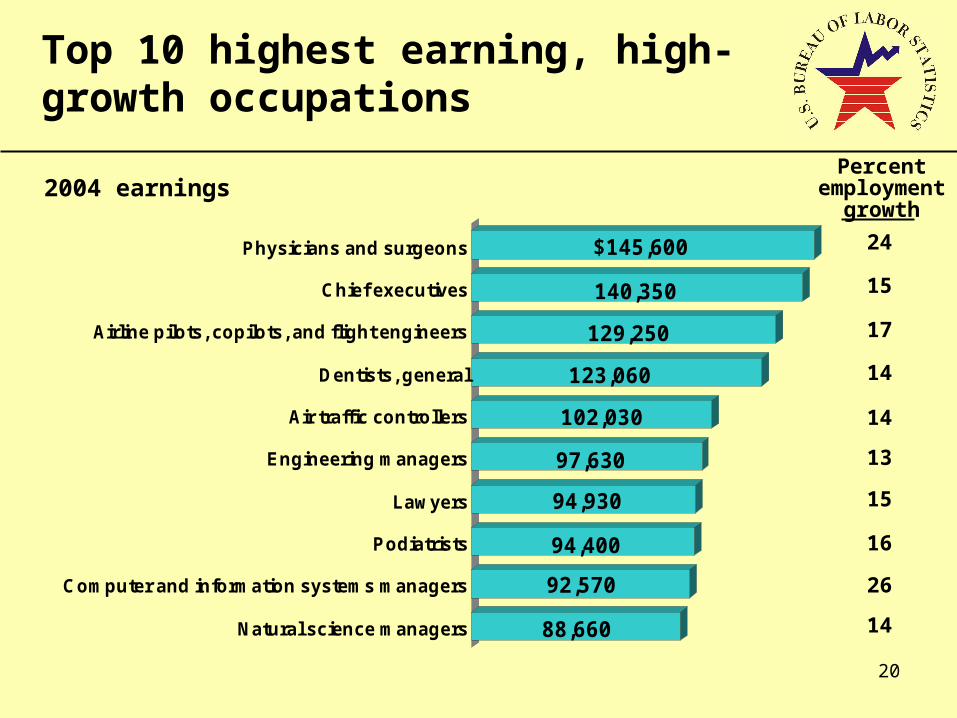
Top 10 highest earning, high-growth occupations
88,660
92,570
94,400
94,930
97,630
102,030
123,060
129,250
140,350
$145,600
Natural science managers
Computer and information systems managers
Podiatrists
Lawyers
Engineering managers
Air traffic controllers
Dentists, general
Airline pilots, copilots, and flight engineers
Chief executives
Physicians and surgeons
2004 earningsPercent
employment growth
24
15
17
14
14
13
15
16
26
14

21
High-wage, high-growth occupations that are projected to add at least 100,000 new jobs
53,460
58,190
60,600
63,450
66,460
74,980
77,420
79,740
94,930
$145,600
Business operations specialists, all other
Network and computer systems administrators
Network systems and data communications analysts
Management analysts
Computer systems analysts
Computer software engineers, applications
General and operations managers
Computer software engineers, systems software
Lawyers
Physicians and surgeons
Thousands of jobs, projected 2004-14 New jobs
136
110
146
308
222
153
122
126
107
242

22
High-wage, high-growth occupations with the largest projected job growth
153
186
202
222
242
264
265
308
524
703
Computer systems analysts
Carpenters
Maintenance and repair workers, general
Computer software engineers, applications
Business operation specialists, all other
Accountants and auditors
Elementary school teachers
General and operations managers
Postsecondary teachers
Registered nurses
Employment in thousands, projected 2004-142004
median earnings
$52,330
51,800
77,420
43,160
50,770
53,460
74,980
30,710
34,900
66,460

23
High-wage, high-growth occupations with the fastest projected job growth
36
37
38
38
43
43
44
48
50
55
Forensic science technicians
Physical therapists
Database administrators
Computer systems administrators
Computer software engineers, systems software
Dental hygienists
Physical therapist assistants
Computer software engineers, applications
Physician assistants
Data communications analysts
Percent growth, projected 2004-14 2004 median
earnings
$60,600
69,410
74,980
37,890
58,350
79,740
58,190
60,650
60,180
44,010

24
Education and Training Pay
NOTE: Unemployment and earnings for workers 25 and older, by educational attainment; earnings for full-time wage and salary workers.
Unemployment rate in 2005 Median weekly earnings in 2005
392
545
605
677
904
1,125
1,365
$1,420
2.1
2.6
3.3
4.2
4.7
7.6
1.1
1.6
Master’s degree
Bachelor’s degree
Associate degree
Some college, no degree
High school graduate
Some high school, no diploma
Professional degree
Doctoral degree

25
Top 10 occupations generally requiring short-term on-the-job training that are projected to grow faster than average, by earnings
2004 median annual earnings
24,990
25,050
26,150
27,450
28,370
28,430
Riggers
Traffic technicians
Parking enforcement workers
Bill and account collectors
Court, municipal, and license clerks
Tree trimmers and pruners
Healthcare support workers, all other
Human resource assistants, except payroll and timekeeping
Transportation workers, all other
Costume attendants
$35,330
33,670
32,170
31,750

26
Top 10 occupations generally requiring moderate-term on-the-job training that are projected to grow faster than average, by earnings
2004 median annual earnings
32,990
33,320
33,870
37,610
40,300
41,120
46,340
47,000
49,290
Sales representatives, technical and scientific products
Subway and streetcar operators
Railroad conductors and yardmasters
All other communication equipment workers
Advertising sales agents
Camera operators, television and video
Bailiffs
Audio-visual collections specialists
Hazardous materials removal workers
Sales representatives, services, all other
$58,580

27
Top 10 occupations generally requiring long-term on-the-job training that are projected to grow faster than average, by earnings
2004 median annual earnings
40,850
41,290
42,430
43,440
44,220
45,210
45,330
48,310
58,710
$102,030Air traffic controllers
Elevator installers and repairers
Insurance appraisers, auto damage
Police and sheriff’s patrol officers
Claims adjusters, examiners, and investigators
Flight attendants
Structural iron and steel workers
Plumbers, pipefitters, and steamfitters
Media and communications, all other
Athletes and sports competitors

28
Top 10 occupations generally requiring an associate degree that are projected to grow faster than average, by earnings
2004 median annual earnings
43,140
43,350
44,010
52,330
52,490
56,450
57,700
58,350
59,200
$59,480Computer specialists, all other
Nuclear technicians
Radiation therapists
Nuclear medicine technologists
Diagnostics medical sonographers
Registered nurses
Forensic science technicians
Radiologic technologists/technicians
Respiratory therapists
Dental hygienists

29
Top 10 occupations generally requiring a bachelor’s degree or higher that are projected to grow faster than average, by earnings
2004 median annual earnings
88,410
88,660
92,570
94,400
94,930
97,630
123,060
129,250
140,350
$145,600Physicians and surgeons
Chief executives
Dentists, general
Lawyers
Podiatrists
Computer/information system mgrs.
Natural sciences managers
Optometrists
Engineering managers
Airline pilots, copilots, and flight engineers

30
Where to go for more information on the BLS 2004-14 projections Employment Projections Internet site:
www.bls.gov/emp Occupational Outlook Handbook, 2006-07 Edition:
www.bls.gov/oco Career Guide to Industries, 2006-07 Edition:
www.bls.gov/cg Occupational Projections & Training Data, 2006-07
Edition: www.bls.gov/emp/optd/home.htm “Charting the Projections: 2004-14” in the
Occupational Outlook Quarterly, Winter 2005-06 issue:www.bls.gov/opub/ooq/ooqhome.htm

31
Where the Jobs Are
Questions?