Embed Size (px)
Citation preview
8/9/2019 1 Acoustics DSP
http://slidepdf.com/reader/full/1-acoustics-dsp 1/43
Basic Acoustics +
Digital Signal Processing
September 11, 2014

8/9/2019 1 Acoustics DSP
http://slidepdf.com/reader/full/1-acoustics-dsp 2/43
Road Map! • For today:
• Part 1: Go through a review of the basics of (analog)
acoustics.
•
Part 2: Converting sound from analog to digital format.
• Any questions so far?
8/9/2019 1 Acoustics DSP
http://slidepdf.com/reader/full/1-acoustics-dsp 3/43
Part 1: An Acoustic Dichotomy
•
Acoustically speaking, there are two basic kinds ofsounds:
1. Periodic
• = an acoustic pattern which repeats over time
•
The “period” is the length of time it takes for the
pattern to repeat
• Periodic speech sounds = voiced segments + trills
2. Aperiodic• Continuous acoustic energy which does not exhibit
a repeating pattern
• Aperiodic speech sounds = fricatives

8/9/2019 1 Acoustics DSP
http://slidepdf.com/reader/full/1-acoustics-dsp 4/43
The Third Wheel
• There are also acoustic transients.
• = aperiodic speech sounds which are not continuous
•
i.e., they are usually very brief
• Transient speech sounds:
• stop release bursts
•
clicks• also (potentially) individual pulses in a trill
• Let’s look at the acoustic properties of each type of sound
in turn…
8/9/2019 1 Acoustics DSP
http://slidepdf.com/reader/full/1-acoustics-dsp 5/43
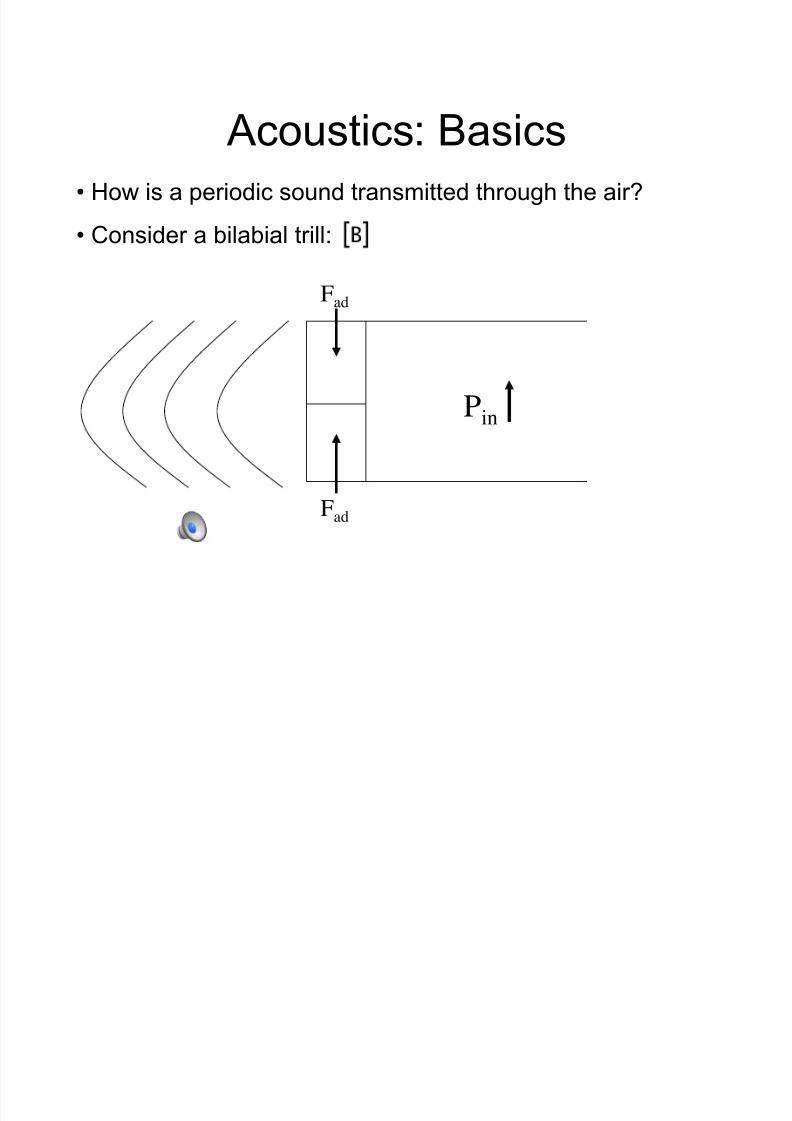
Pin
Fad
Fad
• How is a periodic sound transmitted through the air?
• Consider a bilabial trill:
Acoustics: Basics

8/9/2019 1 Acoustics DSP
http://slidepdf.com/reader/full/1-acoustics-dsp 6/43
What does sound look like?
• Air consists of floating air molecules
• Normally, the molecules are suspended and evenly
spaced apart from each other
•
What happens when we push on one molecule?
8/9/2019 1 Acoustics DSP
http://slidepdf.com/reader/full/1-acoustics-dsp 7/43
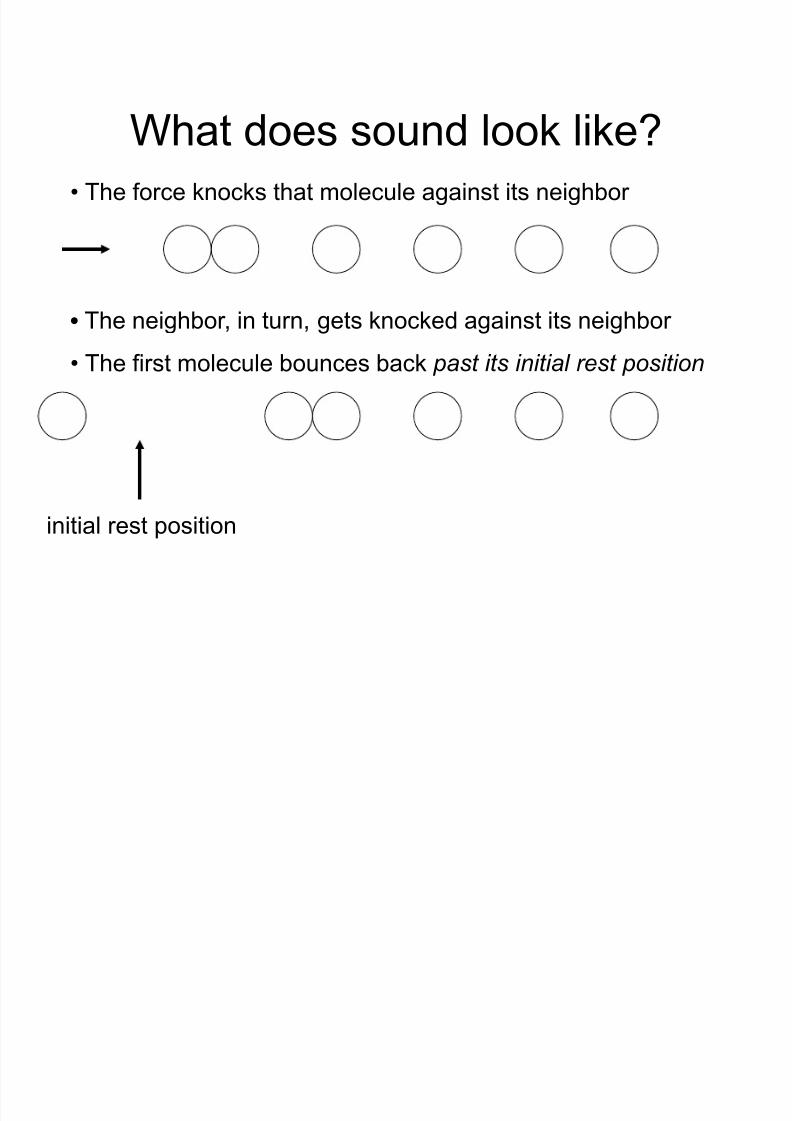
What does sound look like?
• The force knocks that molecule against its neighbor
• The neighbor, in turn, gets knocked against its neighbor
• The first molecule bounces back past its initial rest position
initial rest position

8/9/2019 1 Acoustics DSP
http://slidepdf.com/reader/full/1-acoustics-dsp 8/43
What does sound look like?
• The initial force gets transferred on down the line
rest
position #1
rest
position #2
•
The first two molecules swing back to meet up with each
other again, in between their initial rest positions
• Think: bucket brigade

8/9/2019 1 Acoustics DSP
http://slidepdf.com/reader/full/1-acoustics-dsp 9/43
Compression Wave
•
A wave of force travels down the line of molecules• Ultimately: individual molecules vibrate back and forth,
around an equilibrium point
•
The transfer of force sets up what is called a
compression wave.
• What gets “compressed” is the space between molecules
•
Check out what happens when we blow something up!

8/9/2019 1 Acoustics DSP
http://slidepdf.com/reader/full/1-acoustics-dsp 10/43
Compression Wave
area of high pressure
(compression)
area of low pressure
(rarefaction)
• Compression waves consist of alternating areas of
high and low pressure

8/9/2019 1 Acoustics DSP
http://slidepdf.com/reader/full/1-acoustics-dsp 11/43
Pressure Level Meters
• Microphones
• Have diaphragms, which move back and forth with air
pressure variations
•
Pressure variations are converted into electricalvoltage
• Ears
• Eardrums move back and forth with pressure variations
• Amplified by components of middle ear
• Eventually converted into neurochemical signals
• We experience fluctuations in air pressure as sound

8/9/2019 1 Acoustics DSP
http://slidepdf.com/reader/full/1-acoustics-dsp 12/43
Measuring Sound
• What if we set up a pressure level meter at one point in the
wave?
Time
pressure level meter

8/9/2019 1 Acoustics DSP
http://slidepdf.com/reader/full/1-acoustics-dsp 13/43
Sine Waves
• The reading on the pressure level meter will fluctuate
between high and low pressure values
• In the simplest case, the variations in pressure level will
look like a sine wave.
time
pressure

8/9/2019 1 Acoustics DSP
http://slidepdf.com/reader/full/1-acoustics-dsp 14/43
Other Basic Sinewave concepts
• Sinewaves are periodic; i.e., they recur over time.
• The period is the amount of time it takes for the pattern
to repeat itself.
•
A cycle is one repetition of the acoustic pattern.• The frequency is the number of times, within a given
timeframe, that the pattern repeats itself.
• Frequency = 1 / period
•
usually measured in cycles per second, or Hertz
• The peak amplitude is the the maximum amount of
vertical displacement in the wave
•
= maximum (or minimum) amount of pressure

8/9/2019 1 Acoustics DSP
http://slidepdf.com/reader/full/1-acoustics-dsp 15/43
Waveforms
•
A waveform plots air pressure on the y axis against time onthe x axis.

8/9/2019 1 Acoustics DSP
http://slidepdf.com/reader/full/1-acoustics-dsp 16/43
Phase Shift
•
Even if two sinewaves have the same period andamplitude, they may differ in phase.
• Phase essentially describes where in the sinewave cycle
the wave begins.
• This doesn’t affect the way that we hear the waveform.
• Check out: sine waves vs. cosine waves!
8/9/2019 1 Acoustics DSP
http://slidepdf.com/reader/full/1-acoustics-dsp 17/43
Complex Waves • It is possible to combine more than one sinewave together
into a complex wave.
• At any given time, each wave will have some amplitude
value.
• A1(t1) := Amplitude value of sinewave 1 at time 1
• A2(t1) := Amplitude value of sinewave 2 at time 1
•
The amplitude value of the complex wave is the sum ofthese values.
• Ac(t1) = A1 (t1) + A2 (t1)

8/9/2019 1 Acoustics DSP
http://slidepdf.com/reader/full/1-acoustics-dsp 18/43
Complex Wave Example
• Take waveform 1:
• high amplitude
• low frequency
• Add waveform 2:
• low amplitude
• high frequency
• The sum is this
complex waveform:
+
=

8/9/2019 1 Acoustics DSP
http://slidepdf.com/reader/full/1-acoustics-dsp 19/43
A Real-Life Example
• 480 Hz tone
• 620 Hz tone
• the combo = ?

8/9/2019 1 Acoustics DSP
http://slidepdf.com/reader/full/1-acoustics-dsp 20/43
Spectra
• One way to represent complex waves is with waveforms:
• y-axis: air pressure
• x-axis: time
• Another way to represent a complex wave is with a power
spectrum (or spectrum, for short).
• Remember, each sinewave has two parameters:
• amplitude
•
frequency
• A power spectrum shows:
• amplitude on the y-axis
• frequency on the x-axis
8/9/2019 1 Acoustics DSP
http://slidepdf.com/reader/full/1-acoustics-dsp 21/43
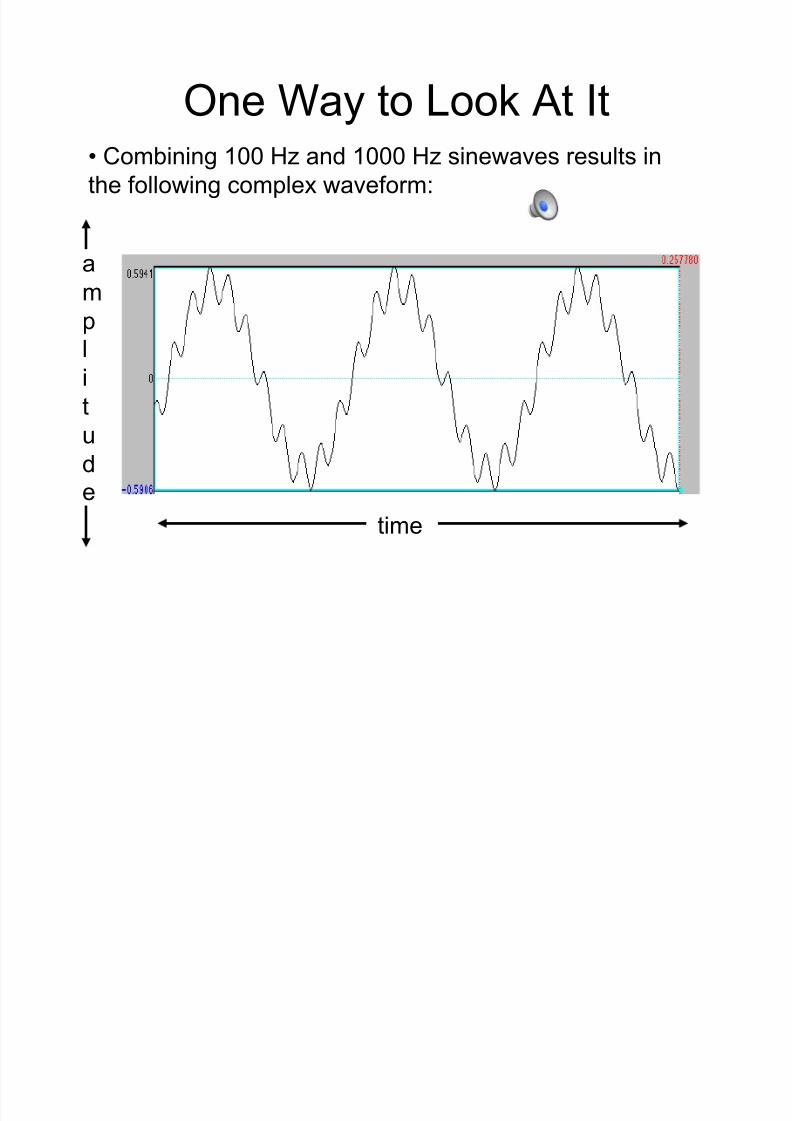
One Way to Look At It •
Combining 100 Hz and 1000 Hz sinewaves results in
the following complex waveform:
a
m
pl
i
tu
de
time

8/9/2019 1 Acoustics DSP
http://slidepdf.com/reader/full/1-acoustics-dsp 22/43
The Other Way
•
The same combination of 100 Hz and 1000 Hz
sinewaves results in the following power spectrum:
a
m
pl
i
tu
de
frequency

8/9/2019 1 Acoustics DSP
http://slidepdf.com/reader/full/1-acoustics-dsp 23/43
The Third Way
•
A spectrogram shows how the spectrum of a complexsound changes over time.
f
r
eq
u
e
n
cy
time
• intensity (related to amplitude) is represented by
shading in the z-dimension.
1000 Hz
100 Hz

8/9/2019 1 Acoustics DSP
http://slidepdf.com/reader/full/1-acoustics-dsp 24/43
Fundamental Frequency
• One last point about periodic sounds:
• Every complex wave has a fundamental frequency (F0).
• = the frequency at which the complex wave pattern
repeats itself.
• This frequency happens to be the greatest common
denominator of the frequencies of the component waves.
• Example: greatest common denominator of 100 and
1000 is 100. (boring!)
• GCD of 480 and 620 Hz is 20.
• GCD of 600 and 800 Hz is 200, etc.
8/9/2019 1 Acoustics DSP
http://slidepdf.com/reader/full/1-acoustics-dsp 25/43
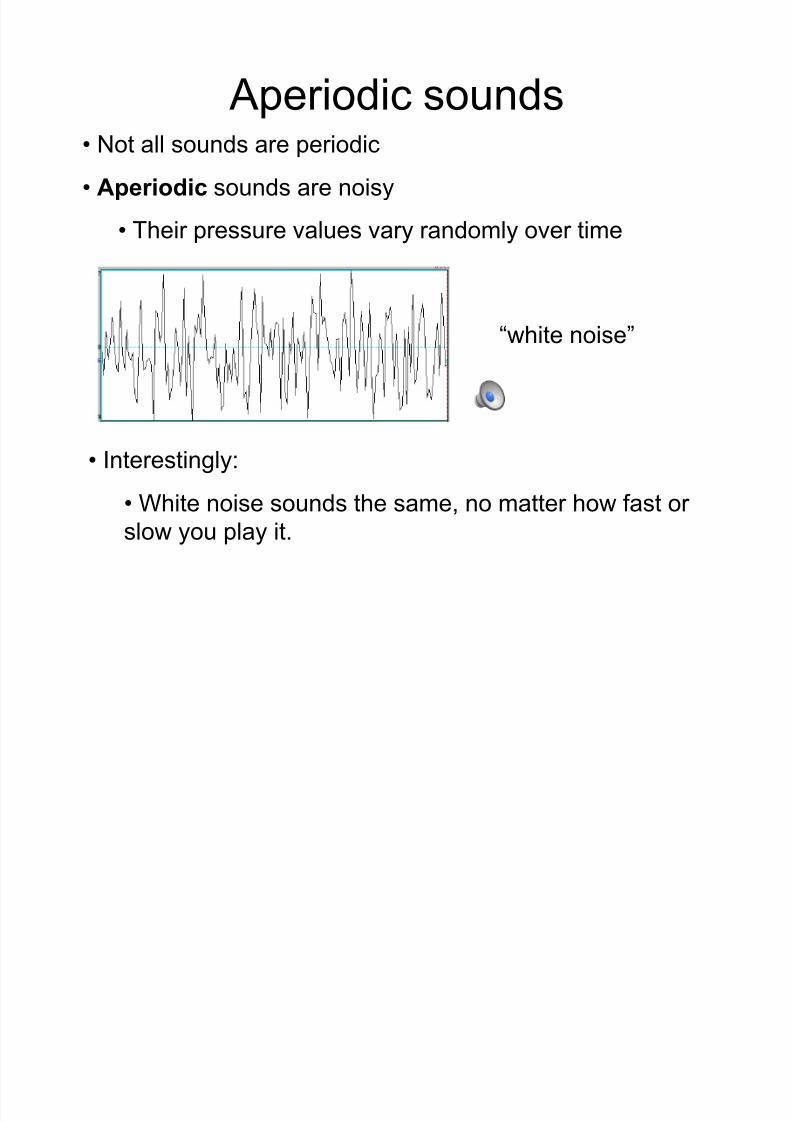
Aperiodic sounds
•
Not all sounds are periodic
• Aperiodic sounds are noisy
• Their pressure values vary randomly over time
“white noise”
• Interestingly:
• White noise sounds the same, no matter how fast or
slow you play it.

8/9/2019 1 Acoustics DSP
http://slidepdf.com/reader/full/1-acoustics-dsp 26/43
Fricatives
•
Fricatives are aperiodic speech sounds
[s]
[f]
8/9/2019 1 Acoustics DSP
http://slidepdf.com/reader/full/1-acoustics-dsp 27/43
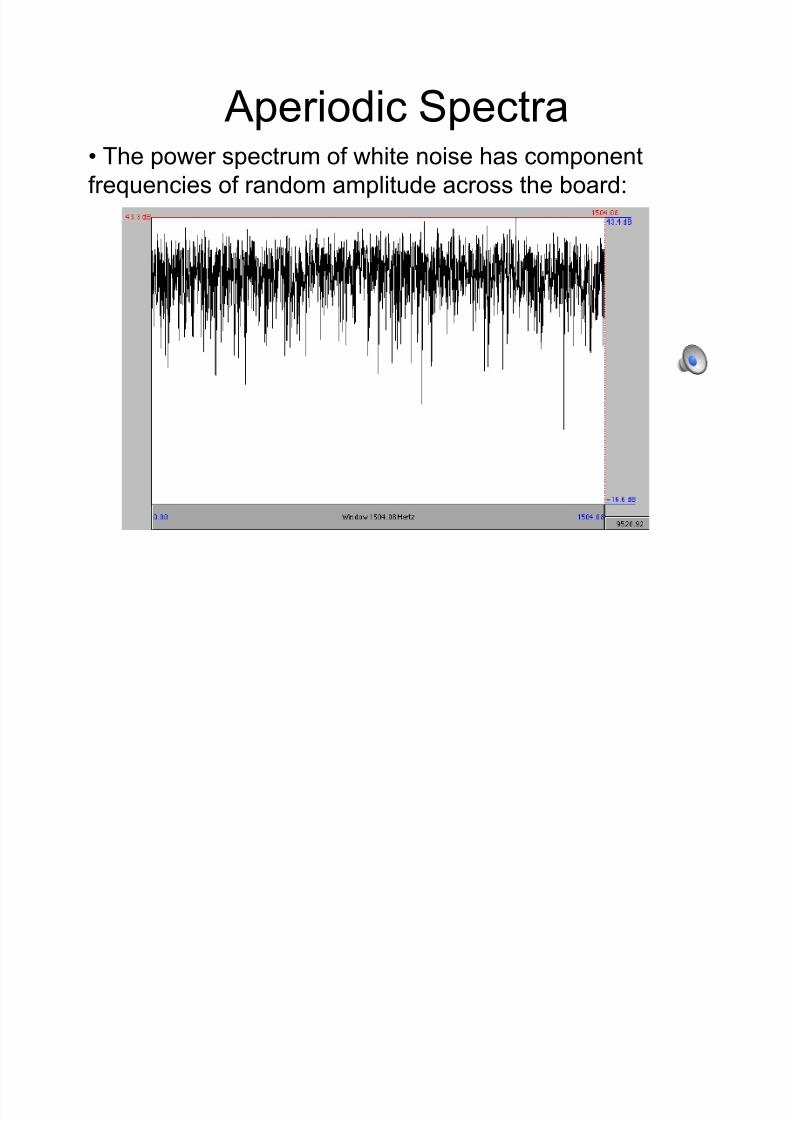
Aperiodic Spectra
•
The power spectrum of white noise has component
frequencies of random amplitude across the board:

8/9/2019 1 Acoustics DSP
http://slidepdf.com/reader/full/1-acoustics-dsp 28/43
Aperiodic Spectrogram • In an aperiodic sound, the values of the component
frequencies also change randomly over time.

8/9/2019 1 Acoustics DSP
http://slidepdf.com/reader/full/1-acoustics-dsp 29/43
Transients
•
A transient is:• “a sudden pressure fluctuation that is not sustained
or repeated over time.”
• An ideal transient waveform:
8/9/2019 1 Acoustics DSP
http://slidepdf.com/reader/full/1-acoustics-dsp 30/43
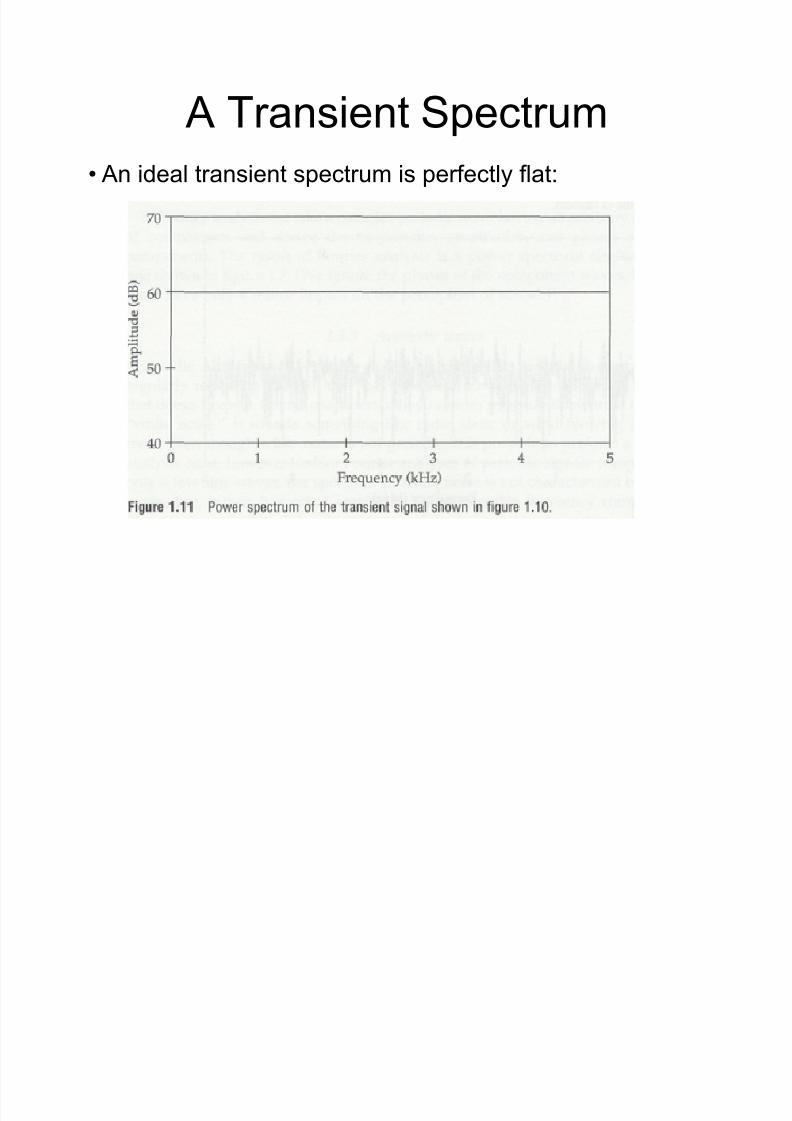
A Transient Spectrum
• An ideal transient spectrum is perfectly flat:

8/9/2019 1 Acoustics DSP
http://slidepdf.com/reader/full/1-acoustics-dsp 31/43
As a matter of fact
• Note: white noise and a pure transient are idealizations
• We can create them electronically…
•
But they are not found in pure form in nature.
• Transient-like natural sounds include:
• Hand clapping
•
Finger snapping• Drum beats
• Tongue clicking

8/9/2019 1 Acoustics DSP
http://slidepdf.com/reader/full/1-acoustics-dsp 32/43
Click Waveform
some periodic
reverberation
initial impulse

8/9/2019 1 Acoustics DSP
http://slidepdf.com/reader/full/1-acoustics-dsp 33/43
Click Spectrum
• Reverberation emphasizes some frequencies more than
others

8/9/2019 1 Acoustics DSP
http://slidepdf.com/reader/full/1-acoustics-dsp 34/43
Click Spectrogram
some periodic
reverberation
initial impulse

8/9/2019 1 Acoustics DSP
http://slidepdf.com/reader/full/1-acoustics-dsp 35/43
Part 2: Analog and Digital
• In “reality”, sound is analog.
• variations in air pressure are
continuous
•
= it has an amplitude value at allpoints in time.
• and there are an infinite number
of possible air pressure values.
•
Back in the bad old days,
acoustic phonetics was strictly
an analog endeavor.
analog clock

8/9/2019 1 Acoustics DSP
http://slidepdf.com/reader/full/1-acoustics-dsp 36/43
Part 2: Analog and Digital
• In the good new days, we can
represent sound digitally in a
computer.
• !
In a computer, sounds must bediscrete.
• everything = 1 or 0 digital clock
• Computers represent sounds as
sequences of discrete pressurevalues at separate points in time.
• Finite number of pressure values.
• Finite number of points in time.

8/9/2019 1 Acoustics DSP
http://slidepdf.com/reader/full/1-acoustics-dsp 37/43
Analog-to-Digital Conversion
•
Recording sounds onto a computer requires an analog-to-digital conversion (A-to-D)
• When computers record sound, they need to digitize
analog readings in two dimensions:
X: Time (this is called sampling)
Y: Amplitude (this is called quantization)
sampling
quantization

8/9/2019 1 Acoustics DSP
http://slidepdf.com/reader/full/1-acoustics-dsp 38/43
Sampling Example
0 20 40 60 80 100-100000
1
0
nominal time
amplit
o
o
o
o
o
o
o
o
o
o
o
o
o
o
o
o
o
o
o
o
o
Thanks to Chilin Shih for making these materials available.

8/9/2019 1 Acoustics DSP
http://slidepdf.com/reader/full/1-acoustics-dsp 39/43
Sampling Example

8/9/2019 1 Acoustics DSP
http://slidepdf.com/reader/full/1-acoustics-dsp 40/43
Sampling Rate
• Sampling rate = frequency at which samples are taken.
• What’s a good sampling rate for speech?
• Typical options include:
•
22050 Hz, 44100 Hz, 48000 Hz
• sometimes even 96000 Hz and 192000 Hz
• Higher sampling rate preserves sound quality.
•
Lower sampling rate saves disk space.
• (which is no longer much of an issue)
• Young, healthy human ears are sensitive to sounds from
20 Hz to 20,000 Hz

8/9/2019 1 Acoustics DSP
http://slidepdf.com/reader/full/1-acoustics-dsp 41/43
One Consideration
•
The Nyquist Frequency
• = highest frequency component that
can be captured with a given sampling
rate
• = one-half the sampling rate
Problematic Example:• 100 Hz sound
• 100 Hz sampling rate
samples 1 2 3
Harry Nyquist
(1889-1976)

8/9/2019 1 Acoustics DSP
http://slidepdf.com/reader/full/1-acoustics-dsp 42/43
Nyquist’s Implication
• An adequate sampling rate has to be…
• at least twice as much as any frequency components in
the signal that you’d like to capture.
• 100 Hz sound
•
200 Hz sampling rate
samples 1 2 3 4 5 6

8/9/2019 1 Acoustics DSP
http://slidepdf.com/reader/full/1-acoustics-dsp 43/43
Sampling Rate Demo
• Speech should be sampled at at least 44100 Hz
• (although there is little frequency information in speech
above 10,000 Hz)
• 44100 Hz
• 22050 Hz
•
11025 Hz (watch out for [s])
• 8000 Hz
•
5000 Hz