Embed Size (px)
Citation preview

Policy ReseaRch WoRking PaPeR 4620
Dollar a Day Revisited
Martin RavallionShaohua ChenPrem Sangraula
The World BankDevelopment Research GroupDirector's officeMay 2008
WPS4620P
ublic
Dis
clos
ure
Aut
horiz
edP
ublic
Dis
clos
ure
Aut
horiz
edP
ublic
Dis
clos
ure
Aut
horiz
edP
ublic
Dis
clos
ure
Aut
horiz
edP
ublic
Dis
clos
ure
Aut
horiz
edP
ublic
Dis
clos
ure
Aut
horiz
edP
ublic
Dis
clos
ure
Aut
horiz
edP
ublic
Dis
clos
ure
Aut
horiz
ed

Produced by the Research Support Team
Abstract
The Policy Research Working Paper Series disseminates the findings of work in progress to encourage the exchange of ideas about development issues. An objective of the series is to get the findings out quickly, even if the presentations are less than fully polished. The papers carry the names of the authors and should be cited accordingly. The findings, interpretations, and conclusions expressed in this paper are entirely those of the authors. They do not necessarily represent the views of the International Bank for Reconstruction and Development/World Bank and its affiliated organizations, or those of the Executive Directors of the World Bank or the governments they represent.
Policy ReseaRch WoRking PaPeR 4620
The paper presents the first major update of the international “$1 a day” poverty line, first proposed in 1990 for measuring absolute poverty by the standards of the world’s poorest countries. In a new data set of national poverty lines we find that a marked economic gradient only emerges when consumption per person is above about $2.00 a day at 2005 purchasing power
This paper—a product of the Director's office, Development Research Group—is part of a larger effort in the department to monitor the developing world's progress against poverty. Policy Research Working Papers are also posted on the Web at http://econ.worldbank.org. The authors may be contacted at [email protected], [email protected] and [email protected].
parity. Below this, the average poverty line is $1.25, which we propose as the new international poverty line. Relative poverty appears to matter more to developing countries than has been thought. The authors’ proposed schedule of relative poverty lines is bounded below by $1.25, and rises at a gradient of $1 in $3 when mean consumption is above $2.00 a day.

Dollar a Day Revisited
Martin Ravallion, Shaohua Chen and Prem Sangraula1
Development Research Group, World Bank 1818 H Street NW, Washington DC, 20433, USA
Keywords: Global poverty, subjective poverty lines, purchasing power parity
JEL classifications: I32, E31, O10
1 The authors have benefited from useful discussions, comments and other forms of help from Yonas Biru, Angus Deaton, Yuri Dikhanov, Olivier Dupriez, Francisco Ferreira, Alan Heston, Norman Loayza, Branko Milanovic, Halsey Rogers, Luis Serven, Changqing Sun, Eric Swanson, Fred Vogel and seminar participants at the World Bank. These are the views of the authors and should not be attributed to the World Bank or any affiliated organization. Addresses: [email protected], [email protected] and [email protected].

1. Introduction
It has long been recognized in the literature on poverty measurement that people at
different levels of living tend to hold different views about what “poverty” means.2 The critical
level of spending that a poor person would deem to be adequate in order to escape poverty is
likely to be lower than the level a rich person would deem adequate to avoid becoming poor.
Does this economic gradient in the standards used to define poverty hold between
countries, as well as within a given country? Ravallion, Datt and van de Walle (RDV) (1991)
studied how poverty lines varied with mean consumption when both were converted to a
common currency at purchasing power parity (PPP) (meaning that the currency conversion rate
is intended to assure a common purchasing power over commodities). Amongst the poorest
countries, poverty lines tend to be low, and they show little or no economic gradient. However,
RDV also found that, above a critical level of mean consumption, the national poverty line tends
to rise sharply with mean consumption, with an elasticity approaching unity in rich countries. It
can thus be argued that absolute poverty (whereby the poverty line has constant real value) is the
more relevant concept in poor countries, while relative poverty (in which the poverty line is
proportional to the mean) is more salient in rich countries.
Why do national poverty lines have this economic gradient? Poverty lines are typically
anchored to nutritional requirements, which tend to be similar between people in poor and rich
countries. So differences in nutritional requirements are probably not the reason. More
plausibly, as living standards rise generally, there is a change in the prevailing notions of what
(food and non-food) consumption needs should be met if one is to not be deemed “poor;” people
are expected to be able to afford more expensive calories (more meat and vegetables and higher
quality foodgrains), have more varied diets, and be better clothed and housed. By this view,
poverty is a socially-specific concept, whereby the consumption needs for escaping poverty in a
given society depend on what people generally consume in that society.
How then should we judge the extent of poverty in the world as a whole? One might use
the poverty lines that prevail in each country (or that one would expect given the country’s mean
consumption). But then the resulting aggregate poverty measures would not be treating people at
the same level of real consumption the same way. And by treating absolutely poor people
2 See, for example, Groedhart et al. (1977), Kapteyn, Kooreman and Willemse (1988) and Pradhan and Ravallion (2000).
2

similarly to relatively poor people one would risk diverting the focus away from what is surely
the highest priority: to raise the living standards of the poorest in the world. An absolute
measure is also defensible on welfarist grounds under the common assumption that individual
welfare depends on own-consumption.3 But what absolute line should be used? Prior to RDV,
absolute poverty lines for global poverty measurement had been set in an arbitrary way.4
Motivated by these observations, RDV and World Bank (1990) proposed that global
poverty should be measured by the standards of the poorest countries. The latest available
estimates of the extent of poverty by this measure used an international poverty line of $32.74
per month, or $1.08 a day, at 1993 PPP, based on the original set of national poverty lines in
RDV (Chen and Ravallion, 2001). In 2004, about one in five people in the developing world
(one billion people) were deemed to be poor by this standard (Chen and Ravallion, 2007).
This is clearly a conservative basis for measuring global poverty. One could hardly argue
that the people in the world who are poor by the standards of the poorest countries are not in fact
poor. This gives the global poverty line a salience in focusing on the world’s poorest that a
higher line would not have. At the other extreme, suppose one judged poverty in developing
countries by (say) US standards. Learning that (possibly) 95% or more of the population is poor
by such a standard is unlikely to have much relevance, given that US standards of living are not
within the foreseeable reach of most people in a typical developing country.5
Relative poverty measures can also be defended if one believes poverty should ultimately
be measured in the space of welfare and that relative deprivation matters to a person’s welfare.6
Chen and Ravallion (2001, 2004) provide estimates of relative poverty measures in which a
person is not poor if she meets a “$1 per day” absolute consumption standard and consumes
more than one third of the mean consumption in the country of residence; a coefficient of one
third gave the best fit to the RDV data set on poverty lines (Chen and Ravallion, 2001).7 But
3 This is unlikely to be a sufficient statistic; supplementary measures will be needed to capture other aspects of welfare, notably access to non-market goods (such as health and schooling). These supplementary measures should aim to capture those things that are missing from a standard consumption aggregate, and one should try to avoid double counting; for further discussion see Ravallion (1996). 4 Prior to RDV the World Bank had used explicitly arbitrary lines; see Ahluwalia (1974). 5 For example, Pritchett (2006) proposes a poverty line of around $10 a day; we calculate (using PovcalNet: http://econ.worldbank.org/povcalnet) that 95% of the developing world’s live below this line. 6 For further discussion of the theory and evidence on this point see Ravallion (2008). 7 This simple structure for a schedule of relative poverty lines was proposed by Atkinson and Bourguignon (2001), who discuss the rationale further.
3

notice that even by this approach to measuring poverty, the precise location of the “$1 a day”
line is of relevance as a lower bound to the relative lines.
This paper revisits the problem of setting an international poverty line in the light of a
great deal of new data. There are two important sources of that data. The first is the new set of
PPP’s produced from the 2005 round of the International Comparison Program (ICP) (World
Bank, 2008a). This is the most ambitious round to date of the ICP (which began in 1968), and it
is expected to entail a substantial improvement in data quality. The second source is a new data
base of national poverty lines across developing countries (compiled for the purpose of this
paper). Past work has been based on the compilation of poverty lines for the 1980s used by
RDV. Our new data set covers the period since 1990, drawing on the large number of new
country-specific poverty studies for developing countries that have been done since 1990 under
the World Bank’s program of country Poverty Assessments.
We begin with a simple model of a socially-specific poverty line, which helps motivate
and interpret our empirical analysis. We present in section 3 our new compilation of national
poverty lines across countries. The pattern predicted by our theoretical analysis is in evidence:
the national poverty line rises with mean consumption, although with a low elasticity at low
consumption. Based on these empirical results, our proposed new poverty lines are discussed in
section 4, including both absolute and relative lines. Section 5 compares our proposed new
international poverty lines to past lines. Section 6 discusses how our main results change with
alternative PPP’s. Section 7 concludes.
2. The social subjective poverty line
An important strand of the literature on welfare and poverty measurement has formalized
the idea of what can be termed a “social subjective poverty line” (SSPL): the point in the income
space above which people tend to think they are not poor in a given society, and below which
they tend to think they are poor.8 Underlying the idea of a SSPL is the premise that an
individual’s own idea of what it means to be “poor” depends on that individual’s own level of
living. There is now a large body of evidence consistent with that premise.9
8 Contributions include Groedhart, Halberstadt, Kapteyn and van Praag (1977), Hagenaars and van Praag (1985), Kapteyn, Kooreman and Willemse (1988) and Pradhan and Ravallion (2000). 9 See the previous footnote for examples.
4

It can also be postulated that there is a social effect on the idea of what poverty means to
an individual at given own income. Psychologists, sociologists and some economists have argued
that the circumstances of the individual relative to others in the relevant setting influence
perceptions of well-being.10 Most of this literature has concerned (explicitly or not) developed
countries. Whether such a social effect on the concept of what “poverty” means is also relevant
in developing countries remains an open question.
Poverty lines found at the country level do not explicitly claim to be SSPL’s. More
commonly they are based on the estimated cost of a set of basic consumption needs, typically
anchored to nutritional requirements for good health. However, there is ample scope in the
practice of poverty measurement to choose the parameters of a poverty line such that the
resulting line is likely to be socially accepted in the given setting. Indeed, it would seem
unlikely that any national poverty line would be accepted in practice if it differed significantly
from the SSPL. In other words, it can be argued that the SSPL is the more fundamental concept
underlying the “objective” poverty lines found in practice.
We postulate that the poverty line used in a given county is the country’s SSPL.11 Each
individual has a personal poverty line (z) that depends on own consumption or income (y). This
relationship is specific to a given country. Quite generally, we can postulate that the functional
form relating z to y is country specific. We specialize this further by postulating that the
relationship depends on mean consumption in the country at large (C), which is taken to capture
the social effect on personal subjective poverty lines. We write this relationship as:
),( Cyz ϕ= for (1) ],[ maxmin yyy∈
A unique national poverty line can be derived if we make three assumptions about ϕ : (i)
the function is continuously differentiable in y and C and strictly increasing and continuous in y
and non-decreasing in C; (ii) the poorest person thinks that she is poor ( ) while the
richest person does not ( ); and (iii) an increase in own income reduces the
subjective poverty gap, i.e., that
0),( min >Cyϕ
maxmax ),( yCy <ϕ
),( 1<Cyyϕ . These assumptions imply (on invoking the
intermediate value theorem) a unique SSPL (Z), defined implicitly by the fixed point:
10 Runciman (1966) provided an influential exposition, and supportive evidence. Also see the discussions in Scitovsky (1978), Easterlin (1995) and Oswald (1997). 11 In the empirical implementation we will allow for a country-specific error term, encompassing idiosyncratic differences in the data and methods used as well as measurement errors.
5
)(),( CfCZZ == ϕ (2)
Note that for all C (under assumption iii). 0)(' ≥Cf
As a special case, suppose that the social effect on personal subjective poverty only
emerges when the mean consumption of the society in which one lives is above some critical
level, ; i.e., *C )(),( yCy ϕϕ = for and *CC ≤ ),( Cyϕ is strictly increasing in C for .
The interpretation is that in very poor countries levels of living are so low generally that there is
little scope for personal feelings of relative deprivation.
*CC >
0)(
12 Then it is evident that the aggregate
relationship between the SSPL and mean consumption will have the property that ' =Cf for
. The value of is the lower bound to national poverty lines. *CC ≤ )*(* CfZ =
The rest of this paper studies the relationship between national poverty lines and mean
consumption, to see whether there is evidence of a social effect and (if so) whether there is an
identifiable (positive) lower bound to the poverty line. This matters for both a relative measure
of global poverty—the lower bound to the poverty line in the world is then taken to be the lower
bound to any set of relative poverty lines—as well (of course) to an absolute poverty measure.
We begin by presenting our new cross-country data set on poverty lines in developing countries.
3. National poverty lines across developing countries
The set of national poverty lines collected by RDV covered 33 countries (both developed
and developing) and drew on specialized, country-specific, mostly academic, studies of poverty
spanning 1980-90. Clearly, this data set is now rather old.13
Since RDV, there has been considerable expansion in research and analysis on poverty in
developing countries through the World Bank’s country-level Poverty Assessments (PA’s),
which have now been done for many developing countries (though there were very few PA’s
available in 1990). These are core reports within the Bank’s program of analytic work at country
level; each report describes the extent of poverty and its causes in that country. The Bank’s PA
12 Ravallion and Lokshin (2007) provide survey-based evidence for one of the poorest countries, Malawi, indicating that relative deprivation is not a welfare concern to the bulk of the population, though they do find that it matters to better off groups in urban areas. For a theoretical analysis in a model combining risk sharing with positional goods see Ravallion (2008a). 13 The only prior update was done by Ravallion (1998), who tested the effect of including a number of new observations for Africa (which was clearly under-represented in the Ravallion et al., 1991, data set). The main result of the earlier study by RDV on the relationship between poverty lines and mean consumption was found to be quite robust to including these extra observations.
6

for a given country is done in consultation with the government and most PA’s can claim
government ownership. Most low-income countries have also done Poverty Reduction Strategy
Papers (PRSP’s). A PRSP is actually done by the government, though often with some financial
support from aid donors. A large share of the work on either a PA or (though less so) a PRSP
typically goes into the poverty measurement aspects (including poverty profiles). Both a PA and
PRSP will typically lay out what is known about poverty in each country (the poverty profile as
well as the aggregate poverty statistics and how they have changed over time). The PA’s and
PRSP’s are clearly an important source of information on the accepted national poverty lines in
developing countries (though they are confined to developing countries).
For the purpose of this paper we compiled a new data set of 88 national poverty lines
from the most recent PA’s, PRSP’s and other sources over 1990-2005. The Appendix (Table
A1) provides details. (In no case do the sources overlap with RDV.) In the source documents,
each poverty line is given in the prices for a specific survey year (for which the subsequent
poverty measures are calculated). In about three-quarters of the sample observations the poverty
line was calculated from the same survey; in other cases (such as India) a pre-existing national
poverty line was updated using the consumer price index.
The fact that the PA is a World Bank report raises two concerns. Firstly, it might be
conjectured that these are external poverty liens, rather than poverty lines that are accepted by
each country, thus raising a doubt about their interpretation as SSPL. However, the process of
producing a PA entails (often extensive) consultation with the government of that country,
including discussion is about the most appropriate poverty line. Thus, this new set of poverty
lines has a stronger claim to be national poverty lines than those used by RDV, which were
largely based on academic studies.
Second, it might be thought that the poverty lines that World Bank reports and PRSP’s
use might be biased toward the Bank’s international poverty line. This is not a serious concern in
our view. The PA’s (and PRSP’s) typically either use a pre-existing national poverty line or
derive a new line, and in both cases the line has no obvious origins in the Bank’s “$1 a day”
poverty line. Their aim is to use a poverty line appropriate to that country. In 80% of cases,
some version of the “cost of basic needs” method has been used.14 By this method, the food
component of the poverty line is the expenditure needed to reach a food bundle, specific to each
14 This method, and alternatives, are discussed in detail in Ravallion (1994, 2008a).
7

country (or each region) that yields a stipulated food energy requirement; a common figure is
2100 calories per person per day. To this is added an allowance for non-food spending, which is
typically anchored to the non-food spending of people whose food spending (or sometimes total
spending) is near the food poverty line. There is considerable scope for discretion in setting such
a poverty line. Although the stipulated food-energy requirements are similar, there are (of
course) multiple food bundles that can yield a given food energy intake, and some will be
preferable to others in any given context. The non-food spending that is deemed adequate will
also vary. The judgments made in setting the various parameters of a poverty line are likely to
reflect prevailing notions of what poverty means in each country setting.
In converting these lines to a common currency we use the household consumption PPP’s
from the 2005 ICP, as documented in World Bank (2008a) (although we consider alternative
PPP’s later).15 The 2005 ICP is clearly the most complete assessment to date of how the cost of
living varies across countries. The ICP collected primary data on a region-specific list of prices
for 600-1000 (depending on the region) goods and services, grouped under 155 “basic headings”
deemed to be comparable across the 146 countries (including OECD countries). The prices were
obtained from a large sample of outlets in each country. The world was divided into six regions
for the 2005 ICP with different product lists for each. All regions participated, but the
participation rate was lower for Latin America.
The 2005 ICP is a clear improvement over 1993—the last year used for global poverty
measurement. The number of countries participating in the price survey is larger (146, as
compared to 117 in 1993) and the surveys have been implemented on a more scientific basis.
New methods were used for measuring government compensation and housing. Adjustments
were also made for the lower average productivity of the public sector workers in developing
countries (lowering the imputed value of the services derived from public administration,
15 The ICP price surveys started in 1968. Prior to 2000, the Penn World Tables (PWT; see, Summers and Heston, 1991) were the main source of the PPP rates for consumption derived from the ICP, as used in the Bank’s global poverty measures. In 2000 we switched to the 1993 PPPs estimated by the Bank’s Development Data Group; the most recent results are reported in World Bank (2008). There are methodological differences in these two sets of PPPs. The PWT used the Geary-Khamis (GK) method, while the Bank used the EKS method, which is the multilateral extension of the bilateral Fisher index. On the differences between the GK and EKS methods and implications for global poverty measures see Ackland et al. (2006). There were also improvements in country coverage and data quality in the 1993 PPPs as compared to PWT. However, there were also a number of problems in the implementation of the 1993 ICP round in developing countries, as discussed in Ahmed (2003).
8

education and health). Ring comparisons (linking regional PPP estimates through global prices)
were done for more countries (18 in all—a marked improvement over past ICP rounds). The
2005 data were also subject to more rigorous supervision and validation methods than the 1993
round, including stricter standards in defining internationally comparable quality standards for
the goods identified in the ICP price surveys. Otherwise, the PPP’s calculated from the ICP data
(and in World Bank, 2008a) follow standard methods; as in the past, the Bank uses a multilateral
extension of the bilateral Fisher price index.16
For each country, the national poverty line was converted to 2005 $’s using the individual
consumption PPP from World Bank (2008a). The 2005 PPP was not available for 11 of the 88
countries (due mainly to the poor ICP coverage in Latin America) and was deemed unreliable for
one country (Zimbabwe).17 Allowing for missing PPPs and other data problems, we have 75
poverty lines.18 (The Appendix gives details on the countries with missing data.) Figure 1 gives
the density function of the poverty lines (using a normal kernel). The national poverty lines at
2005 PPP range from $19.05 to $275.71 per month, with a mean of $87.59 and median of
$60.81. (The standard deviation is $66.22.) The mode is slightly under $50 per month.
While the ICP aimed to survey prices that were nationally representative, this was not
always the case. The main source of sampling bias appears to be that the surveys were confined
to urban areas in a number of countries. For example, in the case of China, the ICP survey was
confined to 11 cities. Although the survey included some surrounding rural areas, it cannot be
considered representative of rural China (Chen and Ravallion, 2008a). Based on ICP sampling
information we treat the 2005 consumption PPP’s as an urban PPP’s for the following countries:
Argentina, Brazil, Bolivia, Cambodia, Chile, China, Colombia, Ecuador, Pakistan, Peru,
Thailand and Uruguay. For these countries, the poverty line is an urban poverty line.
We follow RDV in using private consumption expenditure (PCE) per capita from the
National Accounts (NAS) as the measure of economic welfare. (More precisely we use what is
termed “Household Final Consumption Expenditure.”) The sample mean PCE is $209.40 per 16 As was argued in Ravallion et al. (1991), the weights attached to different commodities in the conventional PPP rate may not be appropriate for the poor. Results reported in Deaton and Dupriez (2008) do not suggest that the re-weighting needed to derive a “PPP for the poor” will have much impact on the aggregate consumption PPP. Later we test sensitivity to using the Deaton-Dupriez PPP. 17 The 2005 consumption PPP implies a poverty line of $6 per month, which is very hard to believe. 18 One country, Madagascar, was dropped because of large inconsistencies in the data from various sources (national accounts aggregates reported by the Bank versus the International Monetary Fund). Using the Bank’s estimate of PCE, the poverty line was almost three times mean consumption.
9
month ($6.89 per day) at 2005 PPP; 15 of our sampled countries have PCE less than $60 per
month, or about $2.00 a day; the poorest country is Malawi with a PCE per capita of $1.03 a day.
Figure 1 also gives the density function for PCE per capita; the modes are not far apart, but
otherwise the distributions are very different, with PCE showing much greater spread.
The alternative to PCE from the NAS is to use mean household consumption or income
from the relevant survey. However, in many cases the poverty line was calculated from that
same survey, so the relationship seen between the national poverty line and the survey mean may
be spurious, being driven by common measurement errors. Consider, for example, the most
popular method of setting a national poverty line, in which a predetermined food bundle is
valued in the country (or each region) and an allowance added for non-food spending based on
the food Engel curve. An under-estimation of non-food spending in the survey will shift the
Engel curve and so automatically adjust the poverty line downwards. The measurement error will
generate a positive correlation between the poverty line and the survey mean.19 As long as the
measurement errors in the NAS are largely independent of those in the surveys, PCE will be a
better indicator. However, we also test the sensitivity to using the survey means instead.
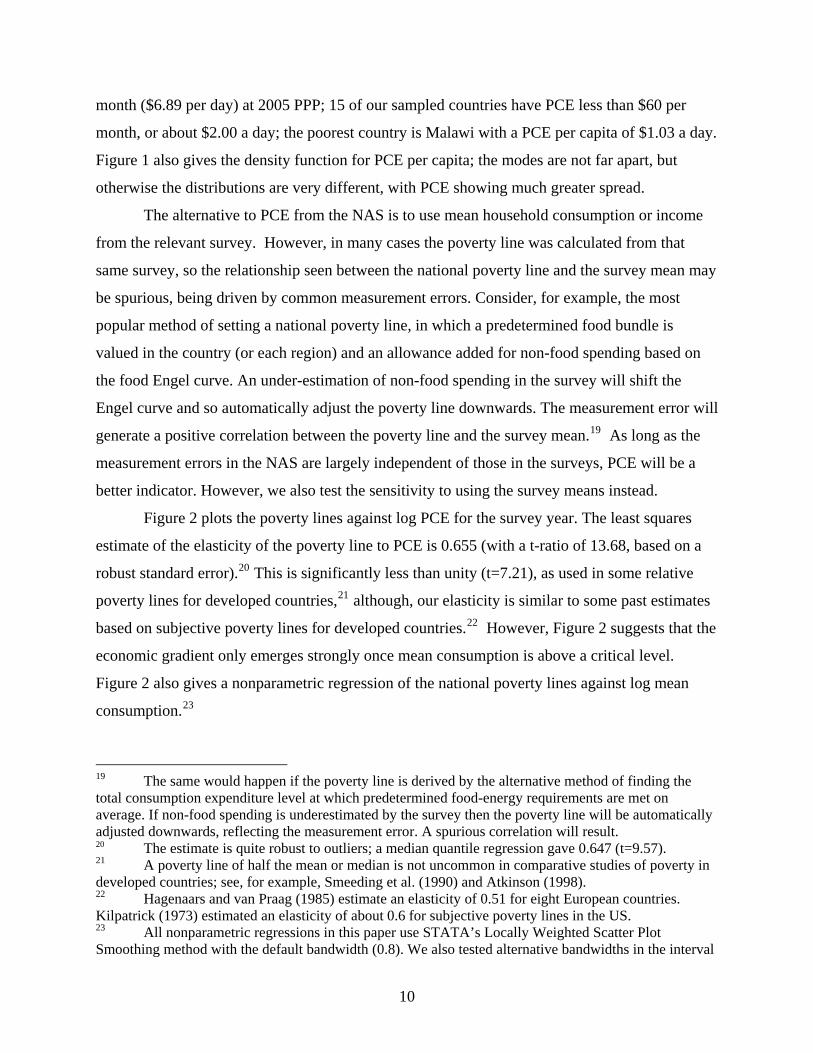
Figure 2 plots the poverty lines against log PCE for the survey year. The least squares
estimate of the elasticity of the poverty line to PCE is 0.655 (with a t-ratio of 13.68, based on a
robust standard error).20 This is significantly less than unity (t=7.21), as used in some relative
poverty lines for developed countries,21 although, our elasticity is similar to some past estimates
based on subjective poverty lines for developed countries.22 However, Figure 2 suggests that the
economic gradient only emerges strongly once mean consumption is above a critical level.
Figure 2 also gives a nonparametric regression of the national poverty lines against log mean
consumption.23
19 The same would happen if the poverty line is derived by the alternative method of finding the total consumption expenditure level at which predetermined food-energy requirements are met on average. If non-food spending is underestimated by the survey then the poverty line will be automatically adjusted downwards, reflecting the measurement error. A spurious correlation will result. 20 The estimate is quite robust to outliers; a median quantile regression gave 0.647 (t=9.57). 21 A poverty line of half the mean or median is not uncommon in comparative studies of poverty in developed countries; see, for example, Smeeding et al. (1990) and Atkinson (1998). 22 Hagenaars and van Praag (1985) estimate an elasticity of 0.51 for eight European countries. Kilpatrick (1973) estimated an elasticity of about 0.6 for subjective poverty lines in the US. 23 All nonparametric regressions in this paper use STATA’s Locally Weighted Scatter Plot Smoothing method with the default bandwidth (0.8). We also tested alternative bandwidths in the interval
10

Figure 3 gives the graph corresponding to Figure 2, but using the survey mean instead of
PCE. The pattern is similar to Figure 2, although the least squares elasticity of the poverty line is
now even higher at 0.804 (t=15.97).
So the same pattern found by RDV using the older compilations of national poverty lines
is evident in Figure 2, with the poverty line rising with mean consumption, but with a low
elasticity initially. By interpretation, absolute poverty appears to be the dominant concern in poor
countries, with relative poverty emerging at higher consumption levels. However, it is notable
how high the overall elasticity is for developing countries.
The nonparametric regression in Figure 2 can be used to test for any regional effects by
seeing whether the observations for any region tend to lie systematically above or below the
expected value at given consumption, as given by the nonparametric regression line. The most
striking regional pattern is that the observations for Asia (both East Asia and South Asia) tended
to lie below the regression line; this was true of 11 out of the 12 observations for Asia (all but
one of the seven observations for East Asia and all of the five for South Asia had low poverty
lines conditional on mean consumption. No other regional patterns emerged so strongly.
The economic gradient in the poverty lines comprises a component due to food needs and
one for non-food needs, although we can only quantify this difference for a sub-set of the
national poverty lines. For a sub-sample of 28 countries we have complete data for also
separating the food from the non-food components of the national poverty lines. The mean food
share at the poverty line is 0.564 (with a range from 0.260 to 0.794). We find that the elasticity
of the food component of the poverty line to mean consumption is 0.471 (t=9.55), while it is
almost twice as high for the non-food component, for which the elasticity is 0.910 (t=8.97). (The
overall elasticity for this sub-sample is 0.679, t=11.02, as compared to 0.655 for the full sample.)
So the economic gradient in national poverty lines evident in Figure 2 is driven more by
the gradient in the non-food component of the poverty lines (which accounts for about 60% of
the overall elasticity), although it is notable that there is still an appreciable share attributable to
the economic gradient in food poverty lines. By interpretation, the social effect on national
poverty lines is determined more by the allowances made for non-food needs than food needs.
(0.2, 0.9). The mean of the predicted values in the poorest 15 countries ranged from $37.52 to $38.11 (although the regression line was clearly under-smoothed at bandwidths below about 0.5).
11

4. Setting an international poverty line
Using our new compilation of national poverty lines we can now return to the basic idea
behind the “$1 a day” poverty line, which was chosen to be representative of the poverty lines
found amongst poor countries. We explore a number of ways one might set a new international
poverty line consistent with this idea.
The median poverty line across the full sample (n=75) of $60.81 per month is equivalent
to almost exactly $2.00 per day; the mean is higher at about $2.90 per day. However, the
presence of the marked economic gradient in Figure 2 implies that the mean will be well above
the poverty lines found amongst the poorest countries.
The poverty line for Malawi—the lowest PCE per capita in the sample—is $26.11 per
month. However, like all specific data points in a sample, this is susceptibly to measurement
error and the country-specific error term could be large. It is notable that, although the
relationship in Figure 2 is quite flat at low PCE, there is still a sizable variance. No doubt,
idiosyncratic differences in the data and methods used for setting national poverty lines are
playing a role; there are measurement errors and methodological differences between countries
in how poverty lines are constructed, which can be interpreted as noise in the mapping from the
underlying welfare space into the income space. Some averaging is clearly called for, as is
normal in economic measurement. A better method is to use the expected value of the poverty
line in the poorest country, based on how the poverty lines vary with mean consumption. Table
1 gives a number of parametric specifications (including the forms used by RDV and Chen and
Ravallion, 2001), and the implied estimates of the poverty line for the poorest country.
Three concerns can be raised about the estimates in Table 1. First, the results may be
driven by the specific parametric form, and there are signs of this in Table 1, notably in the fact
that the semi-log model ( regressed on a quadratic function of ) gives a much higher
predicted Z for the poorest country that. But this is deceptive, since the turning point of the
quadratic function is above the lowest consumption; this is clearly an artifact of the parametric
form, since there is no sign of a negatively sloped segment at low PCE in Figure 2. Ignoring this
specification, the results in Table 1 suggest that a poverty line of around $1 a day is defensible if
one measures poverty in the world by the standards of the poorest country in the world.
iZ iCln
Second, a parametric model need not estimate well at all levels of consumption. For
example, the linear regression of on has a very good overall fit, with a correlation of iZ iC
12

0.995 with the fitted values in Figure 2 and a correlation of 0.836 with the data. However, the
linear projection based on this regression under-predicts Z amongst the poorest dozen or so
countries.24 The nonparametric regression in Figure 2 provides a more flexible method of
averaging, given that the regression is assured to have reasonably good fit over the full range of
the data, including amongst the poorest countries. The predicted value at Malawi’s PCE per
person is $37.16 per month ($1.22 a day).
The third concern is that it is unclear why one would want to focus exclusively on the
poorest single country in our sample; the result may well be vulnerable to measurement error in
consumption. Arguably, it would be better to focus on a reference group of poor countries; let
that reference group be defined as those countries with PCE per capita less than . *C
In the light of these observations, we can suggest an empirical model of the national
poverty lines in Figure 2 that is consistent with our theoretical model in section 2. Allowing for
measurement errors and idiosyncratic differences in the data and methods used in setting
national poverty lines, we let )(][ ii CfCCZE == denote the expected value of the national line
at PCE per capita ; as in section 2, is the lower bound absolute poverty line
though now it is an average value for countries with . The empirical model is then:
iC )( ** CfZ =
*CCi ≤
(3) iiiii ICfICfZ ε+−+= )1)(()( *
where is a dummy variable taking the value unity if i is a member of the reference group and
zero otherwise, and
iI
0][ == ii CCE ε . (The coefficient on is the conditional mean poverty
line for the reference group.) For continuity, the reference group should comprise those
countries for which . When this holds we say that we have a consistent reference group.
We check this after the estimation.
iI
*CCi ≤
25
Our reference group is the sampled countries with PCE per capita less than $60 per
month, namely: Malawi, Mali, Ethiopia, Sierra Leone, Niger, Uganda, Gambia, Rwanda,
Guinea-Bissau, Tanzania, Tajikistan, Mozambique, Chad, Nepal and Ghana. PCE for this group
24 Based on the linear projection, the mean predicted Z for the poorest 15 countries (ranked by C) is $34.61; by contrast the mean poverty line for the poorest 15 countries is $37.98, while the mean of the predicted values from the nonparametric regression is $37.98. 25 One can iterate the estimation if the consistency check fails, until it passes. This was not required in this case, so we treat as data (rather than as a function of ) in calculating the standard errors. iI *C
13

ranges from $31.34 to $56.90 per month with a mean of $42.46 (or about $1.40 per day) and
median of $41.33. The mean poverty line is $37.98 or $1.25 a day. (The median is $38.51.)
On trying various parametric forms, the linear specification was as good as, or better
than, others in terms of fit.26 The estimated regression corresponding to equation (3) is then
(with t-ratios in parentheses based on robust standard errors):
iiiii ICIZ ε)1)(326.0388.19(983.37)15.11()99.2()55.12(
+−++= R2=0.890, n=74 (4)
The robust standard error of the $37.98 per month ($1.25 per day) estimate is $3.03 ($0.10 per
day). The rising segment has a slope of about 1/3.27 (The aforementioned under-prediction at low
consumption by the linear regression is corrected for by using the $1.25 line as the lower bound.)
To check whether our reference group is consistent, we back out the estimated value of such
that , which gives (t=3.26). So our choice of the reference group as all
countries with is internally consistent with our estimate of (4).
*C
)ˆ(ˆˆ ** CfZ =
iC
50.59ˆ * =C
60$<
The $1.25 line is fairly robust to changes in the reference group. The mean poverty line
is $37.27 ($1.22 a day) if one focuses instead on the poorest 10 countries and it is $38.33 ($1.26)
if one sues the poorest 20. However, these were not consistent reference groups. If instead we
focus on the subset of our 15 reference countries for which the poverty line is “current,” in that it
was derived from the same survey (rather than updated from a prior line allowing only for
inflation), then the mean rises slight to $38.89 (n=11). If one focus on the poorest 10 countries
for which the poverty line is current then the mean is $37.22.
With a little rounding off, we can also propose a parsimonious schedule of relative
poverty lines, with a lower bound of $1.25 a day, but rising above a critical consumption level
with a gradient of 1:3, which is in close accord with our regression model in (4).28 More
precisely, our schedule of relative poverty lines is (in $’s per day):
(5) ]
3/,65.0max[$60.0$]3/60.0$,25.1max[$ iiRi CCZ +=+≡
26 The coefficient on a squared term in PCE per capita was not significantly different from zero; t=0.71. Regressing Z on a quadratic function of log PCE performed as well as the linear model in terms of R2, and gave a very similar estimate of Z*; we opted for the parsimonious linear model. 27 The use of the same PPP for converting both the poverty line and PCE could create a spurious correlation (given that a common measurement error term appears in both variables). To check this, we used PCE at 1993 PPP as the instrumental variable for PCE at 2005 PPP (assuming the measurement errors are uncorrelated); this gave a slope of 0.347 (t=8.42) with a slightly smaller sample (n=70); the corresponding poverty line was $37.41 (t=11.73). 28 Statistically, the joint restriction on (4) performs extremely well (F(2.71)=0.014; prob=0.986).
14

The lower bound of $1.25 is binding for the same 15 poorest countries used in setting our
absolute line. The point at which the poverty line rises is at C=$1.95 per day.
This schedule of relative poverty lines has a high correlation with the fitted values in
Figure 2 (r=0.994) as well as with the data on national poverty lines (r=0.836). Indeed, the
precision in predicting the national poverty lines is actually slightly greater using equation (5)
than the nonparametric regression in Figure 2.29 Nor are either the fitted values from the latter
regression or a cubic polynomial in C significant when added to a regression of Z on .RZ 30
5. Comparisons with past poverty lines
The method of measuring global poverty used by Chen and Ravallion (2001, 2004, 2007)
does not assume comparability across ICP rounds. The salient features of their method are that
the international poverty line is converted to local currency units in the ICP base year (using the
same consumption PPP used for the national poverty lines) and is then converted to the prices
prevailing in the relevant survey year using the best available CPI for that country. The PPP
conversion is only done once, and all estimates are revised back in time. Thus, at no point will
the new PPP’s from the 2005 ICP round be compared with those from previous ICP rounds.
Nonetheless, it is of interest to compare our new poverty liens for 2005 with past lines, both
absolute and relative.
Absolute poverty lines: Comparisons with past international lines are complicated by
methodological changes in PPPs and changes in the data and methods used for setting an
international line. However, the practice of looking for an average line amongst the poorest
countries has been present throughout the various revisions. Based on the 1985 PPPs from Penn
World Tables, RDV had used two poverty lines, one of which was the predicted poverty line in
the poorest country which gave a line of $23 per month at 1985 PPP, while the higher line was
$31 per month, which was the line found in six countries (Indonesia, Bangladesh, Nepal, Kenya,
Tanzania and Morocco) and was considered more representative of the lines found in low
income countries. Using the 1993 PPPs, Chen and Ravallion (2001) used instead the median line 29 The standard deviation of the error is $36.13 for the relative poverty lines versus $36.55 for the fitted values from Figure 1. Note that a (sufficiently) less smoothed nonparametric regression would do better than our piece-wise linear model. 30 The joint F test of the null that the three parameters in the cubic function of C are all zero in the regression of Z on ZR gave F(3,69)=0.14 (prob.=0.93) while the t-test on the coefficient on the fitted values when added to the same regression was t=0.44.
15

for the lowest 10 lines in the RDV data set, giving the line of $32.74 per month or $1.08 per day,
though using they showed that using the predicted line in the poorest country gave virtually the
same value ($1.05 per day).
From our study, the most comparable estimate to these is the predicted line for the
poorest country. In Table 1, the regression of log poverty line on a quadratic function of
consumption per capita is the same specification used by Chen and Ravallion (2001) and this
gives $33.76 per month ($1.11 per day) in 2005 prices on our new data set. However, as also
noted above, a more robust estimate is that based on the non-parametric regression, which gives
$37.16 per month or $1.22 per day. As also argued above, a good case can be made for using
instead the average of the poorest 15 countries, giving $1.25 per day.
It is clear that our proposed new international poverty line of $1.25 has a lower value in
the US than our old lines. The $US value in 1993 of our new international poverty line of $1.25 a
day is $0.92 a day—15% lower than the Chen and Ravallion (2001, 2004) poverty line of $1.08 a
day at 1993 PPP. The $1.25 line in 2005 is equivalent to exactly $1.00 a day in the US in 1996.
To put the point another way, if we simply updated the old 1993 line for inflation in the US then
we would get a line of $1.45 a day in 2005; the 2005 value of the predicted poverty line in the
poorest country—estimated as $1.05 per day by Chen and Ravallion (2001)—is $1.42 per day.31
These lines are significantly higher than our $1.25 line (t=2.08; prob.=4%).
However, these calculations are deceptive, given that the PPP’s from different ICP
rounds are not strictly comparable. There were substantial revisions to the PPP’s in the 2005 ICP
round relative to 1993. Probably the most important difference for the present purposes is that it
is believed that the 1993 ICP for developing countries used less rigorous standards of specifying
the quality of commodities than the 2005 ICP, such that a lower quality of goods were priced
than would have been found in the US market.32 The goods priced by the 1993 ICP tended to be
more typical of the items available in local markets.
Some large changes in the PPPs are evident if we convert a given national poverty line
into $’s at both 1993 and 2005, and then compare the results, as given in Figure 4 for the 72
31 The ratio of the 2005 CPI for the US to the 1993 CPI is 1.352. 32 Heston and Summers (2008) describe the ways in which the 2005 ICP was an improvement over past ICP rounds, and point specifically to the “…quantum improvement in the way regional comparisons were linked together from the standpoint of reviewing price collection” (p.3). Also see World Bank (2008b).
16

countries with both PPPs available. The mean poverty line using the 1993 PPPs is $91.25 (as
compared to $87.59 using the 2005 PPPs), and the median is $66.70 (as compared to $60.81). It
is notable from Figure 4 that the 2005 ICP has tended to entail an even larger downward revision
(in proportionate terms) in the $ value of the lowest stratum of poverty lines. This is clear from
the density functions of the national poverty lines evaluated at the alternative PPPs given in
Figure 5. (The Figure gives the national lines at 1993 PPP in both 1993 prices and 2005 prices,
adjusting for US inflation.) The mean poverty line of the poorest 15 countries ranked by
consumption per capita at 1993 PPP is $44.19, as compared to $37.98 using the 2005 PPPs. This
is to be expected given that the revisions introduced by the 2005 ICP have tended to increase the
PPP’s of developing countries, thus lowering the $ values of their poverty lines.
Based on Figure 4, what is the mean poverty line in 2005 PPP amongst countries with
poverty lines around the $1.08 figure at 1993 PPP? In other words, what is the estimated value
of ]74.32$[ 9305 =ii ZZE where denotes the poverty line in PPP $’s in country i using ICP
round t? A simple way this can be answered is by estimating the parameter a in the following
linear regression based on the data in Figure 4:
tiZ
(6) iii ZbaZ ε+−+= )74.32( 9305
where it is assumed that 0][ 93 =ii ZE ε . We find that 06.36ˆ =ia
93Z
(t=8.85) and
(t=10.69). This implies a poverty line of $1.19 a day at 2005 PPP. The estimate of a is not
significantly different from our new $1.25 line (t=0.48).
857.0ˆ =ib
33 But nor is it significantly different
from the old line; we cannot reject the null that a=32.74 (t=0.81). However, it is significantly
lower than $1.45 a day, as obtained by updating the $1.08 line for inflation in the US; the t-ratio
on the null that a=$44.26 is 2.01, which is significant at the 5% level. A possible concern with
this calculation is sensitivity of the linear regression to the outliers evident in Figure 4. Instead,
we tried a nonparametric regression of on , and linearly interpolated between the
predicted values for the two closest observations for , either side of $32.74; this method gave
05iZ 93
iZ
50.34$]74.32$[ˆ 9305 ==ii ZZE or $1.13 a day—similar to (6). Of course, this would not be a
defensible poverty line for 2005 since it assumes that the data that gave the old 1993 line were
33 In calculating the standard error we ignore the statistical imprecision of the $1.25 line, but that is unlikely to change the conclusion.
17

right. However, the calculation does serve to confirm that the $US values of low national poverty
lines have fallen with the 2005 ICP.
There are a number of possible explanations for why the mean 2005 line corresponding to
the 1993 line is so much lower than that implied by simply updating for inflation in the US. We
cannot rule out the possibility that the inflation rates are substantially miss-measured, but it
seems more likely that the problem lies with the 1993 PPPs. Weaker standards used in defining
comparable goods in the 1993 ICP price surveys (relative to 2005 ICP) could easily produce the
kind of upward revisions to the 1993 PPPs implied by the above findings.
The implied revisions are substantial for poor countries. To see this, let denote the
true PPP exchange rate derived from the ICP round for date t. Under the purchasing power
parity principle, the PPP rate for a given country changes over time according to differences in
that country’s rate of inflation and that for the numeraire country, the US, i.e.,
*tiPPP
*93*05
*93*05
*93
*05
//
USUS
ii
i
i
DDDD
PPPPPP
= (7)
where is the true deflator to convert that country-specific poverty line to the PPP reference
date, t. While equation (7) holds for the true values of all variables, our measurements are based
instead on the observed values, and . To focus on the implications for the errors in the
historical PPP data for developing countries we assume that the 2005 PPP and the deflators are
accurate. Under these assumptions, the revision to the PPP for 1993 that is implied by the
observed data can be readily derived as follows:
*tiD
tiPPP t
iD
93
05
9305
9305
93
*93
//
i
i
ii
USUS
i
i
PPPPPP
DDDD
PPPPPP
⎟⎟⎠
⎞⎜⎜⎝
⎛= (8)
The sample mean of this variable is 1.568 (with a standard error of 0.068; n=72). Thus a sizable
underestimation of the 1993 PPP is implied by the new PPP data and the data on rates of
inflation. Furthermore, the extent of this underestimation tends to be greater for poorer
countries. Figure 6 plots the implied values of against log PCE per person at
2005 PPP. We see a marked negative gradient; the correlation coefficient is -0.472, which is
significant at the 1% level (t=-4.70). Amongst the poorest countries in terms of PCE the data
suggest a marked upward revision is required to the 1993 PPP. In other words, the 1993 ICP
round underestimated the price level in these countries, relative to the US. This is consistent with
93*93 / ii PPPPPP
18

expectations based on the view that the weaker standards of specifying the quality of goods and
supervision in poor countries had entailed that, particularly for the poorest countries, the 1993
ICP was using a lower quality of goods than would have been found in the US market.
These observations are at best suggestive. The data problems are unlikely to be confined
to the 1993 PPPs; errors in the 2005 PPPs and the inflation rates are no doubt also present. But
these results are at least consistent with the interpretation that less rigorous specification and
monitoring of quality standards in the 1993 ICP entailed that lower quality goods had been
priced in poor countries, leading to an underestimation of the PPP for many of the poorest
countries, or (equivalently) that the true cost-of-living had been underestimated.
Note that these findings do not do not cast doubt on the so-called “Penn effect;”34 the
ratio of the PPP to the market exchange rate tends to be lower in poorer countries (see World
Bank, 2008a, Figure 5). What they suggest, however, is that the extent of this effect has been
somewhat overstated, such that the PPPs of poor countries are higher than has been thought.
Relative poverty lines: It is also of interest to compare our new set of relative poverty
lines with those of Chen and Ravallion (2001, 2004), who used a line of the form
where . Following Atkinson and Bourguignon (2001), this can be
rationalized by arguing that a non-poor person must have
),max( *ikCZZ = 10 ≤< k
both an absolute minimum income and
not be relatively deprived, which is assumed to require an income above some proportion k of
the mean. Chen and Ravallion chose a day and k=1/3, which gave a good fit with the
RDV poverty lines at 1993 PPP.
08.1$* =Z
The constant of proportionality is the same, but our new poverty lines require that a fixed
increment of $0.60 a day is required above one third of mean consumption (equation 3) to not be
relatively deprived. Two points are notable about this property. First, the elasticity of our relative
poverty line to mean consumption never reaches unity (the elasticity is zero below $1.95 a day
and above that value, and only reaches unity in the limit, as C goes to infinity).
Thus our relative poverty lines avoid the anomalous feature of poverty lines that are set at a
constant proportion of the mean (including those described above, when consumption is above
)/80.11/(1 iC+
34 This is the empirical observations that the PPP exchange rate is less than the market exchange rate in developing countries. This is usually attributed to the Balassa-Samuelson effect, namely that the market rate only brings the prices of internationally traded goods into parity, while non-traded goods are an important component of consumption in developing countries and these tend to be cheaper than in developed countries.
19

*Z ), namely that an equal proportionate increase in all consumptions leaves measured poverty
unchanged.
Second, the consumption level at which the kink occurs in the Chen-Ravallion schedule
of relative poverty lines is appreciably higher than for our proposed new schedule. For the
Chen-Ravallion relative poverty lines the kink was at a consumption level of $3.24 per day at
1993 PPP, while the new schedule of relative poverty lines proposed in the last section has a kink
at $1.95 a day at 2005 PPP. If we had instead chosen as the relative poverty
line at 2005 PPP, the kink would be at a consumption level of $3.75 a day instead of $1.95.
There are 18 countries with PCE in the interval ($1.95, $3.75), i.e., there are an extra 18
countries in the segment where the absolute line is no longer binding. Alternatively, if we use
as the relative poverty line (given that $1.20 is our estimate of the mean
poverty line at 2005 PPP corresponding to $1.08 at 1993 PPP) then we find that there is an extra
16 countries for which the absolute line is no longer binding.
)3/,25.1max($ iC
)3/,20.1 iCmax($
So our new data on national poverty lines suggest that relative poverty is a more
prominent concern amongst a number of developing countries than found by RDV. This echoes
our earlier finding that the overall elasticity of the poverty line to the mean in our sample is quite
high—less than unity but similar to some past estimates for developed countries.
6. PPP’s for the poor
The above calculations have used PPP’s constructed for international comparisons of
mean consumption, not for comparing poverty lines. In principle, it would be better to have PPPs
weighted to the average consumption bundle of people near the poverty line (as was argued by
RDV). It is unclear how much this matters for measuring poverty lines in the poorest countries,
since national poverty lines tend to be approximately equal to mean consumption in those
countries. In the context of our new data set on national poverty lines, it should first be recalled
that we also find that the national poverty lines tend to be roughly equal to mean consumption
for our reference group of the poorest countries. However, that does not mean that the PPP for
aggregate consumption is appropriate for those countries, since the underlying prices are
expenditure weighted, not population weighted. Even so, it remains likely that it will be at
higher income levels that the divergence between aggregate consumption PPP and a “PPP for the
20

poor” (PPPP) is a greater concern. That raises the issue of how the use of a PPP that is more
appropriate for comparing poverty lines would affect the economic gradient in Figure 2.
Intuitively, the impact on the gradient depends on the correlation between mean
consumption and the error made in using the aggregate PPP for the poverty lines rather than the
PPP for the poor.35 It is unclear what one would expect on a priori grounds; possibly we might
even find that the economic gradient in poverty lines largely vanishes if we use a PPPP. In this
section we try to test to see how the use of various PPPP’s might affect our results.
One candidate for a PPPP is the food component of the aggregate consumption PPP’s for
2005, as available in World Bank (2008a). It has been argued by Reddy and Pogge (2008) that it
would be better to use the PPP for food consumption alone. This is not obvious; as we have
noted, the mean food share for the national poverty lines (mean ratio of food component to total
poverty line) is 0.564 (n=28), while the mean for the poorest 20 countries (ranked by PCE) is
0.653 (n=7). So the food PPP leaves out a sizable share of consumption by people living near
the national poverty lines, even in the poorest countries. Nonetheless, it is of interest to see how
this alternative PPP affects our results.
Figure 7 gives the corresponding graph to Figure 2 using the food PPP’s. We use the
same PPP for measuring PCE in international $’s; the claim that this PPP is appropriate for mean
consumption from the NAS is not at issue—rather the issue is what PPP is most appropriate for
measuring poverty. The pattern in Figure 7 is similar to Figure 2, with a marked economic
gradient in the poverty lines above a critical level of consumption, although the poverty lines are
generally lower. On re-estimating equation (3) for f linear, we found that the consistent
reference group using this PPP needed to be slightly larger (n=17) (the estimated cut-off point is
$64.26; t=4.07), the slope is slightly lower (0.292, t=11.23) and the estimated value of Z* is
appreciably lower at $22.74 (t=13.62). The least squares elasticity of the poverty line to mean
consumption rises slightly; the regression coefficient of log poverty line at the food PPP to log
PCE per capita is 0.78 (t=15.63), as compared to 0.65 using the mean consumption PPP.
35 Consider (for example) the least squares elasticity of the national poverty line to mean consumption. It is readily verified that if the log of the ratio of the PPP for the poor to the PPP for mean consumption is positively (negatively) correlated with log PCE per capita (at PPP) then the elasticity of the poverty line to mean consumption will be over (under) estimated by our analysis. Essentially the log ratio of the two PPP’s is an omitted variable in the regression of log poverty line on log PCE.
21

Rather than setting the weight on nonfood goods to zero, it is better to set a weight more
appropriate to spending by poor people. Deaton and Dupriez (DD) (2008) are attempting to do
this in a consistent way by re-weighting the consumption bundle to accord with consumption
patterns in a neighborhood of an implicit international poverty line that is essentially a weighted
average of the national poverty lines (as used in the present paper) when converted to a common
currency using their PPP. In forming the common poverty line, DD used all developing
countries in our data set of national poverty lines for which they had access to suitable household
surveys. This means that the DD PPP’s are only available for 46 of our 75 countries. In forming
an average line, DD use the national poverty lines of all of these countries, rather than focusing
on the poorest as we have done. DD chose to weight by the size of the poverty population in
forming their average line, although the poorest countries are not, as a rule, the largest, so there
can be no a priori presumption that the DD PPP’s embody consumption weights that are
appropriate for the poorest countries.36 However, it remains of interest to see whether the pattern
in Figure 2 is robust to switching to their PPP’s. DD give estimates for the Fisher, Tornqvist and
Country-Product Dummy (CPD) methods of forming the price index.37
Figure 8 gives the results using their Fisher method. Again the pattern is similar to
Figure 2. This was also true for the Tornqvist and CPD methods. The DD PPP’s call for a
slightly smaller reference group (n=13). The estimated poverty lines for this smaller reference
group are $31.72 (t=8.80), $33.37 (t=9.59) and $41.56 (t=9.70) for Fisher, Tornqvist and CPD
respectively. For the Fisher and Tornqvist methods, the slope coefficients (above these lower
bounds) are slightly lower than for the aggregate PPP; the regression coefficients are 0.276
(t=8.13), 0.300 (t=7.72) respectively. However, for the CPD method the slope is higher at 0.374
(t=8.83). There is little affect on the estimated elasticities.38
So the pattern in Figure 2 is robust. For measuring global poverty by the standards of the
poorest countries, the PPPP’s using either the Fisher or Tornqvist indices suggest a lower
international line—close to $1 a day—while the CPD method suggests a line of $1.37 a day.
36 Using the poverty rates corresponding to the national poverty lines, we find is no significant difference between the mean number of poor for countries in our reference group and the rest (t=0.50); nor is there any significant correlation between population size and PCE per capita (r=-0.10;t=-0.88). 37 For further discussion of these methods see Deaton (2006). 38 The estimated slopes are 0.272 (t=8.73), 0.297 (8.37) and 0.368 (t=9.37) while the least squares elasticities are 0.613 (t=8.00), 0.624 (t=8.27) and 0.623 (t=8.17) for the Fisher, Tornqvist and CPD methods respectively.
22

7. Conclusion
The original “$1 a day” poverty line aimed to assess poverty in the world as a whole by
the standards of what poverty means in the poorest countries. We have revisited this idea armed
with a new set of national poverty lines for low- and middle-income countries, drawing on the
World Bank’s country-specific Poverty Assessments and the Poverty Reduction Strategy Papers
done by the governments of the countries concerned. We have converted these national poverty
lines to a common currency using the new set of consumption PPP’s estimated from the 2005
round of price surveys done by the International Comparison Program.
We find that, across countries, national poverty lines tend to rise with mean consumption
above a critical level, but that the relationship is quite flat below that level. This pattern in the
data is consistent with our interpretation of a national poverty line as a “social subjective poverty
line,” defined as the level of consumption below which people in that country tend to think they
are poor, and above which they do not.
We find that marked upward revisions to the PPPs of the poorest countries are implied by
the results of the 2005 round of the ICP of price surveys. As a consequence, simply updating the
old international poverty line for inflation in the US gives a poverty line that is well above the
lines found amongst the poorest countries at 2005 PPP. To be consistent with the poverty lines
found in poor countries the international poverty line in real $’s has to be revised downwards
given the upward revisions to the purchasing power parities of poor countries. We propose
instead a new international poverty line of $1.25 a day for 2005 (equivalent to $1.00 a day in
1996 US prices), which is the mean of the lines found in the poorest 15 countries in terms of
consumption per capita. The fact that this has a lower real value in the US than our old “$1 a
day” line does not mean that global poverty measures will also be revised downwards, given that
the purchasing power of household incomes in poor countries is also lower with the new PPPs.
On balance the global poverty count will tend to rise, given that larger proportionate revisions to
the PPPs are implied for poorer countries.
Our results suggest that relative poverty is a more important concern than was the case 20
years ago. More countries are found in the region where the poverty line rises with mean
consumption. Across our sample of developing countries, the overall elasticity of the poverty
line to mean consumption is around 0.7—close to the values found for developed countries. We
have also proposed a parsimonious schedule of relative poverty lines, consistent with our data on
23

national poverty lines. The proposed relative poverty lines have a lower bound of $1.25, which
applies to the aforementioned reference group, but then rise according to mean consumption with
a gradient of one-in-three. This offers a very good fit with our data on national poverty lines.
In Chen and Ravallion (2008b), new global poverty measures for the period 1981-2005
are estimated from 675 surveys spanning 116 countries using the new international line of $1.25
per day in 2005 prices proposed in this paper, but otherwise using similar estimation methods to
those outlined in Chen and Ravallion (2001, 2004). Chen and Ravallion also test robustness of
the main qualitative results to the choice of poverty line, and provide estimates over the range
$1.00-$2.50 per day.
24

Table 1: Estimated poverty line for the poorest country for various parametric models
Specification Predicted poverty line for the poorest country in 2005 PPP $’s per month ( =$31.34 for Malawi) iC
iii CZ εβα ++= $31.04 (8.53)
iiii CCZ εββα +++= 211 $29.32 (6.59)
iiii CCZ εββα +++= 211 lnln $44.22 (6.89)*
iiii CCZ εββα +++= 211 lnlnln $33.76; Zln =3.52 (33.51)
iiii CCZ εββα +++= 211ln $32.63; Zln =3.49 (47.16)
Note: t-ratios in parentheses based on robust standard errors; *: the turning point —above the lowest consumption. 04.4ln =CThe predicted value of at the turning point is $36.05 (t=13.61). iZ
Figure 1: Density of national poverty lines for 74 developing countries
.000
.002
.004
.006
.008
.010
-100 0 100 200 300 400 500 600 700 800
National poverty line ($ per person per month at 2005 PPP)Private consumption per person ($ per month at 2005 PPP)
Den
sity
25
Figure 2: National poverty lines plotted against mean consumption
Note: Fitted values use a lowess smoother with bandwidth=0.8
7 4 Log consumption per person at 2005 PPP
653
Nat
iona
l pov
erty
line
($/m
onth
at 2
005
PP
P)
300
200
100
0
Figure 3: Poverty lines plotted against survey mean
Note: See Figure 1 6 4 5
Log survey mean at 2005 PPP3
Nat
iona
l pov
erty
line
($/m
onth
at 2
005
PP
P)
300
200
100
0
26

Figure 4: Revisions to the PPP $ value of national poverty lines
0
40
80
120
160
200
240
280
320
360
0 40 80 120 160 200 240 280 320 360
Pove
rty li
ne a
t 200
5 PP
P ($
/mon
th)
Poverty line at 1993 PPP ($/month)
Figure 5: Densities of national poverty lines at 1993 and 2005 PPP
.000
.002
.004
.006
.008
.010
.012
0 100 200 300 400 500
2005 PPP1993 PPP1993 PPP in 2005 US prices
Den
sity
27

Figure 6: Implied revisions to the 1993 PPP
0.0
0.5
1.0
1.5
2.0
2.5
3.0
3.5
3.0 3.5 4.0 4.5 5.0 5.5 6.0 6.5 7.0
Log consumption per person at 2005 PPP
Impl
ied
adju
stm
ent t
o 19
93 P
PP
(PP
P93
*/P
PP
93)
Figure 7: National poverty lines using food consumption PPP
Note: See Figure 1 4 5 6 7
Log consumption per person at 2005 PPP 3
Nat
iona
l pov
erty
line
($/m
onth
at 2
005
food
PP
P)
250
200
150
100
50
0
28

Figure 8: National poverty lines using the Deaton-Dupriez PPPP (Fisher method)
Note: See Figure 1 Log consumption per person at 2005 PPP
7 654 3
Nat
iona
l pov
erty
line
($/m
onth
at 2
005
PP
P) 200
150
100
50
0
29

References
Ackland, Robert, Steve Dowrick and Benoit Freyens, 2006, “Measuring Global Poverty:
Why PPP Methods Matter,” mimeo, Australian National University.
Ahmad, Sultan. 2003. “Purchasing Power Parity for International Comparison of Poverty:
Sources and Methods,” World Bank, www.worldbank.org/data/ICP.
Ahluwalia, Montek, 1974, “Income Inequality: Some Dimensions of the Problem,” in Hollis
Chenery, Montek Ahluwalia, Clive Bell, John Duloy and Richard Jolly, Redistribution
with Growth, Oxford University Press.
Atkinson, Anthony B., 1998, Poverty in Europe, Oxford: Blackwell Press.
Atkinson, Anthony B. and Francois Bourguignon, 2001, “Poverty and Inclusion from a
World Perspective.” In Joseph Stiglitz and Pierre-Alain Muet (eds) Governance,
Equity and Global Markets, Oxford: Oxford University Press.
Chen, Shaohua and Martin Ravallion, 2001, “How Did the World’s Poor Fare in the 1990s?”,
Review of Income and Wealth, 47(3):.283-300.
____________ and _____________, 2004, “How Have the World’s Poorest Fared Since the
Early 1980s?” World Bank Research Observer, 19/2: 141-70.
____________ and ______________, 2007, “Absolute Poverty Measures for the Developing
World, 1981-2004.” Proceedings of the National Academy of Sciences of the United
States of America, 104/43: 16757-62.
____________ and ______________, 2008a, “China is Poorer than we Thought, but no Less
Successful in the Fight Against Poverty,” in Sudhir Anand, Paul Segal, and Joseph
Stiglitz (ed), Debates on the Measurement of Poverty, Oxford University Press.
____________ and ______________, 2008b, “The Developing World is Poorer than we
Thought, but no Less Successful in the Fight Against Poverty”, Policy Research Working
Paper 4703, World Bank, Washington DC (http://econ.worldbank.org/docsearch).
Chen, Shaohua, Gaurav Datt and Martin Ravallion, 1994, “Is Poverty Increasing in the
Developing World?” Review of Income and Wealth 40(4): 359-376.
Deaton, Angus, 2006, “Purchasing Power Parity Exchange Rates for the Poor: Using Household
Surveys to Construct PPPs,” mimeo, Development Data Group, World Bank.
Deaton, Angus and Olivier Dupriez, 2008, “Poverty PPPs Around the World: An Update and
Progress Report,” Development Data Group, World Bank.
30

Easterlin, Richard A. 1995. “Will Raising the Incomes of all Increase the Happiness of all?”
Journal of Economic Behavior and Organization 27: 35-47.
Groedhart, T., Halberstadt, V., Kapteyn, A. and van Praag, B., 1977, “The Poverty Line: Concept
and Measurement.” Journal of Human Resources 12: 503–20.
Hagenaars, Aldi, and Bernard van Praag, 1985, “A Synthesis of Poverty Line Definitions.”
Review of Income and Wealth, 31(2): 139-54.
Heston, Alan and Robert Summers, 2008, “Interview with Alan Heston and Robert Summers,”
ICP Bulletin 5(1): 3-6.
Kapteyn, A., Kooreman, P. and Willemse, R., 1988, “Some Methodological Issues in the
Implementation of Subjective Poverty Definitions.” Journal of Human Resources 23:
222–42.
Kilpatrick, R., 1973, “The Income Elasticity of the Poverty Line.” Review of Economics and
Statistics, 55(3): 327-32.
Oswald, Andrew, 1997, “Happiness and Economic Performance,” Economic Journal 107:
1815-1831.
Pradhan, Menno and Martin Ravallion, 2000, “Measuring Poverty using Qualitative Perceptions
of Consumption Adequacy.” Review of Economics and Statistics 82: 462–71.
Pritchett, Lant, 2006, “Who is Not Poor? Dreaming of a World Truly Free of Poverty,” World
Bank Research Observer 21(1):1-23.
Ravallion, Martin, 1994, Poverty Comparisons. Harwood Academic Press, Chur: Switzerland.
______________, 1996, “Issues in Measuring and Modeling Poverty,” Economic Journal, 106:
1328-44.
______________, 1998, Poverty Lines in Theory and Practice. Living Standards Measurement
Study Paper 133. Washington DC: World Bank.
______________, 2003, “Measuring Aggregate Economic Welfare in Developing Countries:
How Well do National Accounts and Surveys Agree?,” Review of Economics and
Statistics, 85: 645–652.
______________, 2008a, “On the Welfarist Rationale for Relative Poverty Lines,” in Kaushik
Basu and Ravi Kanbur (eds) The Oxford Handbook of Arguments for a Better World:
Essays in Honor of Amartya Sen. Volume I: Ethics, Welfare and Measurement, Oxford:
Oxford University Press, 2008., Oxford: Oxford University Press.
31

32
______________, 2008b, “Poverty Lines,” in The New Palgrave Dictionary of Economics, 2nd
edition, Larry Blume and Steven Durlauf (eds) London: Palgrave Macmillan.
Ravallion, Martin and Shaohua Chen, 1997, “What Can New Survey Data Tell Us about Recent
Changes in Distribution and Poverty?” World Bank Economic Review 11(2): 357-82.
Ravallion, Martin, Shaohua Chen and Prem Sangraula, 2007, “New Evidence on the
Urbanization of Global Poverty,” Population and Development Review, 33(4): 667-702.
Ravallion, Martin, Gaurav Datt and Dominique van de Walle, 1991, “Quantifying
Absolute Poverty in the Developing World,” Review of Income and Wealth 37:
345-361.
Ravallion, Martin and Michael Lokshin, 2007. “Who Cares about Relative Deprivation?” Policy
Research Working Paper, World Bank, Washington, DC.
Reddy, Sanjay G., and Thomas W. Pogge, 2008, “How Not to Count the Poor,” in Sudhir Anand,
Paul Segal, and Joseph Stiglitz (ed), Debates on the Measurement of Poverty, Oxford:
Oxford University Press.
Runciman, W.G., 1966, Relative Deprivation and Social Justice. Routledge and Kegan Paul.
Scitovsky, Tibor, 1978, The Joyless Economy. Oxford: Oxford University Press.
Smeeding, Timothy M., Lee Rainwater, Martin Rein, Richard Hauser and Gaston Schaber, 1990,
“Income Poverty in Seven Countries: Initial Estimates from the LIS Database,” in T.M.
Smeeding, M. O’Higgins and L. Rainwater (eds) Poverty, Inequality and Income
Distribution in Comparative Perspective, Washington DC: Urban Institute Press.
Summers, Robert and Alan Heston, 1991, “The Penn World Table (Mark 5): An Extended Set of
International Comparisons, 1950-1988,” Quarterly Journal of Economics 106:327-368.
World Bank, 1990, World Development Report: Poverty, New York: Oxford University Press.
__________, 2008a, Global Purchasing Power Parities and Real Expenditures. 2005
International Comparison Program, Washington DC: World Bank.
__________, 2008b, Comparisons of New 2005 PPPs with Previous Estimates. (Revised
Appendix G to World Bank, 2008a). Washington DC: World Bank.
(www.worldbank.org/data/icp).

Data appendix
Table A1: National poverty lines Country Source documents Page for
poverty lines
Survey year
PCE per capita per month for survey year in 2005 PPP $’s
Poverty line per capita per month
2005PPP $’s
Notes on methods used to set national
poverty line in source document
Albania Albania: Poverty Assessment, June 28, 2003, per cap per month.
11 2002 280.71 85.18 1
Algeria Democratic and Popular Republic of Algeria: Growth, Employment and Poverty Reduction: Main Report, January 20, 1999.
3 1995 n.a. n.a. 1,4,5
Argentina* Crisis and Poverty 2003: A Poverty Assessment, vol. II, adult equivalent poverty line for metro Buenos Aires.
14 1999 641.90 183.07 1, 6
Armenia Armenia Poverty update December 9, 2002, Report #24339-AM.
13 1998/99 174.84 73.36 1, 5, 6
Azerbaijan Azerbaijan Republic: Poverty Assessment, Vol II, The main report, June 2003
3 2001 292.23 84.80 1
Bangladesh Poverty in Bangladesh: Building on progress, December 2002, Report # 24299-BD
Micro data file
2000 64.34 31.46 1, 4
Belarus Belarus: Poverty Assessment; Vol 1; Main report, January 2004
3 2002 362.04 187.73 1, 4, 5
Benin Benin Poverty Reduction Strategy Paper 2003-2005 12 1999/00 72.82 23.57 1
Bolivia* Poverty Assessment: Establishing the Basis for More Pro-Poor Growth, December 15, 2005, report #: 28068-BO
69 2001 216.66 142.39 1, 4, 5
Bosnia & Herzegovina
Bosnia & Herzegovina: Poverty Assessment Vol. I, Main Report , November 2003
5 2001 393.95 217.65 1
Brazil* Measuring Poverty using household consumption, September 2006 draft, January 2008 Final Report #: 36358-BR
21 2002/03 465.45 180.14 1, 4, 5

Bulgaria Bulgaria Poverty Assessment October 2002, Report #: 24516-BUL
2 2001 445.70 100.77
7 Burkina Faso Burkina Faso: Reducing Poverty with Sustained
Equitable Growth; Poverty Assessment, June 2005 14 2003 68.54 26.27 1, 5
Cambodia* Cambodia: Halving Poverty by 2015, poverty assessment 2006
21 2004 75.06 42.80 1, 4, 5
Cameroon Joint IDA-IMF Staff Assessment and PRSP, July 2003
10 2001 112.96 69.62 1, 4, 5, 6
Chad National Poverty Reduction Strategy Paper, June 2003
20 1995/96 47.04 26.60 1
Chile* Chile urban poverty line from the working file of Ezequiel Molina, a data coordinator of LAC region at the World Bank.
2000 487.08 119.00 7
China “Memo on poverty lines,” National Bureau of Statistics, China, 2002
1 2002 120.78 25.89 1,2
Colombia* Colombia: Poverty Report Vol. 1, November 2002, Table A1
102 1999 334.47 199.56 1, 5, 6
Congo, Rep Enquete Congolese après des menages (ECOM 2005), Centre National de la Statistique et des Etudes Economiques, April 2006
Viii 2005 72.13 67.99 1, 5, 6
Costa Rica Costa Rica: Identifying the social needs of the poor: An update, Annex 3, May 1997
40 1992 n.a. n.a. 1
Cote d'Ivoire Document de strategie pour la reduction de la pauvrete - interimaire, January 2002
26 1998 117.07 50.36 3
Djibouti Profil De La Pauvrete A Djibouti, December 2002 42 2002 111.70 95.61 1, 6
Dominican Rep
Dominican Rep: Poverty Assessment: Achieving more pro-poor growth, Oct 2006
6 2004 n.a. n.a. 1, 4
Ecuador Ecuador: Poverty Assessment, April 2004 26 2001 289.72 122.62 7
Egypt Arab Republic of Egypt poverty reduction in Egypt: diagnosis and strategy, June 2002
12 1999/00 225.68 53.43 1, 5
34

El Salvador El Salvador: Poverty Assessment: Strengthening Social Policy, Dec 2005
5 2001 n.a. n.a. 1
Estonia Estonia: Living Standards during the transition, June 1996, Page 10, poverty line is the minimum pension in July 1995
10 1995 431.16 102.78 7
Ethiopia Ethiopia PRSP, 2002 6 1999/00 35.22 41.04 1
Gambia Gambia: PRSP and Joint Assessment, June 2002 appendix 1
1998 40.88 44.92 1
Georgia Georgia Poverty and Income Distribution 1999 3 1997 182.79 111.24 1, 6
Ghana Ghana: Joint IDA-IMF Staff assessment of the PRSP, March 2003
13 1998/99 56.90 55.65 6
Guatemala Guatemala: Poverty in Guatemala February 2003, 8 2000 n.a. n.a. 1
Guinea Bissau
Republic of Guinea Bissau: Poverty Assessment and Social Sectors Strategy Review, June 1994
6 1991 45.12. 45.96 3
Haiti Haiti: The Challenges of Poverty Reduction, Volume II Technical Papers, March 1998
3 1996 n.a. n.a. 7
Honduras Honduras: Country Economic Memorandum/Poverty Assessment Nov 1994, Annex table: C:11
66 1993 n.a. n.a. 1, 5
Hungary Hungary Long Term Poverty, Social Protection and the Labor Market, vol. 1, April 2001, subsistence minimum for 1997
2 1997 668.31 247.87 6
India Official poverty lines for India from Planning Commission, Government of India
131 2004/05 84.24 26..82 2
Indonesia Poverty Reduction in Indonesia: Constructing a New Strategy, Oct 2001
2 1999 139.96 32.63 1, 4, 5
Jamaica Jamaica Survey of Living condition, 2002 25 2002 n.a. n.a. 1
Jordan Jordan Poverty Assessment, Vol.1, December 2004, report # 33802
8 2002/03 251.59 71.47 1,5
35

Kazakhstan Kazakhstan: Living Standards during Transition, March 1998, Report # 17520-KZ
12 1996 213.41 95.32 7
Kenya 2003 Country Economic Memorandum for Kenya 18 1997 112.80 84.71 1
Kyrgyz Kyrgyz Republic Poverty Updates, August 2005, Report # 36602 - KZ,
50 2003 109.85 60.81 1, 5
Lao Poverty in Lao PDR During the 1990s, May 2002, Annex 2, Table 2.7
47 1997/98 n.a. 32.10 1, 4, 5
Latvia Latvia: Poverty Assessment, Vol. 1, June 2000 3 1995 370.11 137.91 3
Lesotho PRSP and Joint Staff Advisory notes, July 2005 9 1994/95 135.84 49.37 7
Macedonia FYR Macedonia: Focusing on the Poor; Vol. II, June 1999, Report # 19411 - MK
11 1994 348.96 177.25 1
Malawi “Note on Construction of Expenditure Aggregate and Poverty Lines for IHS2,” October 2005
8-9 2004/05 31.34 26.11 7
Mali Assessment of Living Conditions, June 1993, Report # 11842 – MLI
8 1988/89 31.96 41.89 3
Mauritania Poverty Reduction Strategy Paper: Action Plan 2006-2010, October 2006
16 2000 99.63 68.16 7
Mauritius Mauritius: Country Economic Memorandum: Sharpening the Competitive Edge, April 1995, report # 13215 – MAS
70 1991/92 328.33 272.99 3
Mexico Poverty in Mexico, 2004, Report # 31115, table 1.1 8 2002 630.73 192.22 1
Moldova “Living Standards and Poverty in Moldova” by Kathleen Beegle, June 2004
2 (footnote)
2001 124.89 60.81 1
Mongolia Mongolia Poverty Assessment, April 2006, Report # 35660 – MN
18 2002/03 80.55 57.88 7
Morocco Kingdom of Morocco: Poverty Update, Annex; March 2001, Report # 21506 – MOR
3 1998/99 167.73 55.33 1, 4, 5
Mozambique Mozambique 2002/03 data file in STATA received from Louise Fox
Micro data file
2002/03 45.52 29.54 7
36

Nepal Nepal Resilience Amidst Conflict, June 2006, Report # 34834 - NP, table 4a
125 2003/04 54.55 26.43 1, 4, 5
Nicaragua Nicaragua: Poverty Assessment; Raising Welfare and Reducing Vulnerability, Dec 2003, Box 1.1, Report # 26128 – NI
2 2001 n.a. n.a. 1, 4
Niger Niger: Poverty Assessment, June 1996 35 1993 39.34 33.35 3
Nigeria The Evolution of Poverty and Welfare in Nigeria, 1985-92, Table A1.1, January 1997
13 1985 61.49 31.38 3
Pakistan* Pakistan Poverty Assessment, Oct 2002, table A-2-2, per adult equiv, Report # 24296 – PAK
132 1998/99 98.31 50.67 1, 5, 6
Panama Panama Poverty Assessment, June 1999; Vol 2, Annex 2.
6 1997 n.a. n.a. 1, 4
Paraguay Paraguay Capital city poverty line from the working file of Ezequiel Molina, LAC region, World Bank. (Poverty line from capital city.)
Work file 2002 222.27 192.14 1
Peru* Peru: Opportunities for All -- Poverty Assessment, Dec 2005, Report # 29895 – PE
161 2000 326.61 76.10 1, 5
Philippines Philippines: An Opening for Sustained Growth, Vol. II, April 1993, Report # 11061 - PH
331 1988 134.17 46.02 7
Poland Poverty in Poland, Vol 1, Sept 1994, Report # 13051 – POL
14 1993 465.05 203.23 5
Romania Romania Poverty Assessment, Vol. II, Background Paper, September 2003, Report # 26169 – RO
6 1994/01 397.77 125.57 1, 6
Russia Russian Federation Reducing Poverty Through Growth and Social Policy Reform, Feb 2005, Report # 28923 – RU
12 2002 455.72 132.67 7
Rwanda A Profile of Poverty in Rwanda, Feb 2002, Ministry of Finance & Economic Planning, National Poverty Reduction Program & Stat Dept.
5 1999/01 41.33 30.17 5, 6
37
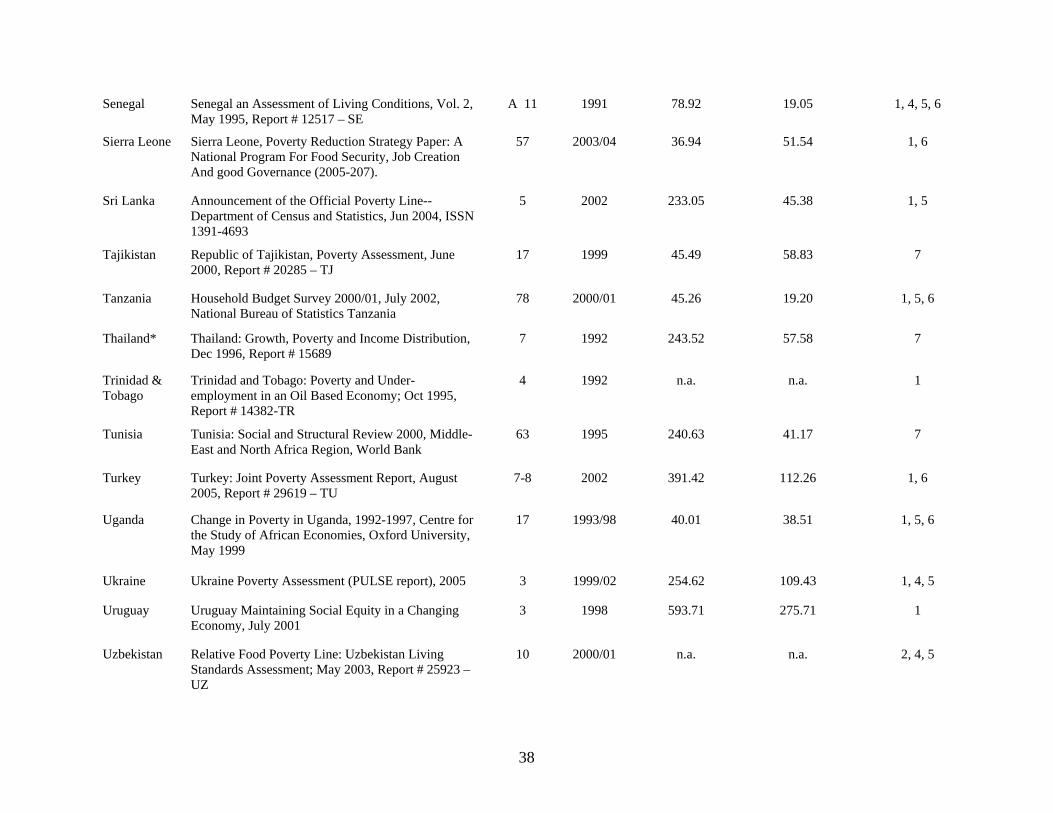
Senegal Senegal an Assessment of Living Conditions, Vol. 2, May 1995, Report # 12517 – SE
A 11 1991 78.92 19.05 1, 4, 5, 6
Sierra Leone Sierra Leone, Poverty Reduction Strategy Paper: A National Program For Food Security, Job Creation And good Governance (2005-207).
57 2003/04 36.94 51.54 1, 6
Sri Lanka Announcement of the Official Poverty Line--Department of Census and Statistics, Jun 2004, ISSN 1391-4693
5 2002 233.05 45.38 1, 5
Tajikistan Republic of Tajikistan, Poverty Assessment, June 2000, Report # 20285 – TJ
17 1999 45.49 58.83 7
Tanzania Household Budget Survey 2000/01, July 2002, National Bureau of Statistics Tanzania
78 2000/01 45.26 19.20 1, 5, 6
Thailand* Thailand: Growth, Poverty and Income Distribution, Dec 1996, Report # 15689
7 1992 243.52 57.58 7
Trinidad & Tobago
Trinidad and Tobago: Poverty and Under-employment in an Oil Based Economy; Oct 1995, Report # 14382-TR
4 1992 n.a. n.a. 1
Tunisia Tunisia: Social and Structural Review 2000, Middle-East and North Africa Region, World Bank
63 1995 240.63 41.17 7
Turkey Turkey: Joint Poverty Assessment Report, August 2005, Report # 29619 – TU
7-8 2002 391.42 112.26 1, 6
Uganda Change in Poverty in Uganda, 1992-1997, Centre for the Study of African Economies, Oxford University, May 1999
17 1993/98 40.01 38.51 1, 5, 6
Ukraine Ukraine Poverty Assessment (PULSE report), 2005 3 1999/02 254.62 109.43 1, 4, 5
Uruguay Uruguay Maintaining Social Equity in a Changing Economy, July 2001
3 1998 593.71 275.71 1
Uzbekistan Relative Food Poverty Line: Uzbekistan Living Standards Assessment; May 2003, Report # 25923 – UZ
10 2000/01 n.a. n.a. 2, 4, 5
38

Venezuela Venezuela Poverty Study: From Generalized Subsidies to Targeted Programs, 1991
17 footnote
1989 492.30 224.73 1
Vietnam Vietnam Development Report 2004:Poverty, Report # 27130
19 2002 81.18 32.52 7
Yemen Republic of Yemen: Poverty Update, vol. 1, main report; June 2002, Report # 24422
3 1998 76.37 65.37 1, 4, 5
Zambia Zambia: Poverty and vulnerability assessment: discussion draft, June 2005, Report 32573
37 2002/03 60.40 39.69 1, 6
39
Notes: * Urban poverty lines are used since the PPP 2005 rates were from urban centers for these countries. 1. The codes for methods (last column) are: Cost of basic needs=1; Food energy intake method=2; Relative poverty line=3; Same food basket=4; Regional
price index used=5; Per adult equivalent =6; Information not available=7 2. Based on ICP sampling information we treat the 2005 consumption PPPs as an urban PPPs for the following countries: Argentina, Brazil, Bolivia,
Cambodia, Chile, China, Colombia, Pakistan, Peru, Thailand and Uruguay. For these countries, both poverty line and food poverty lines are urban poverty lines. Ecuador and Venezuela have national poverty lines since urban lines are not available. For further discussion of the sources of sampling bias in the China ICP for 2005 see Chen and Ravallion (2008a).
3. When we only have rural and urban poverty lines for a country, the national poverty line is calculated as the weighted mean of the urban and rural poverty lines, using urban and rural real consumption (or income) shares as the weights, and using the poverty lines as the deflators. Thus the national line is
rruu ZwZwZ += where uZ and rZ are the urban and rural poverty lines, )]/()//[()/( rrruuuuuuu ZYnZYnZYnw +≡ ( 1=+ ru ww ), un ,
rn are the populations shares ( 1=+ ru nn ), and uY and rY are the survey mean nominal income/consumptions for urban and rural areas and This formula was used to calculate the national poverty line for India, Benin, Ethiopia, Gambia, Kenya, Macedonia, Mexico, Mozambique, Niger and Senegal.
4. For Paraguay, the poverty line is for the capital city only since the 2005 ICP survey only covered the capital city. 5. Brazil: Urban poverty line was a simple average of metropolitan and other urban poverty lines. Cambodia: Urban poverty line was a simple average of
Phnom Penh and other urban poverty lines. Colombia: Simple average of 7 urban regions’ poverty lines. Costa Rica: Food poverty line was multiplied by 2 to get total poverty line. Cote d’Ivoire: Relative poverty line. Guinea Bissau: Total poverty line was derived from urban and rural poverty line using urban rural population share as a weight (since it does not have urban rural mean, the method mentioned in note 3 was not applicable). Kazakhstan: Poverty line is equal to average subsistence minimum. Mali: Relative poverty line. Peru: Urban poverty line was derived as a simple average of urban Costa, urban Selva and urban Sierra of Peru.

Table A2: Countries with missing data
1993 PPP PCE
2005 PPP
Food PL
Algeria yes yes no yes Bosnia-Herzegovina no yes yes yes Chad yes no yes no Congo, Rep yes yes yes no Costa Rica yes yes no yes Djibouti no yes yes no Dominican Rep yes yes no yes El Salvador yes yes no yes Guatemala yes yes no yes Guinea Bissau no yes yes no Haiti yes yes no no Honduras yes yes no yes Jamaica yes yes no no Lao yes no yes no Mauritius yes no yes no Nicaragua yes yes no yes Panama yes yes no yes Trinidad & Tobago yes yes no no Uzbekistan no no no yes Number of "yes" 15 16 7 10 Number of "no" 4 3 12 9