Embed Size (px)
Citation preview

1
9. Logistic Regression
ECON 251
Research Methods

2
Logistic regression
So far, our dependent variable was a continuous variable. The question is how would we analyze data when the dependent variable is a dichotomous variable taking a value of either 0 or 1.
For instance, a person can vote for a democratic party or some other party in an election. If a person votes democratic, we can code this as y = 1 and if it does not, we code this as y = 0.
Then, we can estimate the probability that a person will vote for democrats given a particular set of valued for the chosen independent variables
OLS regression is inappropriate in this case
3
Logistic regression
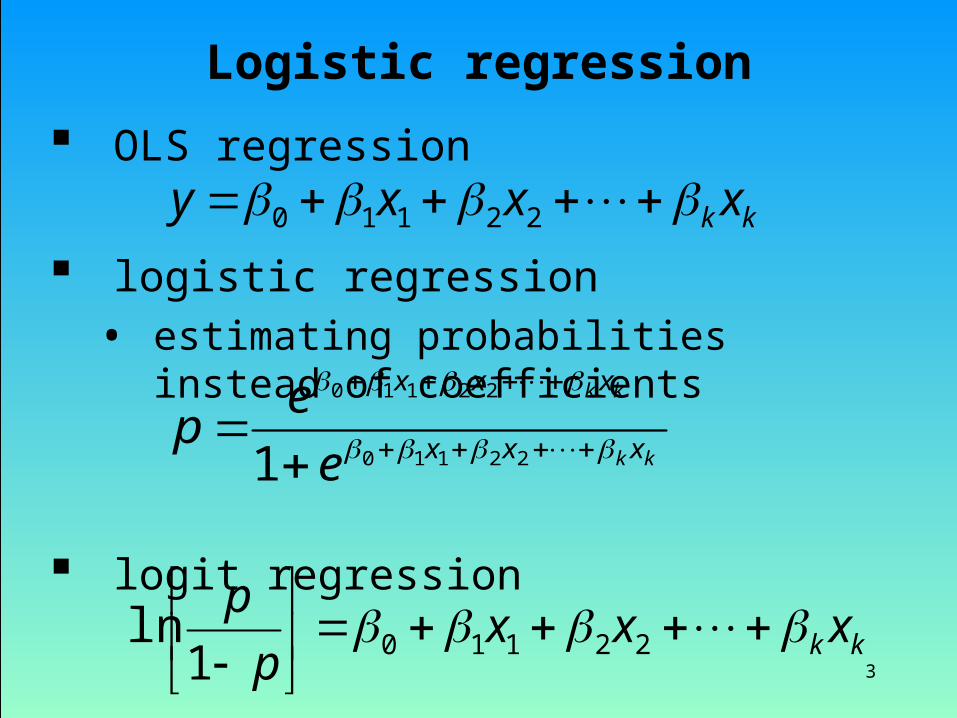
OLS regression
logistic regression• estimating probabilities instead of coefficients
logit regression
kk xxxy 22110
kk
kk
xxx
xxx
e
ep
22110
22110
1
kk xxxp
p
221101ln

4
Example – Buying a car
What is the probability that a person will purchase a car given the level of income?
Data file: Buying a car.xls CAR: 1 if car was purchased and 0 otherwise INCOME: person’s income in $1000 run OLS regression:
and you get:
)(10 INCOMEy
5
Example – Buying a car
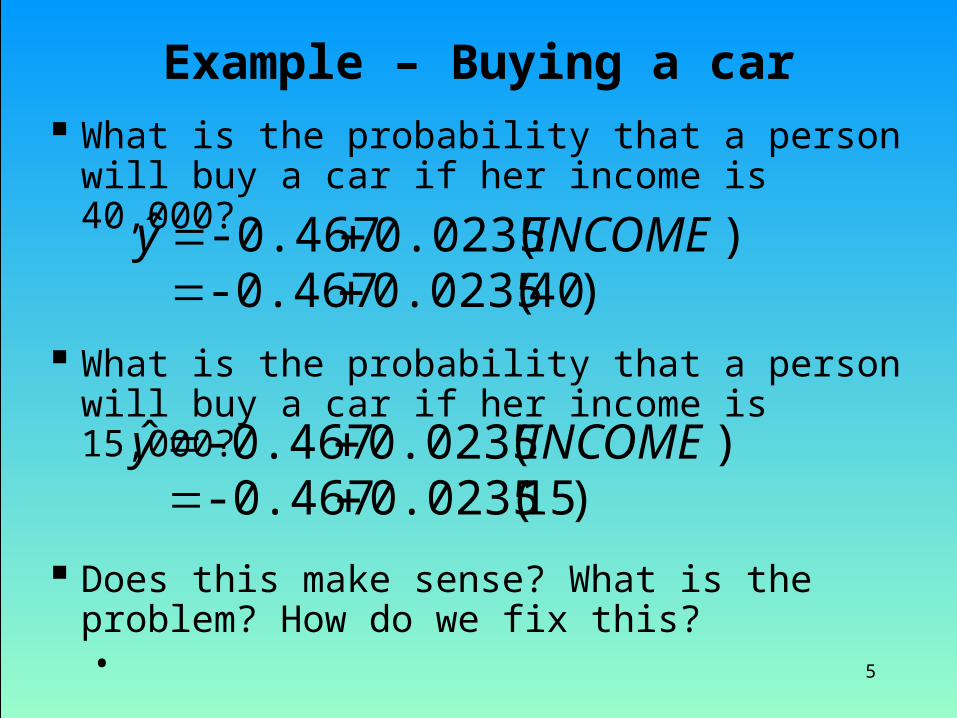
What is the probability that a person will buy a car if her income is 40,000?
What is the probability that a person will buy a car if her income is 15,000?
Does this make sense? What is the problem? How do we fix this?•
)( 0.0235-0.467ˆ INCOMEy )40( 0.0235-0.467
)( 0.0235-0.467ˆ INCOMEy )15( 0.0235-0.467
6
Example – Buying a car
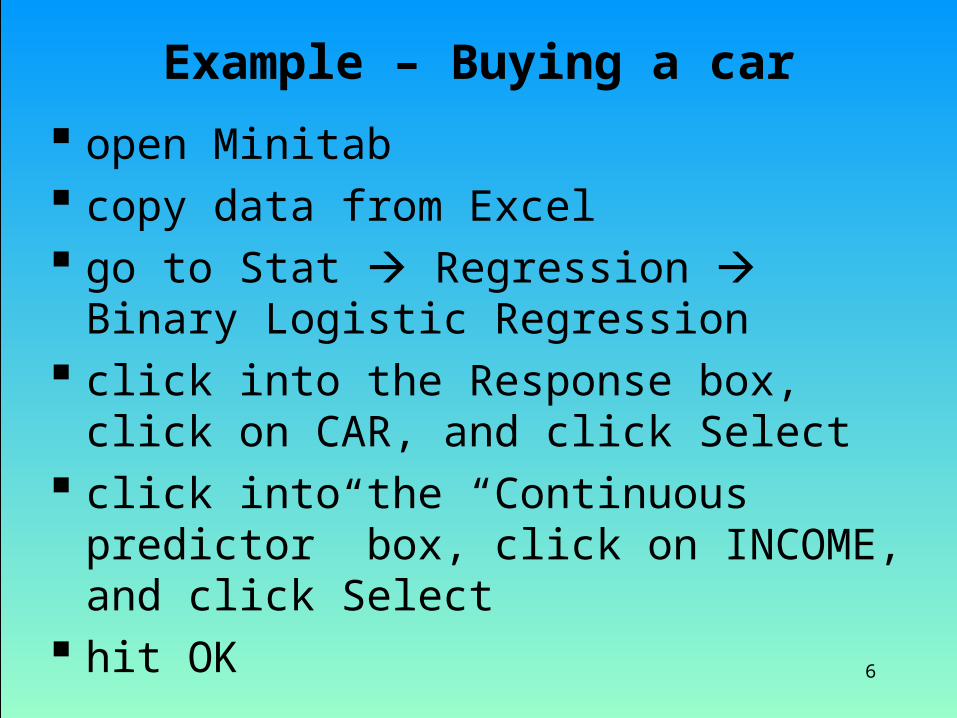
open Minitab copy data from Excel go to Stat Regression Binary Logistic
Regression click into the Response box, click on CAR, and click
Select click into the “Continuous predictor” box, click on
INCOME, and click Select hit OK

7

8
Example – Buying a car
Income positively effects the probability of buying a car, but we cannot tell by how much. Need to estimate probabilities.
)(*1486.018.6ˆ1
ˆlnˆ INCOME
p
pg
a significant variable
the model is good

9
Example – Buying a car
If we want to estimate the probability that a person with income of $40,000 will buy a car
1. estimate
2. calculate
g
g
e
ep ˆ
ˆ
1ˆ
)(*1486.018.6ˆ INCOMEg )40(*1486.018.6ˆ g 236.0
p̂
g
g
e
ep ˆ
ˆ
1ˆ
234.0
234.0
1
e
e 44127.0
10
Example – Buying a car
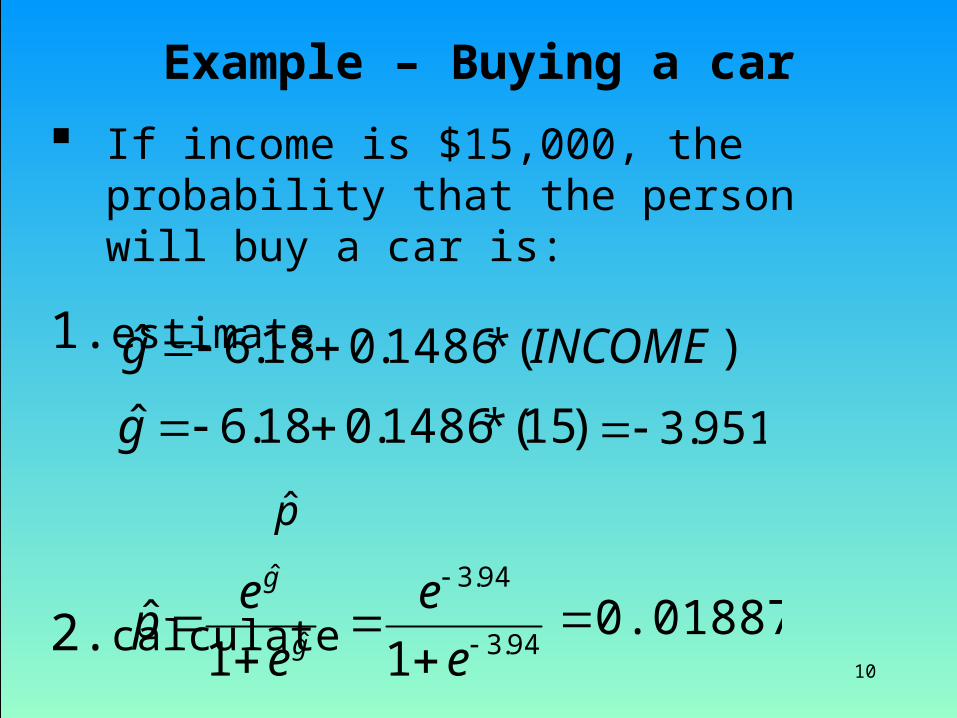
If income is $15,000, the probability that the person will buy a car is:
1. estimate
2. calculate
)(*1486.018.6ˆ INCOMEg
)15(*1486.018.6ˆ g 951.3
p̂
g
g
e
ep ˆ
ˆ
1ˆ
94.3
94.3
1
e
e 0.018872
11
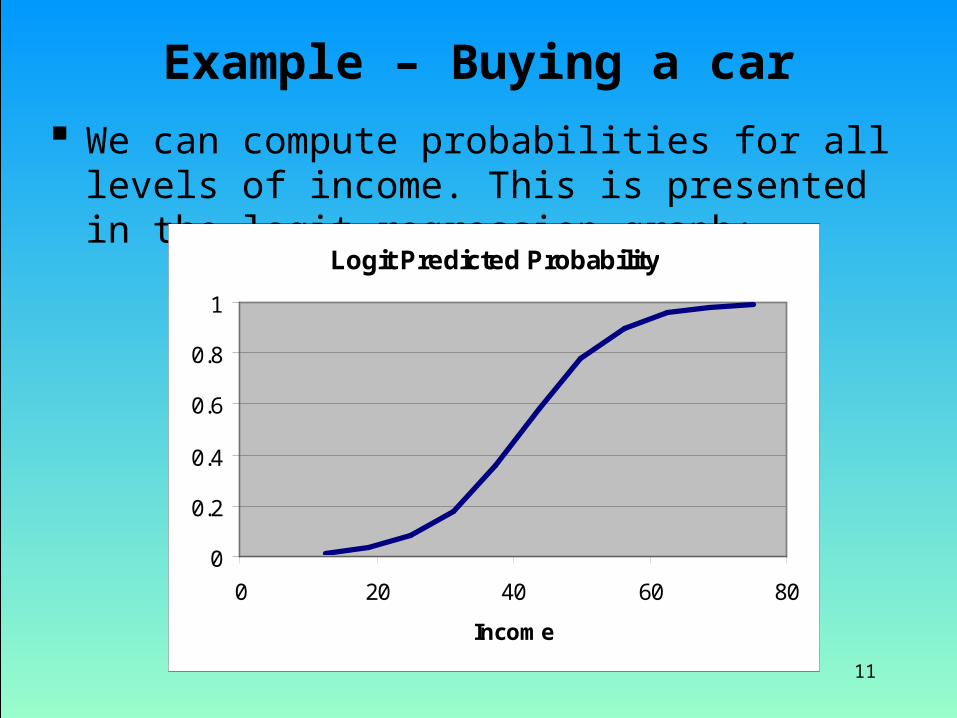
Example – Buying a car
We can compute probabilities for all levels of income. This is presented in the logit regression graph:
Logit Predicted Probability
0
0.2
0.4
0.6
0.8
1
0 20 40 60 80
Income
12
Application: Voting
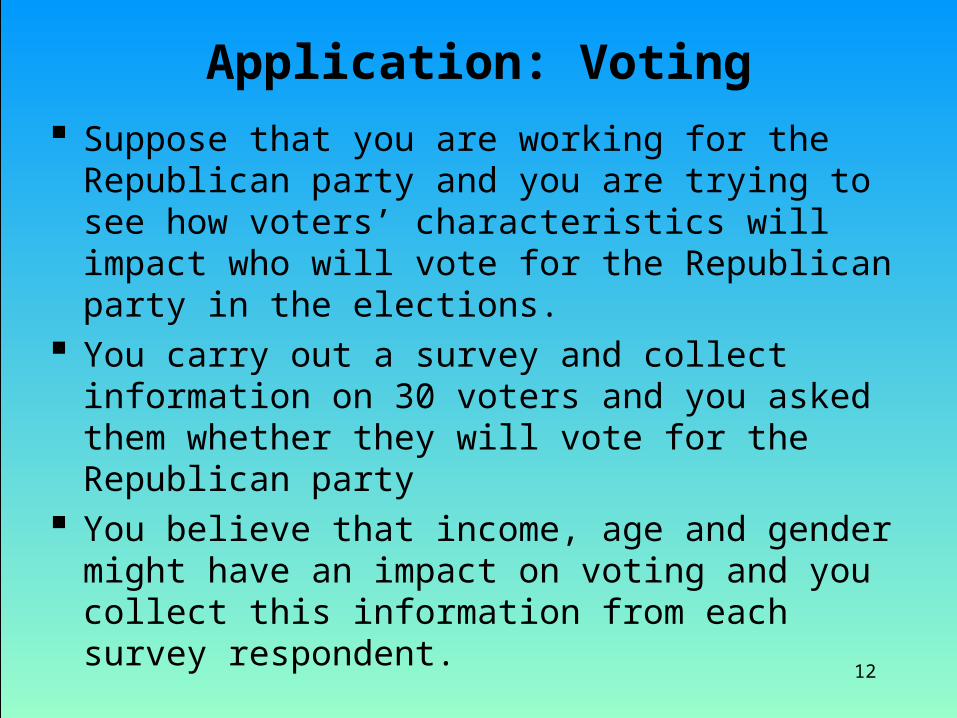
Suppose that you are working for the Republican party and you are trying to see how voters’ characteristics will impact who will vote for the Republican party in the elections.
You carry out a survey and collect information on 30 voters and you asked them whether they will vote for the Republican party
You believe that income, age and gender might have an impact on voting and you collect this information from each survey respondent.
13
Application: Voting
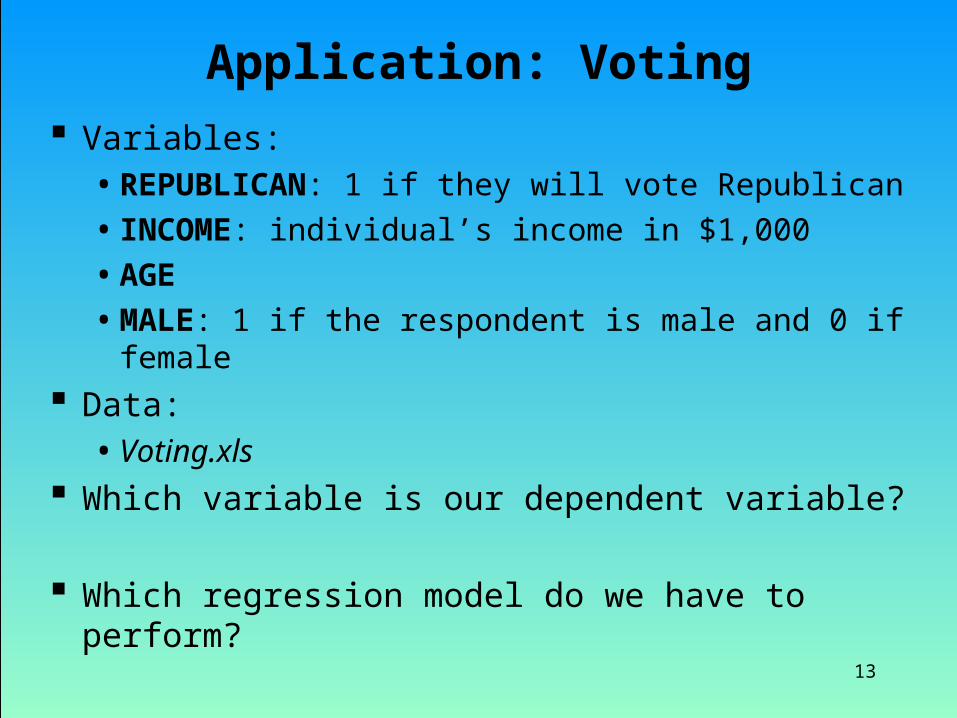
Variables:• REPUBLICAN: 1 if they will vote Republican• INCOME: individual’s income in $1,000• AGE• MALE: 1 if the respondent is male and 0 if female
Data:• Voting.xls
Which variable is our dependent variable?
Which regression model do we have to perform?
Application: Voting
14
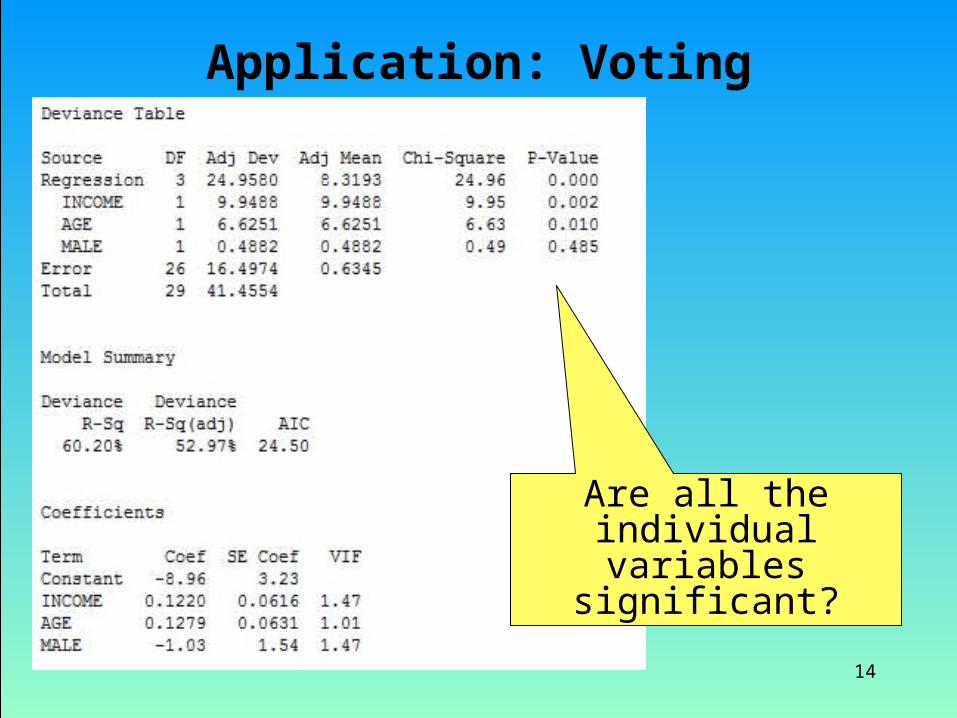
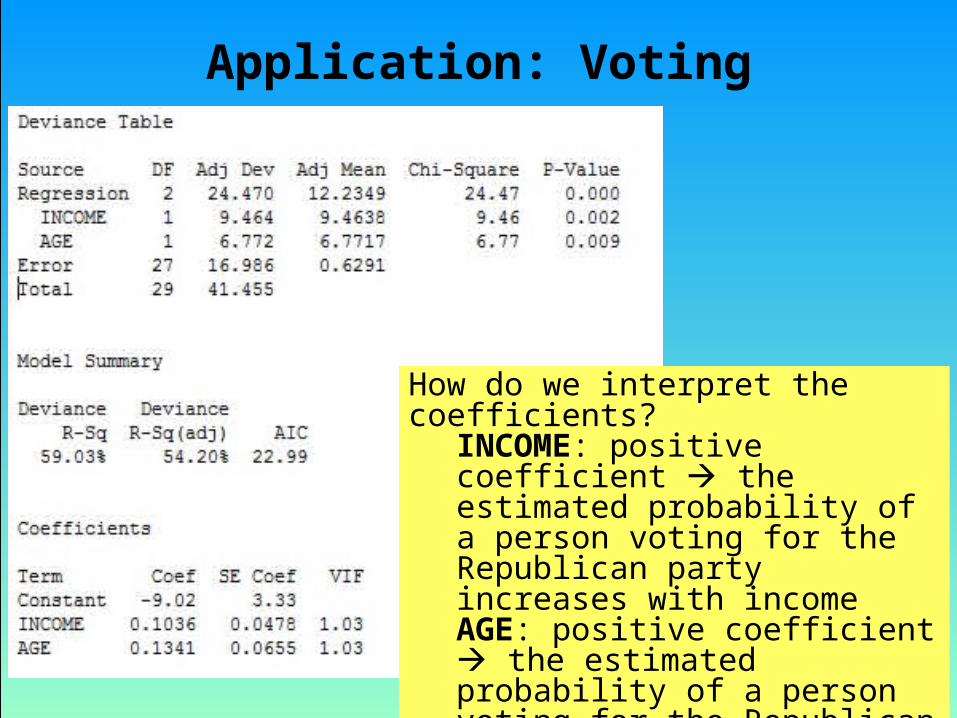
Are all the individual variables significant?
Application: Voting
15
How do we interpret the coefficients?INCOME: positive coefficient the estimated probability of a person voting for the Republican party increases with incomeAGE: positive coefficient the estimated probability of a person voting for the Republican party increases with age
16
Application: Voting
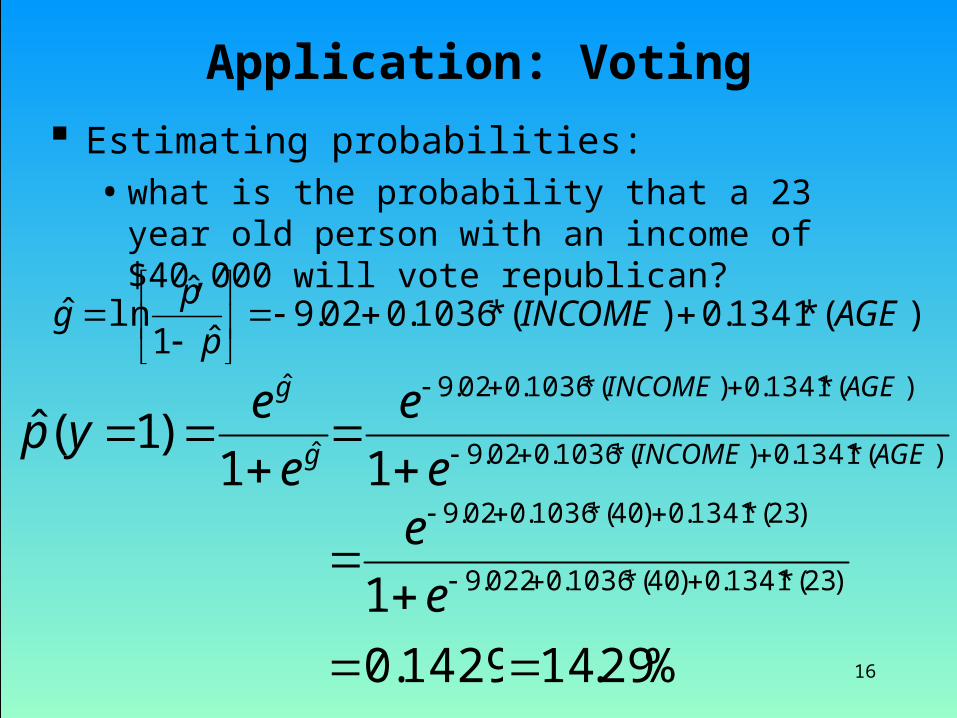
Estimating probabilities:• what is the probability that a 23 year old person with an
income of $40,000 will vote republican?
g
g
e
eyp ˆ
ˆ
1)1(ˆ
)(*1341.0)(*1036.002.9ˆ1
ˆlnˆ AGEINCOME
p
pg
)*(1341.0)*(1036.002.9
)*(1341.0)*(1036.002.9
1 AGEINCOME
AGEINCOME
e
e
1429.0 %29.14
)23*(1341.0)40*(1036.0022.9
)23*(1341.0)40*(1036.002.9
1
e
e
17
Application: Voting
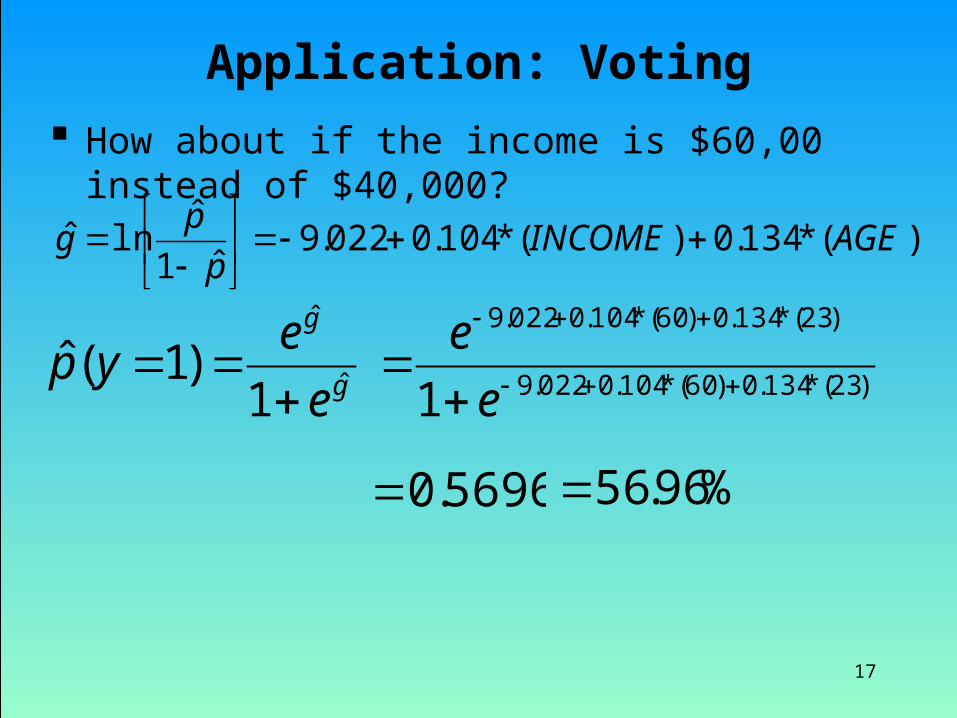
How about if the income is $60,00 instead of $40,000?
g
g
e
eyp ˆ
ˆ
1)1(ˆ
)(*134.0)(*104.0022.9ˆ1
ˆlnˆ AGEINCOME
p
pg
5696.0 %96.56
)23*(134.0)60*(104.0022.9
)23*(134.0)60*(104.0022.9
1
e
e


![Demand Creation and Economic Growth - UCLA Econ · Demand Creation and Economic Growth ... follows the logistic curve: (5) [ ] ... given, however. Rather at every moment a new product](https://img.dokumen.tips/doc/110x75/5ae96baa7f8b9ad73f8bd3c9/demand-creation-and-economic-growth-ucla-creation-and-economic-growth-follows.jpg)


![05A Department of Economic Development - Louisiana · 2020-06-06 · Executive Budget Supporting Document [FY 2006-2007] ECON - 3 05A - Department of Economic Development 05-251 —](https://img.dokumen.tips/doc/110x75/5f471f4f97d36f2d825ccae7/05a-department-of-economic-development-2020-06-06-executive-budget-supporting.jpg)