Embed Size (px)
Citation preview

1
2103-390 Mechanical Engineering Experimentation and Laboratory I
Experiment
Definition of Experiment and Functional Form
Three-Column Table of Objectives
Classification of Physical Quantities in Experiment
Measured Quantities
Derived Quantities
Data Reduction Diagram (DRD)

2
Experiment

3
Goals and Roles of Experiment
Goal: Extract knowledge and useful information regarding the
system of interest with reasonable justification.
new knowledge,
used in product design and development,
qualify a product according to some standard,
falsify/verify a theory, call for a new theory,
hint toward the structure or mathematical form of a theory,
etc.
Activity: Class Discussion
Give examples and discussions of uses of experiment in these various roles.

4
5C: Some Qualifiers in Experimentation
Observation - Ask the Right Question / Critical Thinking / Creativity
5C = Clear, Convincing, Coherent, Concise, and Consistent
1) Clear Problem Statement / Question
2.2) Convincing Supporting Evidences / Experimental Results
2.1) Convincing Justification Method
2) Convincing Justification
3) Clear, Convincing/Justified, and Coherent Conclusions

5
Report: Conclusions
What are conclusions?
Conclusions are convictions based on evidence.
From The American Institute of Physics: AIP Style Manual, Fourth Edition:
http://www.aip.org/pubservs/style/4thed/toc.html
6
Classification of Physical Quantities in Experiment
Measure Quantities VS Derived Quantities

7
How can we find the gravitational constant g?Experiment: Gravitational Constant g = ?
Activity: Class Discussion
Give examples and discussions of uses of experiment in these various roles.

8
Example: Determination of Gravitational Constant gExperiment: Gravitational Constant g = ?
tMeasure t with timer
2
22
2),(
2
1),,0(
2
1),,(
t
stsg
gttgVsgttVtgVs ooo
Derive g from
• kinematic relation, and
• numerical values of (s,t)
Measure s with measuring tape

9
Classification of Physical Quantities in Experiment Measured Quantities:
Numerical values from measurement with measuring instruments
Derived Quantities:
Numerical values from relations (definition, theoretical relation, etc.)
Basically in sciences/engineering, the numerical value of a physical quantity is either
measured with a measuring instrument, or
derived through a physical relation.
* We do not want anybody to make up any number if it is meant to be useful
physically. *

10
Definition of An Experiment via A Functional Form
);;(parametersconstant parameters VariablevariablestIndependenvariablesDependent
cpxfy
11
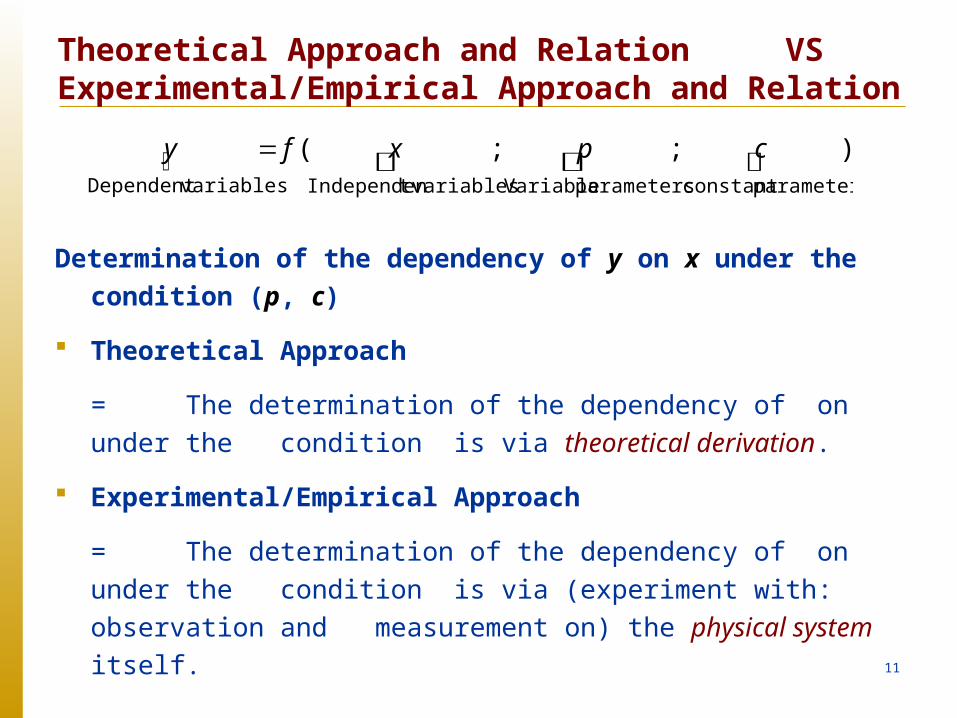
Theoretical Approach and Relation VS Experimental/Empirical Approach and Relation
Determination of the dependency of y on x under the condition (p,
c)
Theoretical Approach
= The determination of the dependency of on under the
condition is via theoretical derivation.
Experimental/Empirical Approach
= The determination of the dependency of on under the
condition is via (experiment with: observation and
measurement on) the physical system itself.
);;(parametersconstant parameters VariablevariablestIndependenvariablesDependent
cpxfy
12
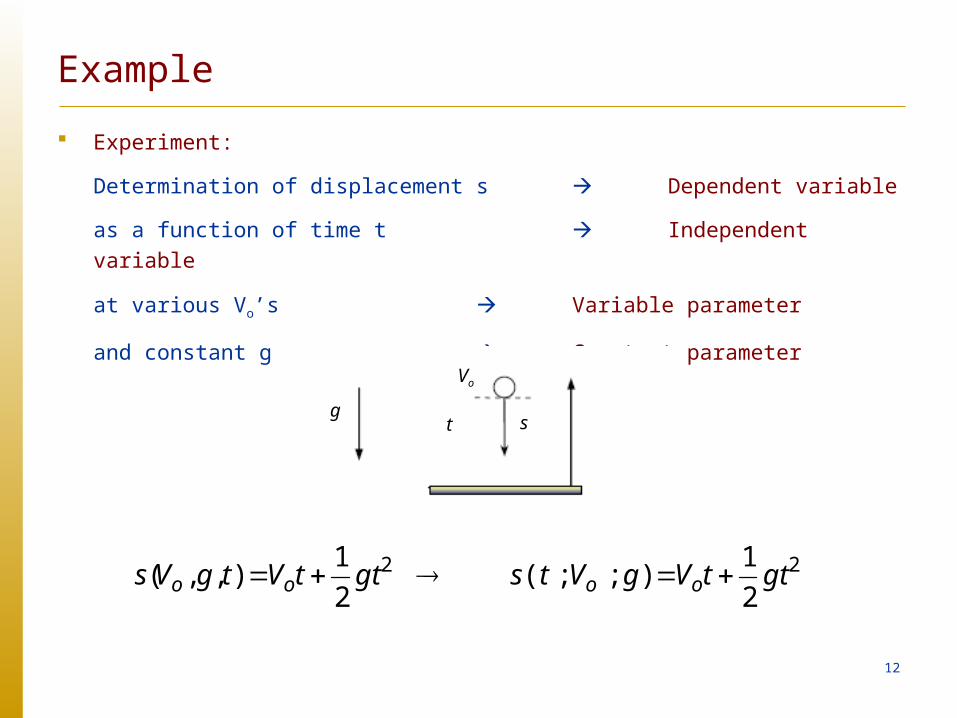
Example
Experiment:
Determination of displacement s Dependent variable
as a function of time t Independent variable
at various Vo’s Variable parameter
and constant g Constant parameter
22
2
1);;(
2
1),,( gttVgVtsgttVtgVs oooo
t sg
Vo

13
);;(
);;(parametersconstantparametersvariablevariablestindependenvariablesdependent
gVtfs
cpxfy
o
Dependent variables
0
500
1000
1500
2000
2500
0 2 4 6 8 10
t (s)
s (m
) s (v=0)
s (v=2)
Line – Theoretical Relations
Point markers – Experimental data points
Line – Curve-fit to experimental data points
Vo1 = 0 m/s
g
s (m)
t (s)
Independent variables
Variable parametersVo2 = 2 m/s
Constant parameters
14
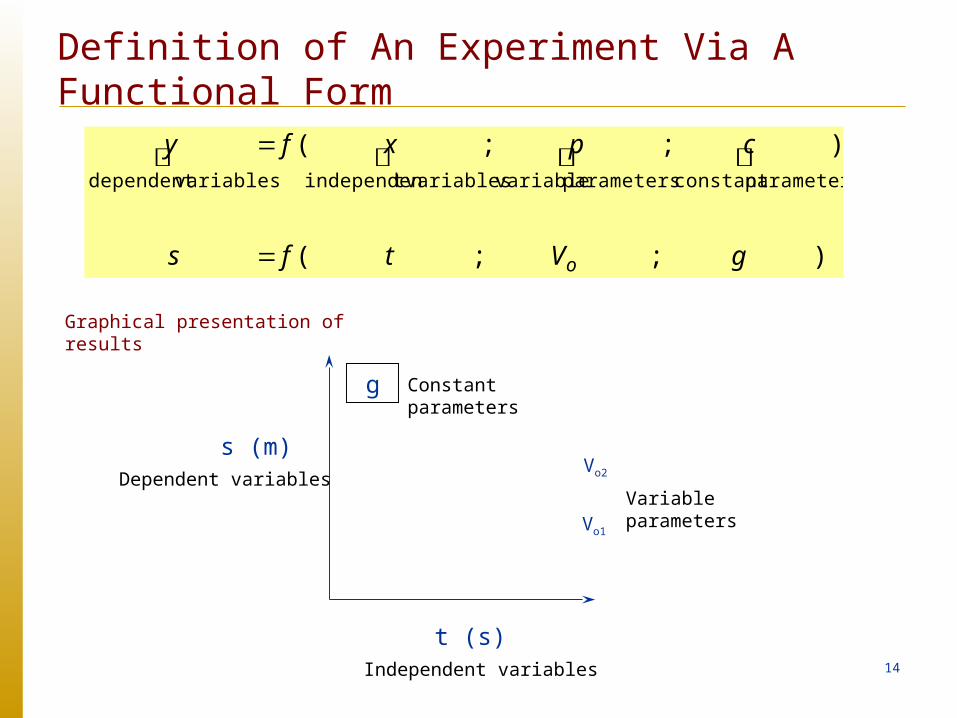
Definition of An Experiment Via A Functional Form
);;(
);;(parametersconstantparametersvariablevariablestindependenvariablesdependent
gVtfs
cpxfy
o
Vo1
g
s (m)
t (s)Independent variables
Variable parameters
Vo2
Constant parameters
Dependent variables
Graphical presentation of results

15
Definition of Experiment and Functional Form

16
Experiment 1 VS Experiment 2
p1
R
(k/m3)
T (K)
p2
Experiment 2: );;( GasRTpf
Experiment 1: );;( GasRpTf
VS
T1
R
(k/m3)
p (pa)
T2
Are they the same?

17
Three-Column Table of Objectives
18
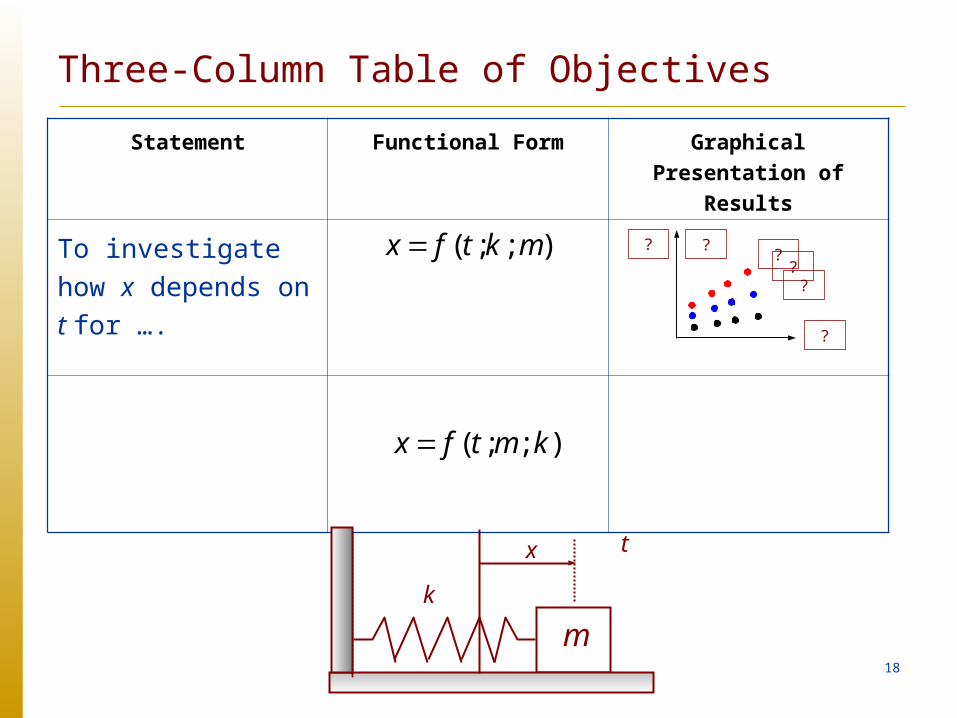
Three-Column Table of Objectives
Statement Functional Form Graphical Presentation of
Results
To investigate how x
depends on t for ….);;( mktfx
m
x
k
t
);;( kmtfx
??
?
?
??
19
Experiment and Data Reduction Diagram (DRD)

21
Key Idea of DRD
KEY IDEA in Constructing a Set of DRDs for an Experiment
1. Question/Relation: Set the goal that we want to answer the question
‘whether and how .’
2. Graphical representation of results: We then know that the graphical
representation of the relation should look like below:
);;( cpxfy

22
Key Idea of DRD
3. Data Reduction Diagram (DRD):
Construct a data reduction diagram (DRD) for each of the final variables:
DRD-y DRD-x DRD-p DRD-c

23
Example of DRD

25
DRD: Key Idea
Know and specify clearly and specifically the sources of the numerical value in
the unit of a physical quantity - both at the source and derived levels - that
source-level: either enters our experiment at the source level,
derived-level: or is derived through a relation in our intermediate data
analysis step.

26
DRD: Key Idea
• The reason is that if we suspect that something is wrong with our final
(numerical) result:, we can trace back each and every data analysis step, step-
by-step, from the end result to the sources.
• Note that a step here refers to a step of numerical transformation. For
example, a unit conversion – though may be simple enough – is also
considered a step since there is a transformation of numerical value, from one
value to another.

27
Experiment and Data Reduction Diagram (DRD)
DRD-y DRD-x DRD-p DRD-c
);;( cpxfy
There must be DRD for all physical quantities in the definition of an experiment.

28
Experiment: Determine average velocity as a function of distance s for various bodies (p) at constant Vo and g.
[ Theory:
]
Experiment and Data Reduction Diagram (DRD)
),;;( gVpsfV o
V

29
Experiment: Determine average velocity as a function of distance s for various bodies (p) at constant Vo and g.
Experiment and Data Reduction Diagram (DRD)
),;;( gVpsfV o
V
s (m)
V Vo,g(m/s)
(s, )V
2)(
gssV Theory: is determined from s:V
Experiment:
• We must determine the numerical values of and s independently coordinates
• We also need to determine p ball, feather
• We also need to determine c Vo, g
),( VsV
DRD-y DRD-x DRD-p DRD-c

30
Example: DRD-y DRD- V

31
DRD: Box for Derived Quantities

32
DRD: Box for Measured Quantities

33
DRD-y: DRD-V

34
35
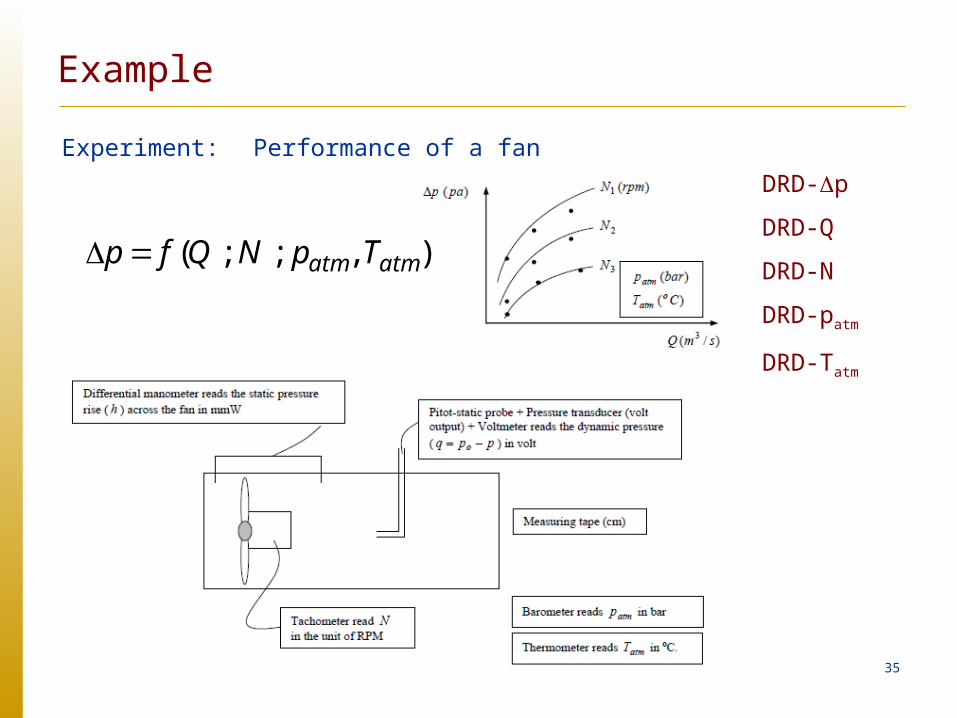
Example
Experiment: Performance of a fan
),;;( atmatm TpNQfp
DRD-p
DRD-Q
DRD-N
DRD-patm
DRD-Tatm

36
DRD-y: DRD-p
Measuring instruments

37
What can we derived from DRD?
1. List of all variables in our experiments
1. Measured quantities
2. Derived quantities
3. Referenced quantities
2. List of all relations in our experiments
3. List of all required instruments
4. Data collection worksheet (DCW)
5. Data analysis work sheet (DAW)
6. Uncertainty analysis

38
What can DRD help?
To get an overview of an experiment
To identify weak points (e.g., validity of the reference sources,
data analysis steps)
To diagnose the experiment (e.g., when
something’s wrong).

39