Embed Size (px)
Citation preview

BUSINESS APPRAISAL
of
Sample Paving & Excavation, Inc.
as of
March 31, 2006
Prepared for
Mr. James G. Sample
Prepared by
George D. AbrahamBCBA,CMEA,FCBI,SBA,BCB,AAR
Houston Corporate OfficeP.O. Box 1262
Dickinson, Texas 77539_____________________________
Research and Production1120 Nasa Parkway, Suite 440
Houston, Texas 77058

TABLE OF CONTENTS_______________________________________________________________________________________________
Page
1. Table of Contents 12. What is Valued in this Report 23. Contingent and Limiting Conditions/Departure Provisions 34. Opinion Letter 55. Stock Sale Analysis 66. Statistical Summary 77. Graphic Display 88. Valuation Methods 99. Comparable Sales Analysis 1110. Critical Factors Discount/Premium Analysis 1211. Risk Factor Method 1312. Weighted Value Formulas 1513. Correlation of Methods 1714. Clarification of Value 1815. Comments on Appraisals 2016. Comments on Fair Market Value 2117. Comments on Certification 2418. Confidentiality Agreement 2519. Introduction 2620. Appraiser's Certification 2821. Required Rates of Return - Forming a Capitalization Rate 2922. Principles of Evaluation 3323. Evaluation Model 3424. Supporting Data Section 4125. Interview Questionnaire and General Assumption by the Appraiser 4226. Discretionary Net Profit Analysis 4727. Historical and Projected Overview 4828. Normalized Discretionary Earnings 4929. Justification For Purchase Tests 5030. Sources of Information 5331. Evaluators Qualifications 5632. Appendices 64
a) Robert Morris Associates Ratios and definitions b) BES Required Rates of Return c) Comparable Sales d) Industry Report e) Trade Area Outlook f) International Glossary
1

WHAT IS VALUED IN THIS REPORT This Business Evaluation Report and analysis of value assumes a "Corporate Sale" and reflects the"Stock Value" of the company. It does include "Current Assets" such as cash, accounts receivable,prepaid expenses and other liquid assets that would normally show up on the accountants balance sheetfor the company. It also includes all of the company's liabilities. This report values the tangible assets of the company and the intangible business value and assumes that the seller would transfer to apurchaser all current assets and liabilities of the company at the time of sale. For further clarification,please see page six of this report.
The report does not take into consideration the real estate that the company may own and considers this tobe an "Investment Asset". However, when the company does own real estate, a comparative market rentis deducted from the earnings to reflect the true earning power of the company, since the ownership ofreal property is discretionary to a business. If the company being value owns the real estate it should beconsidered an investment asset that would be added to the value opinion in this report. Also, BusinessEvaluation Systems has not valued the real estate nor the hard assets of this business and has relied onsources deemed reliable.
WRITTEN VALUATION REPORTS
The Uniform Standards of Professional Appraisal Practice (USPAP) outlines the minimum requirements for afull, formal written report. USPAP also allows for departure from some, but not all, of its requirements for more limited forms of reports. The more limited reports are designed for situations like client decision making, butthe complete report is suited for many litigation purposes. The full valuation report will typically include thefollowing sections:
1. A valuation opinion letter summarizing the appraisal procedures and the valuation conclusions.
2. Several sections summarizing the relevant valuation theory, methodology, procedures, analyses, and conclusions.
3. A Valuation synthesis and conclusion.
4. An exhibit section presenting a summary of the quantitative and qualitative appraisal analysis.
5. A listing of the data and documents the appraiser relied on.
6. A statement of the contingent and limiting conditions of the appraisal.
7. An appraisal certification.
8. The professional qualifications of the principal analysts.
2

DISCLAIMER_______________________________________________________________________________________________
PLEASE TAKE NOTICE that in this Business Appraisal report we have utilized the "DepartureProvision" as allowed by the Appraisal Foundation. This provision allows the appraiser to eliminate certain parts of the report that the client would be totally familiar with and thus provide an appraisal reportthat is cost efficient for the client. Utilizing the Departure Provision should not and does not lessen thestatus of an appraisal report. The parts of the report we may have eliminated, but did research are:A write-up on the history of the company, the local and national economy, industry forecasts and a step-by-step display of all formulas and calculations.
A Business Appraisal, as defined by current certification rules, may be performed without liability, if theuser is aware that the appraisal is a departure from the standards for formal appraisals as outlined by theAppraisal Foundation. Also, the user of this report should be aware that Business Evaluation Systems, norany of its representatives, have verified any information as to accuracy and any conclusion is only supported by the quality of the data provided.
CONTINGENT AND LIMITING CONDITIONS/DEPARTURE PROVISIONS
1. The appraiser, by reason of performing this Business Evaluation and preparing this report, is notto be required to give testimony nor be in attendance in court or any other governmental hearingwith reference to matters herein, unless prior arrangements have been made with the evaluatorrelative to such additional employment.
2. The appraiser assumes no responsibility for matters of a legal nature affecting the propertyvalued or the title thereto, nor does the Evaluator render any opinion as to the title, which isassumed to be good and marketable. The property is valued as though under responsibleownership.
3. Business Evaluation Systems assumes no responsibility for any environmental problems and hasnot inspected the property.
4. This appraisal was based on a specific period of time. Data for this period of time has beencollected from several sources. The particular market environment may not be exhibited again inthe future. A Business Appraisal is based on market data and research of factors surrounding thesubject at a particular time. The appraiser assumes no responsibility for errors in data availablefrom sources external to Business Evaluation Systems.
5. The selection of the use of Fair Market Value was made by the client. The appraiser assumes noresponsibility for the type of value selected as opposed to other types of value.
6. Business Evaluation Systems was retained by its client, who is thoroughly familiar with thebusiness and all past and future performance information used in this report has been based oninformation provided by the client and other sources deemed to be reliable. Business EvaluationSystems disclaims any ability of any potential purchaser to generate any future income, cost andexpense potential or expectations as may be stated in this report.
3

CONTINGENT AND LIMITING CONDITIONS/DEPARTURE PROVISIONS_______________________________________________________________________________________________(Continued)
7. All information in this report has been provided by our client, most of which is contained in the
questionnaire section of this report and is assumed to be reliable. No verification of the informationhas been done by Business Evaluation Systems, nor has the appraiser made an inspection or onsite visit of the business premises or facilities.
8. Any sketch that may be presented in this report may show approximate dimensions and is includedto assist the reader in visualizing the property. The appraiser has made no survey of theproperty.
9. Information, estimates, and opinions furnished to the appraiser and contained in this report wereobtained from sources considered reliable and believed to be true and correct. However, noresponsibility for accuracy of such items furnished the appraiser can be assumed by the appraiser.
10. Disclosure of the contents of this report is governed by the bylaws and regulations of theprofessional organizations with which the appraiser is affiliated.
11. Possession of this report or a copy thereof does not carry with it the right of publication. It may notbe used for any other purpose, in whole or in part, by anyone except the client, his advisors, or taxing agencies and for whom the appraisal was prepared without the previous written consent of the appraiser.
12. It is assumed that the reader of this report has at least a basic understanding of the subject'sindustry, terminology, and operations.
13. Other assumptions and limiting conditions are, as may be stated, in various other contents of thisreport.
14. Should new information be discovered that would alter the value of this report or an error in the report found, the appraiser reserves the right to change the report.
4
BUSINESS EVALUATION SYSTEMS 1120 Nasa Parkway, Suite 440, Houston, Texas 77058
(281) 337-3508 Fax (281) 534-3785 www.BESappraisals.com______________________________________________________________________________________
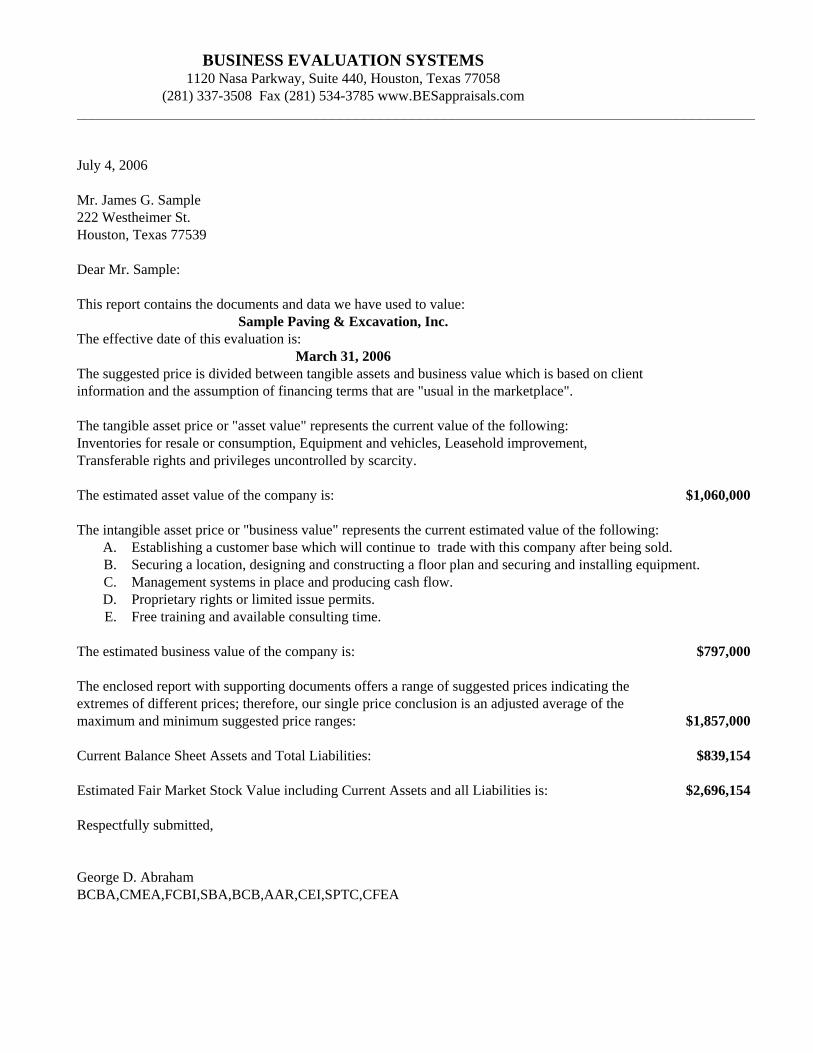
July 4, 2006
Mr. James G. Sample222 Westheimer St.Houston, Texas 77539
Dear Mr. Sample:
This report contains the documents and data we have used to value:Sample Paving & Excavation, Inc.
The effective date of this evaluation is:March 31, 2006
The suggested price is divided between tangible assets and business value which is based on clientinformation and the assumption of financing terms that are "usual in the marketplace".
The tangible asset price or "asset value" represents the current value of the following:Inventories for resale or consumption, Equipment and vehicles, Leasehold improvement,Transferable rights and privileges uncontrolled by scarcity.
The estimated asset value of the company is: $1,060,000
The intangible asset price or "business value" represents the current estimated value of the following:A. Establishing a customer base which will continue to trade with this company after being sold.B. Securing a location, designing and constructing a floor plan and securing and installing equipment.C. Management systems in place and producing cash flow.D. Proprietary rights or limited issue permits.E. Free training and available consulting time.
The estimated business value of the company is: $797,000
The enclosed report with supporting documents offers a range of suggested prices indicating theextremes of different prices; therefore, our single price conclusion is an adjusted average of themaximum and minimum suggested price ranges: $1,857,000
Current Balance Sheet Assets and Total Liabilities: $839,154
Estimated Fair Market Stock Value including Current Assets and all Liabilities is: $2,696,154
Respectfully submitted,
George D. AbrahamBCBA,CMEA,FCBI,SBA,BCB,AAR,CEI,SPTC,CFEA

STOCK SALE ANALYSIS Sample Paving & Excavation, Inc.
This evaluation has been performed under the assumption of an Asset Sale. To convert our analysisof value to a stock sale as of the effective date of the evaluation, the calculations would be as follows:
Sample Paving & Excavation, Inc. As of: March 31, 2006
Total Asset Value, including both tangible and intangible values as stated on page five: $1,857,000
ADD all of the Current Assets as shown on the Accountant's Balance Sheetfor : Sample Paving & Excavation, Inc. $2,289,140
SUBTRACT all of the Corporation's Liabilities as shown on the Accountant's Balance Sheet. ($1,449,986)
____________Current Assets minus Total Liabilities Sub Total: $839,154
Estimated Business Value, Current Balance Sheet Assets and Total Liabilities: $2,696,154
6

STATISTICAL SUMMARY Sample Paving & Excavation, Inc.________________________________________________________________________________________
For summary purposes we have included a specific value for "ASSETS" and "BUSINESSVALUE" and a conclusive "SELLING PRICE".________________________________________________________________________________________
We estimate the Tangible Asset Value of this company to be: $1,060,000
We estimate the Intangible Asset Value of this company at: $797,000
We estimate the Fair Market Value of this company to be: $1,857,000_______________________________________________________________________________________________
Our analysis generates a price range representing the highest price a seller could expect andthe lowest price a seller should accept.
The "SUGGESTED PRICE" is calculated based on the information generated by the variousformulas, but does not account for special situations and discount deviations.
_____________________________________________________________________________________________
Suggested Pricing Upper Range Value Weight Lower Range Value
_______________________________________________________________________________________________Going Concern Asset Method $1,150,000 $940,000
Basic Method $3,070,000 $1,330,000 ASTCapitalization $1,790,000 80% $1,670,000 BASCritical Factor $4,300,000 $1,856,000 CAPDebt Capacity $2,150,000 20% $1,520,000 CRT
Comparable Sales $2,700,000 $1,380,000 DBTRisk Analysis Table $1,310,000 $1,310,000 CMP
Required Rates of Return $1,790,000 $1,670,000 RATIndustry Risk Factor $1,790,000 $1,580,000 RRR
Weighted Factors $1,250,000 $750,000 IRFMultiple Average $2,880,000 $1,630,000 WGTSuggested Range $1,860,000 $1,640,000 MLTSuggested Price $1,857,000 100% $1,857,000 RNG
PRCNOTES ABOUT SPECIAL CONDITIONS: If a particular range value is extremely high or extremelylow, do not be alarmed. Extreme deviations are the product of formulas which consider only one or twobusiness factors and are not representative of the total business.
This report will make adjustments and allowances for these extremes in the suggested range value.
If potential buyers used only one method for evaluation and that formula produced one extreme valuethere would be reason for concern. However, very few buyers consider only one formula, rather mostbuyers base their decision on the debt capacity and assets of a business and become generous orconservative based on their beliefs for all the other factors.
7
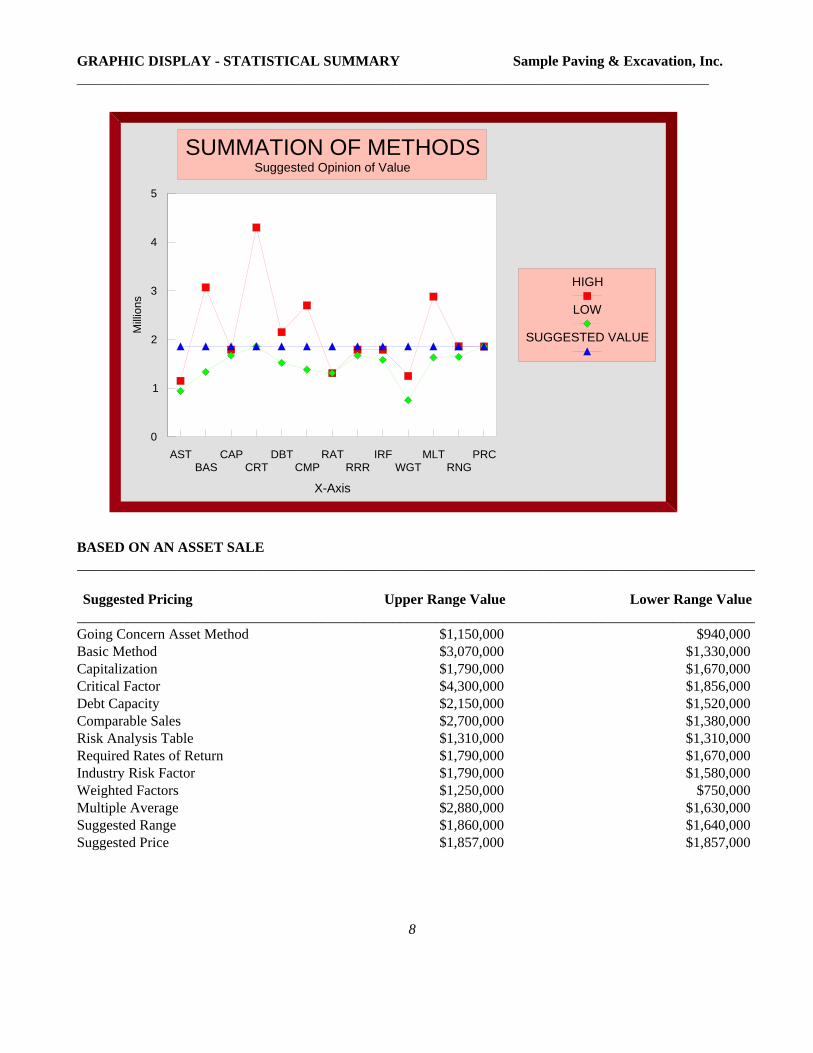
GRAPHIC DISPLAY - STATISTICAL SUMMARY Sample Paving & Excavation, Inc.________________________________________________________________________________________
BASED ON AN ASSET SALE_______________________________________________________________________________________________
Suggested Pricing Upper Range Value Lower Range Value
_______________________________________________________________________________________________Going Concern Asset Method $1,150,000 $940,000Basic Method $3,070,000 $1,330,000Capitalization $1,790,000 $1,670,000Critical Factor $4,300,000 $1,856,000Debt Capacity $2,150,000 $1,520,000Comparable Sales $2,700,000 $1,380,000Risk Analysis Table $1,310,000 $1,310,000Required Rates of Return $1,790,000 $1,670,000Industry Risk Factor $1,790,000 $1,580,000Weighted Factors $1,250,000 $750,000Multiple Average $2,880,000 $1,630,000Suggested Range $1,860,000 $1,640,000Suggested Price $1,857,000 $1,857,000
8
ASTBAS
CAPCRT
DBTCMP
RATRRR
IRFWGT
MLTRNG
PRC
X-Axis
0
1
2
3
4
5
Milli
ons
HIGH
LOW
SUGGESTED VALUE
SUMMATION OF METHODSSuggested Opinion of Value

VALUATION METHODS Sample Paving & Excavation, Inc. ____________________________________________________________________________________________
INDUSTRY RISK FACTOR BASIC VALUE Base Value $2,969,292 Adjusted Normalized Earnings $383,982 Asset Value $1,049,382 Competition $267,236 Management Type $801,709 Basic High $3,074,230 Turnover $623,551 Basic Low $1,328,426 Type Of Business $504,780 ______________________________________________ Owner Finance Yrs $296,929 CAPITALIZATION Owner Finance Rate $1,098,638 High Return % 23% Owner Finance % $148,465 Low Return % 22% Bank Finance Years $296,929 Bank Finance Rate $742,323 Capital Rate High $1,785,963 Bank Finance % $564,166 Capital Rate Low $1,669,487 Number of Employees $207,850 ______________________________________________ Age of Industry $801,709 WEIGHTED Industry Market $712,630 Target $2,201,328 Years Of Operation $1,425,260 Consulting Time $623,551 Labor 114% Net Cash - Salary $1,306,489 Predictability -264% Local Economy $801,709 Management 57% Labor Market $0 Competition 84% Skills Required ($267,236) Revenue 100% Union Strength ($1,098,638) Longevity 101% Location $3,830,387 Location 214% National Economy $356,315 Loanability 38% Clientele 61% National High $1,792,718 Liability 63% National Low $1,582,842 ___________________________________________ Weighted High $1,248,765 CRITICAL FACTOR Weighted Low $753,587 Financing 38% ______________________________________________ Desirability 93% DEBT CAPACITY METHOD Lease 188% Normalized Discretionary Earnings $512,132 Economy 240% Less: Managment Compensation $80,000 Less: Economic Depreciation $48,150 Critical High $4,295,455 Adjusted Normalized Earnings $383,982 Critical Low $1,856,137 ___________________________________________ Interest Rate 9.50% ASSET METHOD Equipment and Equity $435,000 Fast Payout Years 5 Improvements $0 Slow Payout Years 8 Vehicles $46,500 Stock/Supplies $567,882 Debt High $2,145,983 Licenses/Patents $0 Debt Low $1,523,603 Asset High $1,154,320 Asset Low $944,444 9

VALUATION METHODS______________________________________________________________________________________________
Risk Analysis Table______________________________________________________________________________________________
Adjusted Normalized Discretionary Earnings (page 49): $383,982 $383,982Multiples representing general industry: 4.35 4.65 Questions 17 and 18 divided by 100 (1.00/Q17) __________ __________
Target values $1,669,487 $1,785,963________________________________________________________ __________ ______________ ___________
Discount/PremiumTopics Reported for Importance Factored________________________________________________________ __________ ______________ ___________
Labor 3.0 100% 3.00 See question 53Financial Strength 3.0 100% 3.00 See question 57Facilities and Location 4.0 110% 4.40 See question 66Diversity of Accounts 3.0 140% 4.20 See questions 39 and 40Competition 3.0 100% 3.00 See question 51Predictability 3.8 120% 4.50 See questions 40, 50, 60 and 62Marketability 3.4 110% 3.71 See questions 45, 54, 59 and 68Future Outlook 4.0 140% 5.60 See questions 60 and 62Owner Importance 3.5 100% 3.50 See questions 52, 56 and 58 --------------- --------------------- -----------------
Totals (9 topics): 30.6 1020.0% 34.9
Divided by number of topics (Reported Multiples): 3.4 113.3% 3.9
Total Ratings used for this method (Adjusted Multiple): 3.4 3.9________________________________________________________ __________ ______________ ___________
Conclusion Risk Analysis Table________________________________________________________ __________ ______________ ___________
High Range Low Range
Reported (Adjusted Normalized Discretionary Earnings x Reported Multiple): $1,306,606
Adjusted Ratings (Adjusted Normalized Discretionary Earnings x Adjusted Multiple): $1,306,606
10
Sample Paving & Excavation, Inc._______________________________________________________________________________________________
This page identifies specific industries which have developed formulas from actual selling prices. In mostcases these formulas are simplistic and in no way account for financing terms or market conditions whichare critical factors in any offer. We include the formulas on the grounds that they do have somehistorically tested value and a reasonable buyer may be using this pricing method as a guideline._______________________________________________________________________________________________
COMPARABLE SALES ANALYSIS_______________________________________________________________________________________________
Mean High
Type Business: SIC # 1794/1799/1611/1771 $1,384,805 $2,698,680(See Comparable Sales Data in the Supporting Data Section of this report.)
* For explanations and analysis data, please refer to pages 21 through 23. _______________________________________________________________________________________________
BUSINESS EVALUATION SYSTEMS REQUIRED RATES OF RETURN DATABASE_______________________________________________________________________________________________
Low Range High Range
Type Business: SIC # 1794/1799/1611/1771 $1,324,076 $2,020,958(See Business Evaluation Systems Required Rates of Return in the 29% 19% Supporting Data Section of this report.)
These rates represent the high and the low extremes of reported data in theBusiness Evaluation Systems Database.
RATES SELECTED FOR THE CAPITALIZATION METHOD Low Range High Range
These rates are selected from the Business Evaluation Systems Database $1,669,487 $1,785,963and reflect an analysis of those rates that most represent the common size, 23% 21.5%sales, assets and location (if possible) compared to the subject business.
* For explanations and analysis data, please refer to pages 29 through 32.
11

CRITICAL FACTORS DISCOUNT/PREMIUM ANALYSIS_________________________________________ __________________________________________________
Down Down Int Bank Owner Bank OwnerPmt Pmt Rate Fixed Fixed Vary Vary
% % $ % % % % % %________________ __________ _________ ___________________ __________ __________ __________
0% 150% 38398 296% 6.0% 126% 138% 113% 116%5% 135% 76796 204% 6.5% 101% 114% 90% 95%
10% 122% 115195 163% 7.0% 80% 94% 71% 77%15% 110% 153593 138% 7.5% 62% 78% 55% 62%20% 103% 191991 121% 8.0% 48% 64% 41% 50%25% 96% 230389 109% 8.5% 35% 52% 29% 38%30% 92% 268787 100% 9.0% 24% 42% 18% 28%35% 90% 307186 92% 9.5% 15% 34% 8% 19%40% 87% 345584 85% 10.0% 6% 26% -0% 11%45% 85% 383982 80% 10.5% -1% 20% -8% 4%50% 84% 422380 75% 11.0% -9% 13% -16% -3%55% 83% 460778 71% 11.5% -15% 8% -23% -9%60% 82% 499177 68% 12.0% -21% 3% -29% -15%65% 81% 537575 65% 12.5% -27% -2% -35% -21%70% 80% 575973 62% 13.0% -32% -6% -41% -26%75% 79% 575973 62% 13.5% -37% -10% -46% -31%80% 78% 652770 57% 14.0% -41% -13% -51% -35%85% 77% 691168 55% 14.5% -46% -17% -56% -40%90% 76% 729566 53% 15.0% -50% -20% -61% -44%95% 75% 767964 51% 15.5% -54% -23% -66% -48%
100% 75% 806362 49% 19.0% -79% -41% -95% -74%______ __________ __________ _________ ___________________ __________ __________ __________Industry Value Desire Selection Value
% Levels Number %______ __________ __________ _________ ___________________ __________ __________ __________
Individual 0 0% Minimal 1 38%Service 1 50% Workable 2 71%Retail 2 71% Interesting 3 100%Wholesale 3 87% Excellent 4 141%Industrial 4 100% Perfect 5 224%Monopoly 5 112%
12

INDUSTRY RISK FACTOR___________ ___________ ___________ ___________ ___________ ___________ ___________ ___________
Owner Finance % Competition Management Type
0% 0.02 0 -0.93 0 -1.1220% 0.05 1 -0.37 1 -0.8740% 0.12 2 0.00 2 -0.5260% 0.19 3 0.09 3 -0.0380% 0.41 4 0.36 4 0.27
100% 0.58 5 0.52 5 0.41___________ ___________ ___________ ___________ ___________ ___________Location Turnover Type Of Business
0 -0.63 0% -0.37 0 -0.221 0.00 10% -0.23 1 -0.142 0.47 25% 0.00 2 0.003 0.98 45% 0.16 3 0.17
4-5 1.29 65% 0.21 4 0.26___________ ___________ ___________ ___________ ___________ ___________Finance Years Owner Interest % Bank Interest %
0 -0.46 5% 0.66 0% 2.503 -0.20 8% 0.37 3% 1.605 0.10 10% 0.24 5% 0.708 0.20 12% 0.00 7% 0.25
10 0.35 15% -0.22 10% 0.0015 0.46 16% -0.50 12% -0.1420 0.63 17% -1.00 15% -0.2230 0.81 18% -3.20 17% -0.31
100 1.10 19% -3.70 19% -0.45___________ ___________ ___________ ___________ ___________ ___________Consulting Time Number of Employees Net Cash - Salary
0 0.03 0 0.23 $0 0.011 0.09 5 0.17 $30,000 0.082 0.13 11 0.11 $49,000 0.173 0.14 20 0.07 $99,000 0.314 0.16 50 -0.05 $250,000 0.445 0.21 100 -0.12 $999,999 0.49
___________ ___________ ___________ ___________ ___________ ___________Local Economy Labor Market Skills Required
1 -0.38 1 -0.17 1 0.272 0.00 2 0.00 3 -0.093 0.27 3 0.11 5 -0.31
4 0.235 0.31
13

INDUSTRY RISK FACTOR (Continued)___________ ___________ ___________ ___________ ___________ ___________ ___________ ___________
___________ ___________ ___________ ___________ ___________ ___________Union Strength Bank Finance % Years Operating
1 0.00 0% 0.00 0 0.002 -0.37 20% 0.05 1 0.023 -0.43 40% 0.12 2 0.134 -0.45 60% 0.19 5 0.285 -1.31 80% 0.41 10 0.41
100% 0.58 15 0.4620 0.48
100 0.51___________ ___________ ___________ ___________ ___________ ___________Age of Industry National Economy Industry Market
1 -0.71 1 -0.09 1 -0.292 -0.12 2 0.00 2 0.003 0.27 3 0.12 3 0.24
14

WEIGHTED VALUE FORMULAS______________________________________________ _______________________ _____________________
Labor and Workforce Predictability______________________________________________ _______________________ _____________________
Longevity 95% Revenue Growth -1703%Quantity 280% Survival 90%
Recruiting 100% Lease Time 154%Skill 60% Trends 60%
Market 67% Budgeting 80%Union 80%
Average 114% Average -264%______________________________________________ _______________________ _____________________Management Structure Financing______________________________________________ _______________________ _____________________
Family/Partners 50% Percent of Banks 80%Family Percent 91% Collateral Value 60%
Influence 1% Bank Interest 42%Skill 80% Owner Interest 18%
Autonomy 60% Owner Finance 20%
Average 57% Average 38%______________________________________________ _______________________ _____________________Revenue Security Longevity______________________________________________ _______________________ _____________________
Percentage of Cash 0% Desirability 70%Local Trends 150% Trends 133%
National Trends 150% Age 100%
Average 100% Average 101%______________________________________________ _______________________ _____________________Location Competition______________________________________________ _______________________ _____________________
Lease Cost 122% Start Up Time 17%Establishment 570% Knowledge 80%
Location -50% Training 200%Competitors 40%
Average 214% Average 84%______________________________________________ _______________________ _____________________Clientele Stability Liability Exposure______________________________________________ _______________________ _____________________
Accounts 33% Exposure 50%Influence 90% Rates 75%
Trade 60%
Average 61% Average 63%
15

WEIGHTED VALUE FORMULAS (Continued)______________________________________________ _______________________ _____________________
______________________________________________ _______________________ _____________________Market Demand $2,567,500 Economic Demand $2,880,000______________________________________________ _______________________ _____________________
2 $1,630,000 3 $1,630,0004 $1,942,500 5 $1,942,5006 $2,255,000 7 $2,255,0007 $2,567,500 8 $2,567,5008 $2,880,000 9 $2,880,000
16

CORRELATION OF METHODS_______________________________________________________________________________________________
Discussion of Weighting
It is important to note that under guidelines set by "The Uniform Standards of Professional AppraisalPractice" (Standards Rule 9-5), The Internal Revenue Service (Revenue Ruling 59-60), as well as mostappraisal societies, require the appraiser to use all approaches for which reliable data is available andapplicable. The use of as many approaches and methods within these approaches is useful to the extentthat it will establish a range of values for the entity being appraised.
Revenue Ruling 59-60, in Section 3, Approach To Valuation, recognizes that appraising is not an exactscience in the statement that "A sound valuation will be based upon all the relevant facts, but the elementof common sense, informed judgment and reasonableness must enter into the process of weighing thosefacts and determining their aggregate significance".
Sometimes it will be obvious that the analyst should rely on a single approach, such as methods under theCost Approach whereby earnings are insignificant to the value of the assets. An example of this would bea new enterprise with little or no longevity or profits, and projections would be meaningless. Anotherexample would be a company that has longevity, but insignificant profits and would be a candidate forliquidation. In other cases it may be apparent that several methods would be appropriate for the finalvalue conclusion. When this is the case, the appraiser must look to the real world to determine whichmethod or methods should receive the most weighting.
Service companies can represent a significant problem to the appraiser in that there are few assets thatwould give a buyer confidence should the business someday fail. In any case, risk is the most importantfactor to consider in an appraisal. As stated earlier, and acknowledged in Revenue Ruling 59-60, value isbased on anticipated expectations of the buyer as to the performance of the future. In other words, whata company did in the past has no significance to its value if that trend is not anticipated in the future.
Although assets play an important role in risk calculations, one must remember that earnings and theanticipation of an increasing income stream are the overriding factor in the purchase of a business. Notonly through the process of elimination, but an analysis of the methods suggests that methods under theincome approach are clearly the most representative of the current market.
17

Sample Paving & Excavation, Inc.
CLARIFICATION OF VALUE ______________________________________________________________________________________________
The value of the subject company has been stated on the Opinion Letter on page five. This value does notinclude real estate or improvements which are considered Investment Assets. The following additionsshould clarify to the reader of this report the final Opinion of Value for the entity:
Asset Value of Business: Furniture, Fixtures, Equipment and Equipment Equity $435,000 Leasehold Improvements $0 rolling Stock 46,500 Inventory 567,882 License/Patents $0
Adjusted to Percentage of Error, Less adjustment for Fair Market Value of Furniture, Fixtures and Equipment and obsolete or dead inventory $10,618
Total Asset Value of Business $1,060,000
Value of Business: $797,000
TOTAL FAIR MARKET VALUE OF THE BUSINESS: $1,857,000_______________________________________________________________________________
As of March 31, 2006CURRENT ASSETS: As Listed on Recast
Balance Sheet Adjustments Balance SheetPetty Cash $83,561 $83,561Cash - ABC Bank 287,304 287,304Accounts Receivable Employees 17,001 17,001Accounts Receivable Trade 1,539,020 1,539,020Unbilled Work in Progress 362,255 362,255
Total Current Assets $2,289,140 $0 $2,289,140
PROPERTY & EQUIPMENTInventory Material $567,882 $567,882Office Equipment 57,916 57,916Less: Accumulated Depreciation (1) (56,262) 23,479 (32,783)Rolling Stock 205,188 205,188Less: Accumulated Depreciation (1) (145,927) 32,918 (113,009)Shop Equipment 374,529 374,529Less: Accumulated Depreciation (1) (372,842) 303,245 (69,597)Computer Equipment 93,485 93,485Less: Accumulated Depreciation (1) (87,189) 12,000 (75,189)Computer Software 39,424 39,424
18

Sample Paving & Excavation, Inc. As Listed on Recast Balance Sheet Adjustments Balance Sheet
Amortization - Computer Software ($33,071) ($33,071)Leasehold Improvements - Building (2) 221,599 (221,599) 0Less: Accumulated Depreciation (2) (165,581) 165,581 (0)Shop and Repair Facility 63,482 63,482Less: Accumulated Depreciation (1) (63,482) 45,226 (18,256)
Total Property & Equipment $699,150 $360,850 $1,060,000
OTHER ASSETSPrepaid Insurance $16,587 $16,587Prepaid Interest 1,960 1,960Loan Fee Costs 286 286Cash-Surrender Value of Life Insurance (3) 349,526 (349,526) 0Deposits 1,618 1,618
Total Property & Equipment $369,977 ($349,526) $20,452
TOTAL ASSETS $3,358,268 $11,325 $3,369,592
LIABILITIES & EQUITY
CURRENT LIABILITIESAccounts Payable $622,259 $622,259Deposits $379,953 379,953Accrued Salaries 41,344 41,344Notes Payable - Line of Credit 370,940 370,940A/B Notes Payable 21,855 21,855Texas Unemployment Tax 102 102Texas Withholding Tax 5,393 5,393
Total Current Liabilities $1,441,845 $0 $1,441,845
LONG-TERM LIABILITIES:Long Term Notes Payable - Bank $8,141 $8,141Long Term Notes Payable - Insurance Companies (3) 142,848 ($142,848) 0
Total Long-Term Liabilities: $150,989 ($142,848) $8,141
TOTAL LIABILITIES $1,592,834 ($142,848) $1,449,986
EQUITY $1,765,433 $1,919,606
LIABILITIES AND STOCKHOLDERS' EQUITY $3,358,268 $3,369,592
NOTES TO THE BALANCE SHEET(1) Amount needed to bring Equipment, Furniture and Fixtures, Office Equipment and Inventory and Rolling Stock to "Fair Market Value".(2) Buildings and Real Estate are not part of this appraisal.(3) The owner is going to keep the insurance and the notes associated with it, as it is his personal insurance.
19

COMMENTS ON APPRAISALS_______________________________________________________________________________________________
A Business Appraisal is a type of investigation into the law of probabilities with respect to valuation. Through the appraiser's experience, training, and integrity, we are able to project the activities of buyersand sellers in the marketplace into an estimation of value. In reaching a conclusion, comparison ofbusinesses usually involves adjustments due to the individuality and uniqueness of each business. Transactions are often influenced by sentiment, bias, specific needs, politics, familiarity, lack ofunderstanding, and other conditions not considered by the impartial appraiser. The appraiser cannot lendcredence to these possible factors lest he misrepresent the very reason for his profession.
A Business Appraisal is an Opinion of Value that cannot be guaranteed, nor can it be proven. The opinion ofvalue can, however, be substantiated and the final opinion is the result of a thorough professional analysis ofa vast quantity of data. An appraisal must not be considered absolute but should be used as a basis ofnegotiations between concerned parties, whatever their interests.
The appraisal process as followed in the preparation of this report is an orderly procedure for arriving atan estimate of value. By following this procedure the appraiser begins with a preliminary study of theproblem involved and defines the basis from which the Opinion of Value is to be made. A program is theninitiated for the accumulation, analysis, and observation of data. The data called for in the preliminary studyis then gathered, classified and analyzed.
In assignments to estimate Fair Market Value, the ultimate goal of the valuation process is a supportedconclusion that reflects the appraiser's study of all influences on the value of the company being appraised.Therefore, the appraiser studies the business from various applicable viewpoints. Various questions areraised and answered through research of the industry and financial capabilities of the subject business. Some of the questions researched may be found in the supporting data section of this report.
Various approaches are interrelated, and each involves the gathering and analysis of sales, activity, andvalue data in relation to the company being analyzed. From the analysis, the appraiser derives separateindications of value for the company being valued. One or more approaches may be used, depending ontheir applicability to the particular assignment.
To complete the valuation process, the appraiser integrates the information drawn from the marketresearch and analysis of data and from the application of valuation techniques to form a conclusion. Thisconclusion may be an estimate of value or a range in which the value may fall. An effective integrationdepends on an appraiser's skill, experience, and judgment.
With the preceding in mind, the reader's attention is invited to the appraisal report and various exhibitswhich point out the facts and reasoning leading to the final Opinion of Value.
20

COMMENTS ON FAIR MARKET VALUE_______________________________________________________________________________________________
The single most important market factor to impact the value of a business is the supply and demand of anequally desirable substitute that is available in the marketplace. According to the Principle of Substitution,the value of a thing (business) tends to be determined by the cost of acquiring an equally desirablesubstitute. The concept of valuation considering an equally desirable substitute dictates that a buyer willpay no more for a business than what he or she can currently purchase the same or another business oflike kind. This concept is the basis of Fair Market Value and is the overriding methodology in thisevaluation report.
There are only three approaches to determining the value of any asset: the Cost Approach, which basicallyconsiders the cost of purchasing or producing the business, the Market Data Approach which values thebusiness based on current sales in the market place for the same or similar business, and the IncomeApproach which is a mathematical analysis of capitalizing an income stream by a return that best representsthe activity of the current market.
In other types of valuations, mainly real estate, the Market Data Approach indisputably will always yield themost accurate results. It is a true representation of the current market place because it is what the market ispaying for the same or similar asset. However, in the case of a business, using public or private comparablesales price-to-earnings or income-to-sales ratios may be the least reliable for several reasons: no twobusinesses are alike, business sales are not recorded and, therefore, information gathered is usuallysketchy, accounting records are not always standard between the same companies, there is no standarddefinition of "Net Profit" or "Income, Revenue", "Cost of Sales" and many others. Some comparable salesinclude assets that the subject business does not have and these assets are not valued separately, therefore,the appraiser can not make proper adjustments. The Market Data Approach can be very useful whenanalyzing data drawn from the market as to what types of return on investment or data based on multiplesof annual earnings that buyers are willing to pay in order to purchase a certain type of business.
It can be argued that the use of stock prices of publicly-owned companies to estimate the market value ofprivately-held companies is a source of comparable data. However, most business appraisers realize thatto estimate the market value of a privately-held business using this data is seriously flawed in severalrespects:
1. Publicly-held companies whose stock is listed on the major exchanges are usually much larger than closely-held businesses that are being appraised. This difference in size raises serious questions as to whether the two are, in fact, comparable.
2. Prices of publicly-traded stock always reflect the sale of a very small fractional ownership interests. On the other hand, the appraiser's objective is usually to estimate the market value of a major ownership interest, frequently, one hundred percent ownership of the closely-held business.
3. The above must be selected by the appraiser through a process that amounts to little more than guess work, and thus cannot be relied upon.
4. The price-to-earnings ratio represents the ratio of a current stock to an earnings-per-share figure that can be from a few weeks to several months old.
21

5. Probably the greatest fallacy of attempting to use publicly-traded stock prices to estimate the value of a closely-held business lies in the psychology of the investor. The potential buyer for a closely-held business is almost always concerned with the anticipated performance of the business itself. Of course, it is sometimes argued that the trend of stock prices of a publicly-held company is strongly influenced by the company's performance. However, it is demonstrable that, whereas this does tend to be true in the long run, there are many influences on stock that tend to be of short-term nature,
and that strongly influence stock prices while bearing relatively little long-term relationship to thecompany's fortunes. This is not recommended as a means of estimating the value of closely-heldbusinesses.
Still another source of Market Data is, of course, information on actual sales of companies, such as thesubject, in the appraiser's local community. It is unlikely, however, that there will be enough informationavailable on sales similar to the subject to provide statistically sound basis for estimating market value. However, as mentioned above, when analysis based on research on potential buyers for this kind ofinvestment is made, important insight into what a buyer is willing to pay for a particular business can assistthe appraiser in determining an accurate opinion of value. Please keep in mind that this analysis mustinclude such factors as industry risk, the local and national economy, competition, ease of entry into theindustry and the company's portrayal of future performance and the length of time it will last that thebuyer can reasonably expect to receive after acquisition.
In conclusion, on the subject of the Market Data Approach for closely-held businesses, while we mayinclude information or make comments on similar business sales that might have reciprocity in valuationtechniques, the lack of enough market data from public or private sales based solely on price-to-earningsand income to selling price may make this technique unsound and may eliminate the use of the MarketData Approach in this valuation.
In the Cost Approach, the cost of an item is rarely what its selling price or value may be and in many casespriceis not the value. This is especially true in a rapidly changing market which is highly affected by technological changes or variances in supply and demand or especially a company that is very youngand has not yet established enough longevity to make a confident analysis of the future performance.
Also, in the case of a business, all serious practitioners of business valuation agree that book value is notnecessarily an adequate proxy for representing the underlying net asset of a business for valuationpurposes, much less for representing the value of the business itself. However, book value is a figurethat is available for almost all businesses. Furthermore, it is a value that different businesses have arrivedat by some more or less common set of rules, usually some variation within the scope of generallyaccepted accounting principles (GAAP). Also, each asset or liability number that is a component of bookvalue as shown in the financial statements represents a specific set of obligations that can be identified indetail by referring to the company's records, assuming that the bookkeeping is complete and accurate.Therefore, book value usually provides the most convenient starting point for an asset valueapproach to the valuation of a business interest.
The nature and extent of adjustments that should be made to book value for the business valuationdepend on many factors. One, of course, is the valuation's purpose, another which is frequently alimiting factor, is the availability of reliable data on which to base the adjustments both for the subjectcompany and for other companies which might be compared in the course of the valuation.
Another concept for fixed assets is "Value in Use". The value of the operating assets to the owner/useror buyer who will use them in a similar manner is the value that includes consideration for the uniquerelationship of the item to a particular business such as the subject.
22

There is a value for an item which is already in place and is ready to use. The value might be the item'sretail price, plus applicable taxes, freight, and installation charges. The summation of these costs, afterproper deductions for depreciation and obsolescence is the "Value in Use" of that item. This value maybe different from its Fair Market Value to a buyer who will not use the equipment at its presentlocation. A definition for "Value in Use" is as follows:
"The value of an economic good to its owner/user is based on the production (privacies in income, utility oramenity form) of the economic good to a specific individual. This is a subjective value, however, and maynot necessarily represent the market value."
We, therefore, have to subjectively estimate the "Value in Use" of the subject's assets based on pastexperience with assets of a similar nature.
The Income Approach is especially meaningful if the assets are used to produce income, such as in thevaluation of a business. However, it still takes root from the Market Data Approach because it is an analysisof what the current market is paying by determining a comparable return that can be capitalized into acomparable purchase price.
In this report you will find as many methods, under each approach, as is reasonably applicable to valuingthe subject business. In order to arrive at a supportable value, we have chosen those methods that wouldbest apply to the purchase of the subject business as reflected by the marketplace.
The Internal Revenue Service established Revenue Ruling 59-60 as the standard for the valuation ofclosely-held companies. The following summarize the key factors to consider:
A. History and Nature of the Business
B. Economic Outlook
C. Book Value
D. Earning Capacity of the Enterprise
E. Dividend Paying Capacity of the Enterprise
F. Goodwill and Intangible Assets
G. Recent Sales of Stocks
H. Market Value of Comparable Companies
23

COMMENTS ON CERTIFICATION_______________________________________________________________________________________________
Although stated earlier with clarification, this report is a departure from the appraisal guidelines and in ouropinion must be recognized and clarified further for the reader of this report.
The term certified appraiser or certified appraisal used in this report refers to the certifications held by theappraiser who has completed this appraisal report. The appraiser has earned the various designationsfrom recognized appraisal and consulting societies, organizations and instructional institutions. Certifications are granted based on meeting strict guidelines for education, experience, examinations anddemonstrating high levels of expertise. Each certification carries with it high levels of professional ethicsand standards.
As a result of various new state and federal legislation, appraisal practice has become a regulated industryrequiring certain appraisers to become state certified by 12/31/92. This appraisal is for business valuationand does not require a state certification, nor is there one available at this time. The state of Texas and theFederal Appraisal Foundation have not developed a state certified or licensing application or examinationto meet the new laws at this time. HB270 specifies the new standards required for certified appraisals, andthe standards in this report meet federal guidelines.
Although neither the state nor federal government has required the new appraisal standards to becomeeffective for business valuation, we have completed this appraisal consistent with the state and federalguidelines for state certified or licensed appraisals. Business Evaluation Systems appraisals have met orexceeded the standards as set forth by the state and federal governments.
Further, comments concerning appraiser certifications or licensing are not required as part of appraisals. We have chosen to include these brief comments in our appraisal to assure the reader of this report that weunderstand and are in compliance with existing state and federal laws concerning appraisals.
It should be further noted that Business Evaluation Systems appraisers have exceeded therequired experience and education requirements and await the development and approval of thestate examination.
Please refer to the appraiser's qualifications exhibit to this report for additional information.
Business Evaluation Systems appraisers have earned the following professional designations:
* BCBA - Board Certified in Business Appraisal (National Society of Appraiser Specialists)* CBC - Certified Business Counselor (Institute of Certified Business Counselors)* SBA - Senior Business Analyst (Society of Business Analysts)* AAR - Accredited in Appraisal Review ( Accredited Review Appraisers Council)* CEI - Certified Environmental Inspector (Environmental Assessment Association)* BCB - Board Certified Broker (Texas Association of Business Brokers)* FCBI - "Fellow" Certified Business Intermediary (International Business Brokers Association) * SPTC - State Property Tax Consultant (Texas Department of Licensing and Regulations)* CFEA - Certified Farm Equipment Appraiser (American Society of Farm Equipment Appraisers)* CREA - Certified Real Estate Appraiser (National Association of Real Estate Appraisers)* LREB - Licensed Real Estate Broker (Texas and Nevada)* CMEA - Certified Machinery and Equipment Appraiser (Institute of National Equipment and Business Brokers)
24

CONFIDENTIALITY AGREEMENT_______________________________________________________________________________________________
Agreement and acknowledgment between the client ordering this document and Business EvaluationSystems (undersigned).
Whereas, the client agrees to furnish the undersigned certain confidential information relating to theaffairs of the client for purposes of evaluation, consulting, or related analysis:
Whereas, the undersigned agrees to review, examine, inspect, or obtain such information only for thepurposes intended and to otherwise hold such information confidential pursuant to the terms of thisagreement:
Be it known that the client has or shall furnish to the undersigned certain confidential information asrequired and may further allow the undersigned or his field representative to inspect the business of theclient and interview representatives of the clients on the following conditions:
1. The undersigned agrees to hold all confidential or proprietary information to trade secrets("information") in trust and confidence and agrees that it shall be used only for the contemplatedpurpose, shall not be used for any other purpose or disclosed to any third party.
2. At the conclusion of our discussions and upon demand by the client, all information, includingphotographs, memoranda, or written notes shall be returned to the client.
3. This information shall not be disclosed to any employee or consultant unless they agree to executeand be bound by the terms of this agreement.
4. It is understood that the undersigned shall have no obligation with respect to any informationknown by the undersigned or generally known within the industry prior to the date of thisagreement, or becomes common knowledge within the industry thereafter.
Dated:July 4, 2006
George D. AbrahamBCBA,CMEA,FCBI,SBA,BCB,AAR,CEI,SPTC,CFEA
P.O. Box 1262Dickinson, Texas 77539
(281) 337-3508FAX: (281) 534-3785
25

INTRODUCTION
I. CLIENT DATA
Mr. James G. SampleSample Paving & Excavation, Inc.222 Westheimer St.Houston, Texas 77539
II. AUTHORIZATION
Client verification and authority given to our field technician, ordering this report.
III. NATURE OF ASSIGNMENT
Determine the estimated Fair Market Value of Sample Paving & Excavation, Inc., based on a stock sale (hereinafter sometimes referred to as the "business") located in Houston, Texas.
Utilize Business Evaluation Systems national data information, exclusive to Business EvaluationSystems, and market research to prepare an opinion of value report based on resulting data andknowledge. Assumptions and limiting conditions are stated in the exhibits to the evaluation report.
IV. PURPOSE OF EVALUATION
The purpose of this report is to provide the client with an opinion of Fair Market Value for thepurpose of contemplation of sale.
V. DEFINITION OF VALUE
Fair Market Value is the price, in cash or equivalent, that a buyer could reasonably be expectedto pay, and a seller could reasonably be expected to accept, if the property were exposed for saleon the open market for a reasonable period of time, both buyer and seller being in possession ofthe pertinent facts and neither being under compulsion to act.
VI. OWNERSHIP
Ownership or title to the business and equipment appraised was not a consideration of thisassignment; it was assumed that the business appraised was the property of Sample Paving & Excavation, Inc., free and clear.
VII. ADDITIONAL INFORMATION CONTACT
For additional information, contact Mr. James G. Sample, the client. Do not contact the appraiserwithout written authorization from the client. All information contained in this report is confidential.
VIII. LOCATION OF THE BUSINESS
At the time of the evaluation, the business was located at 222 Westheimer St., Houston, TX 77539
26

IX. DOCUMENTS REVIEWED BY FIELD TECHNICIAN Financial Statements for the years 2002, 2003, 2004, and 2005 Internal Financials for the period ending March 31, 2006 Balance Sheet as of March 31, 2006 Equipment and Inventory lists X. INTERVIEWS Interviews were conducted by the field technician and furnished to Business Evaluation Systems using our forms and questionnaires. XI. ENVIRONMENTAL CONCERNS Business Evaluation Systems has made no inspections of the premises, expresses no opinions and has received no information that an environmental concern exists. XII. EVALUATION EFFECTIVE DATE
Values state are effective as of March 31, 2006. Any difference between the date this report ispresented and the effective date could have a bearing on the value opinion stated.
XIII. WHAT IS VALUED IN THIS REPORT
Business Evaluation Systems was asked to value the subject company, including all assets of thebusiness, both tangible and intangible.
1. Sample Paving & Excavation, Inc., is the valued entity and owned by its shareholders.Please refer to the Questionnaire Section of this report for a more detailed analysis ofassets, included in the valuation.
2. Rolling Stock has not been valued but is INCLUDED in this valuation.
3. Liabilities have NOT been valued and are INCLUDED in this valuation.
4. Tangible assets have NOT been valued but are INCLUDED in this valuation.
5. Intangible assets are valued and INCLUDED even though they may not be shown on thecompany's balance sheet.
6. Accounts Receivable have NOT been valued but are INCLUDED in the valuation report.
7. Real Estate and Improvements have NOT been valued by Business Evaluation Systems andare NOT INCLUDED in this report.
8. Documents listed as reviewed above have NOT been reviewed or analyzed by BusinessEvaluation Systems and any values derived from such documents or reports may be includedin this report. We have relied on the expertise of the company's financial advisors supplyingthis information to the field technician for any values used.
27

APPRAISER'S CERTIFICATION_______________________________________________________________________________________________
I HEREBY CERTIFY TO THE BEST OF MY KNOWLEDGE AND BELIEF:
1. That the statements of fact contained in this report are believed to be true and correct.
2. That the reported analysis, opinions, and conclusions are limited only by the reportedassumptions and limiting conditions, and are my personal, unbiased professional analysis,opinions, and conclusions.
3. That I have no present or prospective interest in the property that is the subject of thisreport, and I have no personal interest or bias with respect to the parties involved.
4. That my compensation is not contingent upon the reporting of a predetermined value ordirection in value that favors the cause of the client, the amount of the value estimate, theattainment of a stipulated result, or the occurrence of a subsequent event.
5. That my analysis, opinions, and conclusions were developed, and this report has beenprepared in conformity with the Uniform Standards of Professional Appraisal Practice. Departure provisions are stated in another section of this report.
6. That I have not made a personal inspection of the property that is the subject of thisreport and am relying on information provided by the field technician and the client.
7. That no one provided significant professional assistance to the person(s) signing this reportother than the field representative gathering the information for our questionnaire.
8. That this opinion of value has been performed in accordance with the code of ethics ofthe associations of which I am a member.
9. That it is my opinion that the value of the property valued is as stated in this report.
10. That the fair market value of the subject business, including all assets and reflectingmarket conditions as stated in the report on the effective date is:
$2,696,154
Date:July 4, 2006
George D. AbrahamBCBA,CMEA,FCBI,SBA,BCB,AAR,CEI,SPTC,CFEA
28

REQUIRED RATES OF RETURN - FORMING A CAPITALIZATION RATE_______________________________________________________________________________________________
To an investor, when we speak of return and rate of return, we are referring to the totalyield to the investor, reflecting all dividends, interest, or cash equivalents received, plusor minus any realized or unrealized appreciation or depreciation in the investment'svalue. Capitalizing, for which a capitalization rate is used, is a process applied to anamount representing some measure of economic income for some single period toconvert that economic income amount to an estimate of present value.
Capitalizing procedures can be used with expected, current, historical, or "normalized"(or "stabilized") measures of economic income. If growth is expected from the baselevel of economic income being capitalized, then that expected growth is reflected inthe capitalization rate.
Business Evaluation Systems has, since 1983, monitored these rates of return andcapitalization rates for almost every type of business imaginable from hundreds ofcompanies involved in the business transfer industry all across America. These are ratesthat the business transfer industry reports are required to stimulate the purchase of abusiness. Business Evaluation Systems has the largest database of theserequired rates of return in the country. Also, there are probably more theories oncapitalization rates than any other subject in valuation. With this in mind, pleaseunderstand that this discussion will leave many methods unmentioned.
The first thing to remember is that we are going to keep this brief and fairly simple. A capitalization rate (Cap Rate) can be looked at in three different ways: (1) a multiple ofearnings, (2) a percent rate of return or (3) the time by which a buyer would demand topay off the business or get his or her money back. With this in mind there are twomethods that I think most of us would agree on. The high and the low capitalizationrates for a business. The low range for a normal and profitable business is usually oneyear net profit plus the value of the assets. Most owners will make it clear that they willjust run the company for another year and then sell the assets.
The highest price is a multiple of earnings that after management compensation and debtservice is less than a money market fund. This is also logical because the buyer couldjust go to work for that company or another company and keep his or her money in asafe fund and not take the risk.
With this is mind, let's look at multiples, keeping in mind the three ways to view them. The following diagram should help:
The following diagram can be used to extrapolate a Cap Rate by years to pay off thebusiness or a multiples of earnings:
1______2______3______4______5Cap Rates or Risk Factors100% 50% 33.3% 25% 20%
29

REQUIRED RATES OF RETURN - FORMING A CAPITALIZATION RATE_______________________________________________________________________________________________
It can also be used to rate the company by looking at several areas within the companyas well as outside factors which could affect the company's future performance.
These multiples can usually mean the following:
1=100% = Drastic Outlook2=50% = Unstable Future3=33.3% = Normal4=25% = Better than normal5 =20% = Excellent, hardly any risk
Of course this is an extremely simple model but should be one of the basis of the appraiser'sassumptions. Also, realize that some industries are tempered with highly advantageoustechnological future changes. Also, some are much more desirable and have morestatus to own than others (i.e. a bank). The following risk topics (there are many more)should be researched and assigned a quantitative level of importance to the overallmodel for the above multiples:
LaborThere are many key factors to look at as far as labor is concerned. Are employees hardto find? Will key employees stay? Are they due a significant salary increase? Whateducational skills or level is required and is the labor pool such that they could be replaced?
ManagementWill management stay? What is the average age of key management? Hasmanagement been efficient?
Financial StrengthIs the company financially solid or do they have cash flow problems?
Facilities and LocationWhat is the length of the lease? Is it likely to increase? Are the facilities sufficient forthe business and possible expansion? What about the company's location? Are anymajor roadways or changes in the area likely to affect the company?
Diversity of AccountsIf the company loses one or two accounts will they be out of business? Will theaccounts stay with a new owner?
CompetitionHow strong is competition? What is the level of ease of entry into this industry? Aretechnological changes going to give a major competitor with more cash a significantadvantage?
30

REQUIRED RATES OF RETURN - FORMING A CAPITALIZATION RATE_______________________________________________________________________________________________
PredictabilityWhat has the historical financial picture shown? What would it tell a buyer as to what heor she can expect in the future?
MarketabilityHow hard would it be to sell this company? How many buyers would be interested inthis type of business?
Future OutlookAlways remember that a business is bought on the assumption of its economic benefit toits new owner. The more stable the financial future as well as other factors like technologicalchanges, environmental regulations, and public attitude affect a buyer emotionally. Thisrelates to how long the buyer is willing to risk his or her money and, therefore, how fast he or shewould expect it back and thus affecting the multiple of earnings they are willing to pay.
An illustration of this method, using a hypothetical company and assigning the multiplesabove would be as follows:
Topics: Rating:Labor 2Management 4Financial Strength 4Facilities and Location 2Diversity of Accounts 2Competition 3Predictability 4Marketability 2Future Outlook 4
____Total 27Divided by 9 topics = 3This would equal a 33.3% Cap Rate (i.e. Discretionary Cash Flow divided by 33.3% = Value of Company).
Several of the Interview Questions will also give us the data to form a Cap Rate.For instance, questions 17 and 18 ask:"What would be the minimum and maximum rates of return a buyer would expect toassume this risk?" When the Field Representative answers these questions, he is telling us hisviews on the Cap Rate. For example, if the Field Representative reports that the rates of return forQuestions 17 and 18 are 25% to 33%, we can then begin to formulate a Cap Rate. Byusing the example on page 20, a 25% rate would, of course, be a Cap Rate, but would also mean that abuyer in his (the Field Representative) area would not pay more than a multiple of four times earnings.
Therefore, we would know that a buyer, for this kind of business, in this part of thecountry, would not pay more than three to four times earnings and the Cap Rates would be25% to 33%.
31
REQUIRED RATES OF RETURN - FORMING A CAPITALIZATION RATE_______________________________________________________________________________________________
Other questions that help us build a Cap Rate are questions 42 and 43 which ask:"What are the shortest and longest number of years a buyer would expect to repay initialloans?" If the Field Representative reports three to five years, then we are confirming that the buyerwants his money back in three (33.3% Cap) to five (20% Cap) years or the buyer will not paymore than three to a five multiple of earnings.
By using a comparison by required rates of return from the business transfer industry is,in our opinion, a pure ratio that requires very little adjustment. In simple terms, these arethe rates of return that are required for a business in a particular industry to sell, or thereturn that would cause a purchaser to buy this type business. This data is reported toBusiness Evaluation Systems by individuals and companies that have sold businesses foryears and deal with hundreds of buyers per year.
A business appraisal, by definition is the value of a business at a specific pointin time. Therefore, current market information is imperative and the appraiser can notrely on sales that are from a different and out-dated period in a different area of thecountry. Our database is always current and reflects all necessary information to make theproper adjustments (for that particular area of the country) because the informationreported includes everything about each business including size, exact location, realestate, asset size, how long the company has been in business, financial statements,historical profitability and the reason behind the decision to sell.
32

PRINCIPLES OF EVALUATION_______________________________________________________________________________________________
In theory, all formula calculations are simple.
Actually calculating logical financial formulas is generally simple because most of the input valuesoriginate as dollar amounts or other numerical data and can be graphically displayed as a linear curve.
However, formulas based on the emotional factors which influence a buyer are more difficult to calculatebecause feelings and desires must translate into numerical values. These values can only be manipulatedby extremely complicated mathematical functions. The graphic display of these functional relationshipsgenerally resembles standard distribution, parabolic curves.
This evaluation report has overcome the two most difficult factors: gathering the emotional data andquantifying the emotional data.
1. The first difficulty encountered when using emotionally based formulas is the gathering ofdata. The report model requires numerical data. Unfortunately, feelings and desires aregenerally expressed by actions and words.
2. To convert the qualitative emotions into quantitative data, a series of questions were designedto set up an emotional environment with a finite number of choices. Each choice is numberedand has a specific set of criteria which must be met.
3. The second major difficulty encountered was quantifying emotions through a series offormulas. Most formulas are not clearly defined with standard levels of criteria; therebyallowing the evaluator latitude in responding, based on current market conditions and theeffect they have on values. The questions and explanations in this report are rigidly wordedrequiring fewer judgments by the appraiser.
The emotional choices which might elude the evaluator can be narrowed, because bydefinition they fall into two categories: environmental and situational.
For example, consider an interest rate. An interest rate of 12% is desirable when otheravailable rates are higher but undesirable when other available rates are less. Additionally,interest rates have an absolute demand ceiling and an absolute floor. The ceiling is based onthe history and duration of high rates and the floor is dictated by the IRS.
33

EVALUATION MODELS_______________________________________________________________________________________________
A businesses value can actually be divided into five parts:A. Market value of assetsB. Historical trends of revenues, expenses and cash flowsC. The value of rights, privileges, and knowledgeD. Estimated stability in the futureE. Esthetic appeal
This evaluation report addresses all five parts of a business' value through a series of questionswhich define each of these aspects numerically. The computer manipulates the statistics and calculates asuggested price based on the most widely accepted mathematical models.
Not every method will necessarily be used in the appraisal report. The methods used in this report aredescribed below:
ASSET VALUE_______________________________________________________________________________________________
The Asset Value Method is used to determine a minimum value range for a business. That valuerepresents the estimated worth of all tangible and intangible assets.
Asset value must not be determined solely on the basis of book value or an asset's worth in itscurrent application but rather replacement value including all installation and testing costs.
Upper $1,150,000Lower $940,000
BASIC VALUE METHOD_______________________________________________________________________________________________
This method is based on two pricing formulas.
The first formula is a "rule of thumb" multiplier; one year's net cash flow plus assets at currentmarket value. The second formula begins with the current market value of assets and to this adds amultiple of the monthly discretionary income based on the number of months required to start asimilar business and bring it to a break even cash flow position.
Upper $3,070,000Lower $1,330,000
CAPITALIZATION METHOD (RETURN ON INVESTMENT)_______________________________________________________________________________________________
This method is based on a simple mathematical model which calculates a total investment based ondiscretionary cash flow divided by a rate of return associated with the level of risk.
Upper $1,790,000Lower $1,670,000
34

EVALUATION MODELS_______________________________________________________________________________________________
CRITICAL FACTORS METHOD_______________________________________________________________________________________________ This method takes into account the critical factors which will encourage or discourage a potential buyerprior to any in-depth investigation into this business. The various factors comprising this method are: 1. Percent of Down Payment This factor is based on the common belief that lending institutions generally require 20% of the total purchase price as a down payment. This factor also considers the relativity of dollars in down payment to profits. 2. Dollars of Down Payment This factor relates the absolute dollars required as a down payment to the potential number of qualified buyers with that volume of cash or other liquid assets. The larger the cash down payment the fewer qualified buyers will be available, thereby, limiting the demand and, consequently, reducing the emotional dollar value of a suggested price. 3. Interest Rate, Interest Type and Term of Years This factor relates the various loan types, loan terms and interest rates as offered to a potential buyer by the owner and any other available lending institution to the propensity of a buyer to purchase this business. 4. Industry This factor weighs the possibility of market saturation, currently predicted survival for an established business and the future stability of profits. 5. Desire This factor quantifies the emotional motivation to buy based on status, visual appeal, profitability, risk and skills required. 6. Lease This factor determines sufficient time available to repay loans and earn a reasonable return, a rate comparable to similar available spaces. 7. Utility This factor examines the alternative use of the land and buildings for sale. 8. Accounts This factor places value on the collectability of accounts receivable and the security of the clientele base. Upper $4,300,000 Lower $1,856,000
35

EVALUATION MODELS_______________________________________________________________________________________________
DEBT CAPACITY METHOD_______________________________________________________________________________________________
This method of evaluation is purely a mathematical financial model. Direct business cash expensesare deducted from direct business cash revenues to determine discretionary cash flow.Deductions are then made for an operator's salary and the real depreciation cost of assets. Theresult is discretionary cash for debt service.
A present value table will calculate the future value of a series of payments. The figure generatedis the debt service this business could handle given the current level of discretionary cash.
Most evaluators agree that any future increases in revenues while under the management of anew owner belong to that new owner. If the previous owner had generated more revenue thesuggested price would reflect this.
Upper $2,150,000Lower $1,520,000
COMPARABLE SALES METHOD_______________________________________________________________________________________________
This method is based on ratios generated by actual sales found in the specific industry.
The ratios used for the subject company are usually a price to earnings ratio or can be arevenue to selling price ratio. In determining the most meaningfull ratio, the appraiser must takeinto consideration the date of sale, location, comparable size of the sales researched.
Upper $2,700,000Lower $1,380,000
INDUSTRY RISK FACTOR METHOD_______________________________________________________________________________________________
This method is based on a series of weighted factors which resemble many of the functionspreviously used in the weighted and critical factors methods. However, in spite of oversimplification and the inability of the functions to shift with changing economic conditions, theseformulas have been included because they are routinely used as part of a curriculum for thepotential buyers.
These formulas are generally of a hyperbolic or parabolic nature but in actual use are staticbecause the mathematics required to adjust these curves for the dynamics of an economy wouldbe impossible to complete manually.
36

EVALUATION MODELS_______________________________________________________________________________________________
INDUSTRY RISK FACTOR METHOD (continued)_______________________________________________________________________________________________
The following are actual computed categories:
Finance YearsThis factor assumes the greater the loan period, the more a buyer will pay.
Financing RateThis factor considers interest rates and types. It decreases the amount payable to a selleras the cost of doing business, interest cost, etc., increases.
Years OperatingThis factor assumes each year of survival indicates a greater chance of future survival andpays for years survived to date.
Consulting TimeThis factor pays for education time from a seller.
Employees This factor pays less for more employees assuming a larger work force creates labor problems.
Net CashThe greater a businesses discretionary cash, the more a buyer should be willing to pay.
Local EconomyThe better the economy the greater the security of future revenues and demand so theprice will be higher.
Labor Market This factor assumes labor is a major cost and if the labor market is soft for this business, labor cost will not rise as quickly and profitability is more likely. The converse is also
assumed true.
This factor also assumes if a business requires a high level of skills it is a higher risk andworth less to a potential buyer.
Union StrengthThis factor analyzes how an outside organization can control your business. The lesscontrol the owner has the less a person should pay.
Age of IndustryThis factor pays for stability and longevity in proportion to an industry's age.
37

EVALUATION MODELS_______________________________________________________________________________________________
INDUSTRY RISK FACTOR METHOD (continued)_______________________________________________________________________________________________
National EconomyThis factor assumes a growing economy increases demand and prices. Conversely, adeclining economy decreases demand for a particular business and its price.
Industry MarketThis factor looks at the future markets for the products or services of this company andindustry. The security or risk assigned to the future will directly raise or lower anysuggested price.
Upper $1,790,000Lower $1,580,000
WEIGHTED FACTORS OR EMOTIONAL FACTORING_______________________________________________________________________________________________
Emotionally motivated choices can be displayed mathematically through the use of parabolic andhyperbolic functions. These functions seem to simulate how emotions relate current conditions toabsolute conditions.
The following factors comprise the key factors which will be functionalized:
The target value is based on the highest potential value of assets plus the discretionary cash flowmultiplied by a function based on the learning curve for this type of business and the currentdemand for this industry and business. The target value represents the maximum possible price abuyer would pay given a business at this scale of operations and profit level. Each factor adds ordeducts from the target value to arrive at a suggested price.
Each of the following factors generate a functional curve:
1. LaborThis factor weighs the stability of a company's labor force and the changes which may reduceprofits under a new owner.
2. PredictabilityThis factor reviews historical and current trends for the local and national economic trends. Thesetrends are applied to this particular company's performance and a factor of reliability is generated.
3. ManagementThis factor estimates the integrity of the current management system and how changes ofownership will impact this system.
38

EVALUATION MODELS_______________________________________________________________________________________________
WEIGHTED FACTORS OR EMOTIONAL FACTORING (continued)_______________________________________________________________________________________________4. Competition
This factor weighs the possibility of a new owner going out of business because of a saturatedmarket.
5. RevenuesThe past and present problems of collecting revenues will probably remain unchanged.
6. LongevityThe number of years a business entity has survived and grown is usually proportional to theconfidence level for future survival.
This factor balances lease rates, years at this location, and the utility of this location for thisbusiness against current and potential competitive locations.
7. Loanability
This factor weighs this company's ability, based on its own assets, to acquire funding from lenders.
8. ClienteleThis factor weighs the stability of clients and future expectations for revenue from those clientsafter a management change.
9. LiabilityThis factor weighs the hazard level of this business and how easily a bankruptcy situation couldoccur.
Upper $1,250,000Lower $750,000
MULTIPLE OR AVERAGE VALUE METHOD_______________________________________________________________________________________________
This method is the average of all of the previously described formulas based on theory that a"reasonable" buyer will use more than one of the previous formulas. An average value derived from allof the formulas should represent the actions of a "reasonable" buyer.
Upper $2,880,000Lower $1,630,000
39

EVALUATION MODELS_______________________________________________________________________________________________
CONCLUSIONS_______________________________________________________________________________________________All of the formulas described above are calculated and displayed in price ranges with a maximum andminimum level because the input data is based on estimates.
UPPER RANGE PRICING
The pricing range essentially represents the seller's optimistic view of his business given currentmarket constraints.
Upper $1,860,000
LOWER RANGE PRICING
This range represents the buyer who is primarily concerned with financial rewards and will buy abusiness based on conservative financial estimates.
Lower $1,640,000
SUGGESTED PRICE RANGE
This is the conclusive price range calculated by this report based on a consensus of opinion andevaluation methods.
The "SUGGESTED PRICE" range is based on the "MULTIPLE AVERAGE" but occasionallydiffers for a variety of reasons.
The first factor which will cause a variation comes from a business which does not fulfill all thebasic premises assumed by all of the mathematical formulas. If too many negative factors arecalculated and factored through the many functional models, almost bizarre results are produced.These results are discounted by the functions which control the "SUGGESTED PRICE" range.
The second factor causing a differential is the methods used to market a business for sale.
The third factor is the accuracy of input data. If the data used is not researched and documentedthe report will generate a suggested total price range which is wide and often unrepresentative.
SUGGESTED PRICE $1,857,000
40

SUPPORTING DATA SECTION
41

Sample Paving & Excavation, Inc.Interview Questionnaire and General Assumption by the Appraiser
1. Using the past 12 months (or normalized) profit/loss statement, add back all non-cash expenses, owner draws and benefits, one time or unusual expenses, and non-essential expenses. (Please see page 49 for details.) $512,132 2. What would an absentee owner have to pay a manager annually, including all
benefits and bonuses, to run this business profitably? If the business is currentlypaying management and the owner is absentee, use $0.00 as the answer. $80,000
3. How much cash do you expect as a down payment? 20%
4. What is the current market value of owned equipment and fixtures? $435,000
5. What is the current market value of your work in leasehold improvements? $0
6. What is the market value of included rolling stock? $46,500
7. What is the average daily value of inventory, supplies or merchandise forconsumption or resale? $567,882
8. What will be the cost per square foot per month, including all relatedfees, on the average over the next three years? $0.37
9. Give the current lease rate per foot for a similar space down the street on thesame side of the street. $0.45
10. Give the current lease rate per foot for a similar space on the other side of thestreet. $0.46
11. If any leased/purchase equipment can be transferred, what is the differencebetween market value and current payoff? $0
12. What is the current market value of any transferable licenses, rights orpatents that will be sold with this business? $0
13. What was this company's gross revenue over the past 12 months? $5,347,654
14. What was this company's gross revenue for your past fiscal year? $4,832,943
15. What was the gross revenue for two fiscal years ago? If not available, then use$0.00. $7,108,450
16. How many direct or indirect competitors have survived the past four years? 90%
42

Sample Paving & Excavation, Inc.Interview Questionnaire and General Assumption by the Appraiser
17. What would be the minimum rate of annual return a buyer would require toassume this risk? 21.5%
18. What would be the maximum annual rate of return a buyer would expect toassume this risk? 23%
19. In collecting data, how sure are you of accuracy? Apply a percentage of ERROR. 10%
20. If you took a professionally prepared loan package based on thisbusiness and its assets to local banks, what percentage of those bankswould commit to a loan based solely on this business and its assets? 80%
21. As you review the past 12 months, what percent of total revenues came inas cash? 0%
22. Given the current state of leasehold improvements and equipment, whatpercent will need to be replaced each year to maintain a good image andrun efficiently? 10%
23. Assuming the owner has a sales price and down payment in mind, whatpercent down would be required to buy this business? 20%
24. Given the current market value of these assets, what percent of that marketvalue would a banker consider as collateral value? 60%
25. What percentage of supplies or inventory for resale would be consideredby an expert as dead or obsolete? 2%
26. What percent of the workforce has been with the company more than twoyears? 95%
27. What is the average inflation rate for the past three years? 1.1%
28. What percent of the total price asked by the owner will be owner financed? 20%
29. On the owner financing, what type of interest rate will the seller offer? If no ownerfinancing is offered, use bank financing rate. 1= Fixed Rate, 2=Variable Rate. 1
30. On owner financing, what fixed rate of interest is the seller offering? (If no financing is offered,enter current bank fixed rate.) 9.5%
31. What is the percentage over or under the current prime rate the seller will takeon owner financing if owner financing uses a variable rate loan? 2%
32. What percent of the total price asked by the owner will be BANK financed? 60%
43

Sample Paving & Excavation, Inc.Interview Questionnaire and General Assumption by the Appraiser
33. When securing bank financing, what type of interest rate will a purchaser mostlikely secure? 1=Fixed Rate, 2=Variable Rate. 1
34. As of the effective date, what is the current bank interest rate for small business loans? 9.5%
35. What is the percentage over prime currently being offered by banks onvariable rate loans of this kind? 2%
36. What is the current prime interest rate as of the effective date? 7.5%
37. How many years has this company been in business? 57
38. How many family members, relatives and/or partners, including the owner,are actively working in this business? 3
39. How many different accounts does this company sell or provide a service to? 200
40. Using only the largest trade accounts, rate the accounts in relation to total accounts:1=One account equals 25% of business, 5=Very many accounts equal 25%. 3
41. At the time of sale, how many years will the buyer have guaranteed under leaseand lease options to conduct business? 10
42. What is the SHORTEST number of years a buyer would expect to repay initialloans? 5
43. What is the LONGEST number of years a buyer would expect to repay initialloans? 8
44. What is the average age of the facilities and equipment? 10
45. Given an individual with reasonable skills and little direct knowledge of thisbusiness, how long would it take to functionally learn this business? Apply anumber: 1=Hours, 2=Days, 3=Weeks, 4=Months, and 5=Years. 4
46. When starting a business at this scale, how many months would it take to show thiskind of profit after deducting a reasonable salary for yourself or a manager? 60
47. Give the total number of full time employees? 35
48. Give the total number of part-time employees? 0
49. How much owner training time (weeks) would be given to a buyer at no charge? 8
50. How secure are revenues? Apply a number: 1=Open accounts with no security,5=Cash only at point of sale. 4
44

Sample Paving & Excavation, Inc.Interview Questionnaire and General Assumption by the Appraiser
51. How many direct competitors are in this company's trade area? Apply anumber: 1=Many or next door, 5=None. 3
52. When on vacation, how often does the owner call in? Apply a number:1=Couple daily, 3=Few per week, 5=Never. 3
53. How did this company find its last few employees? Apply a number:1=Union, 3=Newspaper, 5=Referrals. 3
54. What amount of training is required to understand and perform most phases ofthis company's operations? Apply a number: 1=Days, 5=Professional Certification. 3
55. What is your liability exposure level? Apply a number: 1=None, 3=Directlyresponsible for safety, 5=Hazardous or life threatening. 3
56. How important is the owner to the revenues of this business? Apply a number:1=Indispensable, 5=Absentee. 4.5
57. If you use the last three years as a trend, how have gross revenues beentrending? Apply a number: 1=Severe decline, 5=Steady growth. 3
58. This company gets most of its new business by what means? Apply a number:1=Owner influence, 5=All walk in. 3
59. Considering social status, visual appeal, profits and longevity -- using a scale of 1to 5, how desirable is this business? Apply a number: 1=Undesirable, 5=Dream of a lifetime. 3.5
60. In reviewing past years monthly and seasonal revenues, how accurately couldyou predict the next few years sales, other things being equal? Apply a number:1=All guess, 5=Absolutely positive. 4
61. How have this company's liability insurance rates gone? Apply a number:1=Gone down, 5=Almost impossible to get. 2
62. Give the trend of the market for this product? Apply a number: 1=Severe decline,2=Decline, 3=Stable, 4=Slight growth, 5=Exceptional growth with - future slow down. 4
63. How long has this industry or product been widely known? Apply a number:1=New, 2=Less than 10 years, 3=Over 10 years. 3
64. What is the local economic trend? Apply a number: 1=Decline, 2=Flat, 3=Growth. 3
65. What is the national economic trend? Apply a number: 1=Decline, 2=Flat, 3=Growth. 3
45
Sample Paving & Excavation, Inc.Interview Questionnaire and General Assumption by the Appraiser
66. Given this type of business, how would you rate this location for doing this type ofbusiness? Apply a number: 1=Poor, 2=Fair to Poor, 3=Average, 5=Excellent. 4
67. What is the local labor market like for this business? Apply a number: 1=Competition,3=Normal, 5=Unemployment. 2
68. What type of business is this? Apply a number: 1=Simple, 3=Intermediate,5=Complex. 3
69. What is the strength of Unions in this area and industry? Apply a number: 1=None,2=Weak, few competitors are union, 3=Many competitors are union, 4=Strong, mostcompetitors are union, still some non-union, 5=All competitors are union. 2
46

DISCRETIONARY NET PROFIT ANALYSIS
2002 2003 2004 2005I. NET PROFIT from an annual statement or tax return $22,243 ($58,775) 35296 $66,253
ADDITIONAL CASH FLOWS(+) Owners' wages and payroll tax $110,000 $86,500 $96,500 $105,500(+) Owner's vehicle costs (unrelated to business) $11,965 $11,965 $11,965 $11,965(+) Owner's personal insurance costs $35,000 $35,000 $35,000 $35,000(+) Travel and miscellaneous (non essential) $7,200 $7,200 $7,200 $7,200(+) Excess legal fees, non business related $39,540 $47,763 $55,911 $63,936(+) Depreciation $37,192 $35,334 $59,536 $52,763(+) Interest expense $59,549 $61,286 $67,808 $68,901(+) Amortization $16,123 $16,123 $16,123 $16,123(+) Pension $52,000 $52,000 $52,000 $52,000(+) Rental payments for non business property $13,812 $13,812(+) Directors Fees $17,030 $9,756 $14,180 $18,200(+) Dividends $4,000 $4,000 $4,000 $4,000
II. TOTAL ADDITIONAL CASH FLOWS $389,599 $366,927 $434,035 $449,400
DEDUCT CASH COSTS(-) Interest income (-) Other income(-) Gain or (loss) on sale of assets
III. TOTAL CASH COSTS DEDUCTIONS $0 $0 $0 $0
_____________________________________________________________________________________________
I. (+) NET PROFIT $22,243 ($58,775) 35296 $66,253
II. (+) ADDITIONAL CASH FLOWS TOTAL $389,599 $366,927 $434,035 $449,400
III. (-) DEDUCT CASH COSTS TOTAL $0 $0 $0 $0
TOTAL DISCRETIONARY CASH FLOW $411,842 $308,152 $434,035 $515,653
47

Sample Paving & Excavation, Inc.
_______________________________________________________________________________________________
HISTORICAL AND FUTURE PROJECTED INCOME AND PROFITS_______________________________________________________________________________________________
2002 2003 2004 2005 2006 2007 Projected Projected
TOTAL REVENUES $5,942,000 $7,109,000 $5,833,000 $6,247,000 $7,496,400 $8,770,788 % Change 19.64% -17.95% 7.10% 20.00% 17.00% EXPENSES $5,530,158 $6,800,848 $5,398,965 $5,731,347 $6,934,338 $8,141,279 % Change 22.98% -20.61% 6.16% 20.99% 17.41% TOTAL CASH FLOWS (4) $411,842 $308,152 $434,035 $515,653 $562,062 $629,509
% Change -25.18% 40.85% 18.80% 9.00% 12.00%
PLEASE NOTE: Income less Expenses above may not equal Discretionary Net. The figures forIncome and Expenses are usually taken from the subject company's Profit and Loss Statements. Discretionary Net Profit is cash flow to the company before taxes, owner's salaries, income tax,depreciation and other expenses that would be discretionary to alternative ownership.
(4) Historical Discretionary Cash Flows from page 47 plus Projected Cash Flows.
48
20022003 2004
2005 20062007
Years
$0$2$4$6$8
$10
Mill
ions
REVENUES EXPENSES Cash Flow
HISTORICAL AND FUTURE PROJECTED OVERVIEW2002 through 2007

Sample Paving & Excavation, Inc.____________________________________________________________________________________________
NORMALIZING DISCRETIONARY EARNINGS
The objective of adjusting the income statements to a "normalized" basis is to make the best possibleestimate of the economic earning power of the entity. Statement adjustments are generally based onthe assumption that the entity will continue to remain independent in its present mode of operation.
The Small Business Acquisition Manual describes this process as follows: "In preparing the stabilizedincome account, you are attempting to show the most likely performance for the business over theensuing 12 month period. It is not your own business plan projection, which may include a lot ofchanges you would make in the business, but rather a picture of the business with the strengths andweaknesses it has at present - that is what you pay for when you buy a business."____________________________________________________________________________________________
Fiscal Period Earnings Weight Factored____________________________________________________________________________________________
Fiscal period ended 2002 $411,842Fiscal period ended 2003 $308,152
Fiscal period ended 2004 $434,035 10% $43,404 Fiscal period ended 2005 $515,653 80% $412,522 Fiscal period ended 2006 $562,062 10% $56,206 Fiscal period ended 2007 $629,509 Normalized Discretionary Earnings 100% $512,132 Less: Managment Compensation ($80,000) Less: Economic Depreciation ($48,150) Adjusted Normalized Earnings $383,982 EBITDA (Earnings before interest, taxes, depreciation & amortization: $204,040 Year 2003
49
20022003
20042005
20062007
Years
$0
$0
$0
$1
$1
Thou
sand
s
% Occurence
NORMALIZED INCOME ANALYSISLikelihood of occurence

Sample Paving & Excavation, Inc.______________________________________________________________________________________________JUSTIFICATION FOR PURCHASE TEST Exhibit 1______________________________________________________________________________________________The Justification For Purchase Test provides a means to test the reasonableness of the proposed sellingprice of the business. It is not a method for estimating the value of a business or other property, as arecertain evaluation and appraisal methods. The Justification For Purchase Test may assume the businessor other property is purchased by a buyer paying an amount equal to the asking price with terms eitherprovided by the owner or current bank financing.______________________________________________________________________________________________Exhibit 1 shows the results of applying the Justification for Purchase Test assuming;
1. The estimated purchase price is $1,857,000 2. A down payment percentage of 35.0%
3. The balance paid in equal monthly installments over a period of
8 years with 9.50% annual interest on the unpaid balance.
4. The derived cash flow will be available for capital additions and buyer's compensation.
5. Price, down payment, terms, and other assumptions as indicated on exhibit 1.
The earnings on Exhibit 1 was developed using the normalized discretionary earnings (page 49). From thisis deducted the interest expense created by the debt for purchasing the business to arrive at net cash flow. Derived cash flow is generated by deducting the principal payment for this debt.
Exhibit 1 contains certain information about the business which is to be used solely for the purpose ofconsidering the Company as a potential purchase. This information has been provided by the client. Although the Company believes the data contained herein to be a fair representation of the Company'sactivities, we cannot guarantee its completeness or accuracy.
We make no representation or warranty nor give any assurance that a prospective purchaser will do aswell as indicated on Exhibit 1. If a prospective purchaser relies upon this information, such prospectivepurchaser accepts the risk of doing as well.______________________________________________________________________________________________
Exhibit 1 Assumptions: BASED ON AN ASSET SALE
Total Price ------------------------------------------ $1,857,000 Down Payment ------------------------------------ 35.0% Balance Financed ------------------------------ $1,207,050 Number of Years -------------------------------- 8 Interest Rate ---------------------------------------- 9.50% Discretionary Cash ----------------------------- $512,132 First Year Cash Growth ------------------------- 0.0% Annual Cash Growth Thereafter ------------ 10.0% 50

JUSTIFICATION FOR PURCHASE TEST Exhibit 1_______________________________________________________________________________________________
Year 1 2 3 4 5_______________________________________________________________________________________________
Begin Principal $1,207,050 $1,101,212 $984,870 $856,981 $716,399Annual Principal $105,838 $116,342 $127,889 $140,582 $154,534Ending Balance $1,101,212 $984,870 $856,981 $716,399 $561,865
Annual Principal $105,838 $116,342 $127,889 $140,582 $154,534
Annual Interest $110,140 $99,636 $88,089 $75,397 $61,444Total Annual Pmts $215,978 $215,978 $215,978 $215,978 $215,978
Mo Pmt (Pr + Int) $17,998 $17,998 $17,998 $17,998 $17,998
ASSUMPTIONS:
Cash Flow $512,132 $563,345 $619,680 $681,648 $749,813Less Interest $110,140 $99,636 $88,089 $75,397 $61,444
Net Cash Flow $401,992 $463,709 $531,591 $606,251 $688,368Less Prncpl Pmts $105,838 $116,342 $127,889 $140,582 $154,534
Derived Cash Flow $296,154 $347,367 $403,702 $465,670 $533,834
Derived cash flow is available for buyer's compensation and capital additions.
_______________________________________________________________________________________________JUSTIFICATION FOR PURCHASE TEST Exhibit 1_______________________________________________________________________________________________
Year 6 7 8_______________________________________________________________________________________________
Begin Principal $561,865 $391,994 $205,263Annual Principal $169,871 $186,731 $205,263Ending Balance $391,994 $205,263 $0
Annual Principal $169,871 $186,731 $205,263Annual Interest $46,107 $29,248 $10,715
Total Annual Pmts $215,978 $215,978 $215,978
Mo Pmt (Pr + Int) $17,998 $17,998 $17,998
ASSUMPTIONS:Cash Flow $824,794 $907,273 $998,001
Less Interest $46,107 $29,248 $10,715Net Cash Flow $778,687 $878,025 $987,285
Less Prncpl Pmts $169,871 $186,731 $205,263
Derived Cash Flow $608,816 $691,295 $782,022
Derived cash flow is available for buyer's compensation and capital additions.
51

Sample Paving & Excavation, Inc.
JUSTIFICATION FOR PURCHASE TEST Exhibit 2_______________________________________________________________________________________________
BASED ON AN ASSET SALESUGGESTED PRICE: $1,857,000
DOWN PAYMENT: $649,950
NORMALIZED DISCRETIONARY EARNINGS: (See Page 49) $512,132
ADJUSTED NORMALIZED DISCRETIONARYEARNINGS: $383,982(See Page 49)
MANAGEMENT COMPENSATION: $80,000(See Question 2)
DISCRETIONARY NET AFTERMANAGEMENT COMPENSATION $432,132
DEBT SERVICE FIRST YEAR: $215,978
DISCRETIONARY NET AFTERMANAGEMENT COMPENSATION ANDLOAN PAYMENT: $216,154_______________________________________________________________________________________________
REASONABILITY ANALYSIS: After Management Compensation(first year)
Return on Down Payment: 45.57%
Return on Total Investment: 15.95%
REASONABILITY ANALYSIS: After Debt Service and Management Compensation(first year)
Return on Down Payment: 33.26%
Return on Total Investment: 11.64%_______________________________________________________________________________________________
RATIO ANALYSISPrice to Earnings (Normalized earnings): 3.63Price to Earnings (Adjusted normalized earnings): 4.84Price to EBITDA (Earnings before interest, taxes' depreciation and amortization) 9.10Price to Revenue (last year): 0.32
52

53
SOURCES OF INFORMATION REFERENCE MATERIALS Mercer, Christopher, Z, Quantifying The Integrated Theory of Business Valuation, Memphis, Tennessee, Peabody Publishing, L.P., 2004. Mercer, Christopher, Z, Quantifying Marketability Discounts, Memphis, Tennessee, Peabody Publishing, L.P., 2001. Mercer, Christopher, Z, Valuation for Impairment Testing, Memphis, Tennessee, Peabody Publishing, L.P., 2001. Pratt, Shannon P., The Market Approach to Valuing Businesses, New York, John Wiley & Sons, Inc., 2001. Pratt, Shannon P., Valuing a Business. Homewood, Illinois: Dow Jones - Irwin, 1981. Pratt, Shannon P., Valuing a Business, Second Edition. Homewood, Illinois: Dow Jones - Irwin, 1989. Pratt, Shannon P., Valuing a Business, Third Edition. Homewood, Illinois: Dow Jones - Irwin, 1996 Pratt, Shannon P., Valuing a Business, Fourth Edition. Homewood, Illinois: Dow Jones - Irwin, 2000 Pratt, Shannon P., Cost of Capital, New York, John Wiley & Sons, Inc., -1998 Pratt, Shannon P., Business Valuation Body of Knowledge, New York, John Wiley & Sons, Inc., 1998 Pratt, Shannon P., Valuing Intangible Assets, McGraw Hill, 1999 Pratt, Shannon P., The Market Approach to Valuing a Business, John Wiley & Sons, Inc., 2001 Pratt, Shannon P., Reilly, Robert F. and Schweighs, Robert P., Valuing Small Businesses and Professional Practices, McGraw-Hill, New York 1998 Miles, Raymond C., Basic Business Appraisal. New York: John Wiley & Sons, Inc., 1984.

54
SOURCES OF INFORMATION
REFERENCE MATERIALS – Continued Abraham, Mel H., Valuation Issues and Case Law Update, Updated Annually, Accounting Offices of Mel H. Abraham, 1999, 2000. Pratt, Shannon P., Business Valuation Update Newsletter, Business Valuation Resources, LLC. Updated Monthly. Peckron, Harold s, Revenue Recognition, North Vancouver, B.C., Canada, STP Specialty Technical Publishers, 2004 Jones, Gary E., The Business of Business Valuation, McGraw Hill, 1998 Pratt, Shannon P., Pratt's Stats, Business Valuation Resources, LLC. Updated Quarterly Cimasi, Robert James, A Guide to Consulting Services for Emerging Healthcare Organizations, New York, John Wiley & Sons, Inc., –1999 Pratt, Shannon P., Judges and Lawyers Journal, Data Base and Newsletter, Business Valuation Resources, LLC. Updated Monthly Lipper, Authur III. The Guide for Venture Investing Angels, Columbia, Missouri, Missouri Innovation Center Publications, 1998 Revenue Ruling 59-60, Internal Revenue Service, 26 CFR 20.2031-2: Valuation of Stocks and Bonds. 1959 Risk Management Associates, Annual Statement Studies. Updated Annually IRS Corporate Ratios. Updated Annually Country Business Services, Small Business Acquisition Manual. Country Business Services, 1981. Buying and Selling Businesses, George D. Abraham, contributing author, and William W. Bumstead, John Wiley & Sons, Inc., 1998. Financial Accounting, Third Edition, Walter B. Meigs, Ph.D., CPA and Robert F. Meigs, DBA

55
SOURCES OF INFORMATION ________________________________________________________________________ REFERENCE MATERIALS – Continued Principles of Financial Accounting, A Conceptual Approach, H. A. Finney, Ph.D, CPA and Herbert E. Miller, Ph.D., CPA "Sales Statistics", Abraham & Associates. Business Evaluation Systems Required Rates of Return National Data Base U. S. Industry & Trade Outlook. Washington: U.S. Department of Commerce, and Business Valuation Market Place, Updated Annually. Annual Report, Washington; United States Small Business Administration. Updated Annually Standard & Poor’s Industry Surveys, Updated Annually Wall Street Journal Inc. Magazine, Monthly The Value Examiner, National Association of Certified Valuation Analysts, Updated Bimonthly The Business Appraiser Journal, The Institute of Business Appraisers The Mergers & Acquisitions Advisors, The M&A Advisor, LLC, Updated Bimonthly AMEA appraiser, Association of Machinery and Equipment Appraisers. Business Valuation Review, Business Valuation Committee of the American Society of Appraisers Mid Market Comparables, Wiley ValuSource, John Wiley & Sons, Inc., 1996
BizComps, Jack Sanders, San Diego, California Fixed Asset Analyzer, Wiley ValuSource, John Wiley & Sons, Inc., 1996 Cash Flow Forecasting, Wiley ValuSource, John Wiley & Sons, Inc., 1996

56
SOURCES OF INFORMATION ________________________________________________________________________ REFERENCE MATERIALS – Continued George D. Abraham, Business Evaluation Systems Pro Software, John Wiley and Sons, 1997 through 2004 WEFA Industrial Monitor, John Wiley and Sons, Updated Annually Annual Report, Washington; United States Small Business Administration. Updated annually 2004 Business Reference Guide, 14th Edition, West, Thomas, Business Brokerage Press, Concorde, MA CCH Incorporated, Business Valuation Guide U. S. Department of Labor Bureau of Labor Statistics
Mergerstats Comparable Sales Data Base Trugman, Gary R., Understanding Business Valuation, second edition, American Institute of Certified Public Accountants, 2002, New York, New York Valuation for Impairment Testing, Mercer Capital, Peabody Publishing, LP, 2001, Memphis, Tennessee Hot Jobs.com Ibbotson Integra Salary.com

57
APPRAISAL AND CONSULTING QUALIFICATIONS ________________________________________________________________________
GEORGE D. ABRAHAM
CSBA/BCBA/CMEA/AAR/CBC/FCBI/CEI/CFEA QUALIFICATIONS
George D. Abraham has been involved in the transfer of over 450 businesses and performed over 12,000 appraisals in the past 32 years. Two of the appraisals Mr. Abraham was involved in passed the scrutiny of the World Bank. He has performed close to 2,000 appraisals for bank and SBA financing purposes. He has done several appraisals valued over $7 billion. He has owned and operated several types of businesses throughout his career. His company has over 450 trained valuation partners around the country that enable his company to perform appraisal and consulting assignments at competitive rates. His company was the first in the nation to develop and gain national attention for its unique and highly accurate business evaluation software programs that have been marketed to business brokers and appraisers all over the country. At present, the programs are being developed and marketed, under the supervision of Mr. Abraham, by John Wiley and Sons Publishing Company for worldwide distribution. He has consulted with the nation's top intermediaries, accountants, attorneys and appraisal companies, and his programs are being used in nearly 2,000 offices nationwide, as well as in Canada and England. He is a licensed Real Estate Broker, Real Estate Appraiser, Business Appraiser, Machinery and Equipment Appraiser, Board Certified Business Broker, Certified Environmental Inspector, Certified Business Intermediary, Licensed State Property Tax Consultant, Accredited Review Appraiser, Certified Business Counselor, and prior instructor for the Continuing Education Real Estate Course in Business Appraisal at the University of Houston. Attorneys, accountants, and other clients retain him regularly for appraisals and consulting, as well as for court testimony as an expert witness, on the local, national and international level. He has previously served two consecutive terms as a board member and panel chairman for the Galveston Central Appraisal Review Board. He is one of the founding charter members and a Past State President of the Texas Association of Business Brokers and served two consecutive terms as State Vice President of Education. In July of 1997, Mr. Abraham was awarded a "Life Membership" from the Board of Directors for his contributions to the association. He has served on the National Board of Directors for the Institute of Certified Business Counselors for the past eight years as Vice President of Education and has served two consecutive terms as the National President (1998 to 2000). He is one of the first to qualify and receive the "Board Certified Broker" designation from the Texas Association of Business Brokers and one of the first to qualify for the "Board Certified Intermediary" designation by the International Business Brokers Association. In the fall of 1994, Mr. Abraham was named a "Fellow" of the International Business Brokers Association by its Board of Directors for his significant contribution to the association and the business intermediary industry.

58
He has conducted over 92 seminars on business valuation around the nation and in Canada and is a regular speaker at most of the national conventions for this industry. His articles on valuation, business transfers, business consulting and enhancements, and environmental concerns appear on a regular basis in most of the association newsletters in his industry. Because of his active participation as a consultant to business intermediaries around the country, he has developed an extensive database of financial and operating information. His related activities enable him to remain current in industry trends, comparable sales information, comparative operating ratios and other factors necessary to effectively appraise and enhance going concerns. In addition to valuation of complete businesses, Mr. Abraham also specializes in the valuation of machinery and equipment, business consulting and business enhancement programs and implementation. He is contracted on a regular basis to perform these assignments for other major valuation firms. Mr. Abraham has extensive national and international consulting experience. The work he has performed has labeled Mr. Abraham as a turnaround specialist in privatization and he was listed as one of the top appraisers in 1993 in the Turnarounds & Workouts news publication. The types of oilfield appraisals and enhancement consulting that Mr. Abraham has been involved in include drilling rigs, well service rigs, refineries, pipelines, rental company inventory, oil and gas production equipment and offshore oil transportation equipment. In addition to equipment used in exploration or production, he has had experience appraising machinery and equipment used to manufacture oilfield equipment. Mr. Abraham has performed appraisals in the United States, Canada, Mexico, Argentina and the Bahamas. Two of his international appraisal and enhancement consulting assignments were for government owned oil companies to obtain financing through the World Bank for the country's privatization efforts. EDUCATION Lamar Tech University (1966-1967) - Economics Major University of Houston (1967-1970) - Economics Major DESIGNATIONS AND LICENSES – Past and Present Board Certified in Business Appraisal (B.C.B.A.), (Cert. # 846) National Society of Appraiser Specialists Certified Business Counselor (C.B.C.), Institute of Certified Business Counselors Certified Senior Business Appraiser (C.S.B.A.), Society of Business Analysts Accredited in Appraisal Review (A.A.R.), National Society of Appraiser Specialists

59
Certified Environmental Inspector (C.E.I.), (#4868), National Society of Appraiser Specialists Board Certified Broker (B.C.B.), Texas Association of Business Brokers Certified Business Intermediary. "Fellow" (F.C.B.I.), International Business Brokers Association (one of the first 20 to receive this designation) Certified State Property Tax Consultant, (S.P.T.C.), (#792), Texas Department of Licensing and Regulations Certified Farm Equipment Appraiser (C.F.E.A.), (#03473) American Society of Farm Equipment Appraisers Senior Business Analyst (S.B.A.), Society of Business Analysts Texas Real Estate Broker (License # 216656) Nevada Real Estate Broker-Salesman (License # 35781) Registered Professional Member (R.P.M.), (#42522), National Association of Real Estate Appraisers Certified Machinery & Equipment Appraiser and Broker (C.M.E.A.), Institute of National Equipment and Business Brokers PROFESSIONAL AND TRADE AFFILIATIONS (Present and Historical) Texas Association of Business Brokers, Charter Member Past State President (1985-1986) State Vice President of Education (1991-1992) (1992-1993) Past State Vice President and Treasurer (1984-1985) Past Chapter Chairman (1983-1984) Past Chapter Treasurer (1982-1983) Chairman of various committees (1981-1985) Institute of Business Appraisers International Business Brokers Association Co-Chair, Fellow’s Committee (2005 to present) Institute of Certified Business Counselors
Previously on the National Board of Directors (1990 – 2000), Past President (September 1998 – September 2000)
National Vice President of Education (1992 - 1998)

60
Accredited Review Appraisers Council National Association of Real Estate Appraisers Environmental Assessment Association Galveston Central Appraisal Review Board Member Appraisal Review Board Member (1990-1991)
Panel Chairman, Industrial Appraisal Review Board (1991-1993) • Settled over 1,400 appraisal disputes • Settled dispute of one of the largest shipping companies on the Gulf
Coast • Valued one of the largest Resort Properties for litigation – value
accepted with no challenge • Valued one of the largest banking chains in south Texas for litigation
– value accepted with no challenge Medical Practice Valuation Study Group Small Business Survival Committee Chief Executive Officer's Club Alliance of Merger and Acquisition Advisors (AMAA) National Association of Certified Valuation Analysts (NACVA)
CLIENTS/APPRAISALS AND CONSULTING - Partial List VR Business Brokers Sunbelt Business Brokers Grace Drilling Prudential Insurance Federal Deposit Ins. Corp. (FDIC) Pool Well Service Bank United Cameron County Appraisal District Well Tech, Inc. Century 21 YPF, Argentina Empire Bus. Bkrs Laguna Resort, Honduras, CA Pemex, Mexico Cigna Group Ins. Equivision, Inc. Borco, Freeport Bahamas Sheridan Drilling RH Medical, Inc. Blue Cross/Blue Sheild John Wiley & Sons CECO Compressor Eng. Business Brokers Network Heller Financial MISCELLANEOUS Instructor and Creator, University of Houston, Continuing Education Real Estate Course, "Market Value of a Business" (1987-1990) Instructor and Creator, International Business Brokers Association, "Business Valuation Course 104", National Certification Program. (1989), Recasting Financial Statements Course 210, (1998).

61
Presenter, Basic Business Valuation, Angelo State University (1993) Currently listed in four Marquis Who's Who Publications as: "Who's Who in the World", "Who's Who in America", "Who's Who in the Southwest", and "Who's Who in Finance and Industry." Author, Business Evaluation Systems Software, John Wiley & Sons, Inc., 1997 Contributing Author, Buying and Selling Businesses (Valuation Chapter), John Wiley & Sons, Inc., 1998 Owner, Business Evaluation Systems Founder and National Director of the Society of Business Analysts (1998 to present) Owner, Abraham and Associates Business Brokerage Co. (no longer active since 1996)

62
APPRAISAL SUBJECTS - Partial List COMPLETE BUSINESSES, FRANCHISES AND DISTRIBUTORSHIP • Accounting Practices • Acupuncture Clinics • Adhesive Manufacturing • Agricultural Processing and
Distribution • Air Conditioning, Heating and
Energy Conservation • Airplane Parts Manufacturing • Ambulance Services • Ammunition Manufacturing • Amusement Parks • Antique Sales • Architectural Design • Art Galleries • Assisted Living Centers • Automobile Dealerships New/Used • Automotive Tire and Repair • Aviation Repair and Refurbishing • Aviation Schools • Bakeries (including wholesale) • Banks • Battery Manufacturing • Battery (Standby) Manufacturing • Beer and Alcohol Wholesale
Distribution • Behavioral Clinic Chain • Boiler Manufacturing and Sales • Bowling Alleys • Breweries • Business Brokerage Companies • Campgrounds • Cardiopulmonary Medical Testing • Casino Equipment Sales and Service • Casinos • Check Cashing Services • Circuit Board Manufacturing • Commercial Washer/Dryer
Wholesale • Computer Manufacturing • Computer Retail, Wholesale and
Repair Companies • Concrete Companies • Construction Companies • Consulting Companies • Convenience Stores • Corporate Promotional Companies • Court Reporting Companies • Custom Made Machinery • Data Processing • Daycare Facilities • Dental Practices • Diesel Parts/Repair Distributing • Direct Mail Companies • Dry-Cleaning and Laundry Plants • Electrical Contracting • Electrical Wholesale Supply • Employee Leasing • Engineering Companies • Environmental Studies • Eye Surgery Centers • Fastener and Supplies Wholesale • Fiber Optics Cabling, Installation
and Integration • Flooring Companies • Flower Shops • Forestry Service • Fruit Growers, Processing and
Refrigeration • Fuel and Propane Dealers • Funeral Casket Manufacturing • Funeral Homes • Furniture Manufacturing and Sales • Golf Club Manufacturing • Golf Club Retail Sales • Grocery Stores and Supermarkets • Gymnasiums • Hardware Stores • Hearing Aid Manufacturing and
Sales • Home Builders

63
• Home Inspections • Hypnosis Clinic • Import/Export Companies • Industrial Labor Contracting • Injection Molding Companies • Insurance Companies • Internet Companies • Investment Companies • Jewelry Display Manufacturing • Jewelry Stores • Landfills • Landscaping Companies • Law Practices • Lighting Manufacturer • Limousine Services • Litigation Support • Lumber Companies • Machine Shops • Manufacturing Blast Furnaces • Marine Dealers • Marketing Companies • Martial Arts Companies • Medical Billing Companies • Medical Centers - Outpatient • Medical Delivery Services • Medical Equipment Supplies • Medical Practices • Medical Transportation Services • Metal Processing and Recycling • Mining Companies • Mortgage Banking • National Wholesale Fabric Sales • Nurseries (Plants) Wholesale and
Retail • OB-GYN Clinics • Occupational Nursing Services • Office Centers • Office Supply Companies • Oil and Gas Production Companies • Oil and Gas Wholesale and Retail
Companies • Optometry and Oncology Clinics • Outdoor Survival Schools
• Paper and Chemical Wholesale • Paper Mills • Patent Development • Pawn Shops • Pharmaceutical Drug • Pharmacies • Physical Therapy • Plumbing Companies • Preschools and Kindergartens • Printing and Publishing Companies • Production Filming of TV
Commercials • Psychiatric Practices • Public Relations • Pump Manufacturing • Rare Newspapers • Real Estate Sales Companies • Recreational Vehicle Sales and
Service • Rehabilitation Centers • Research and Development • Restaurants, Clubs and Liquor Stores • Retail Carpet, Clothing, Sporting
Goods, Camera and Gardening • Roller Rinks • Roofing Companies • Satellite Sales and Service • Saw Mills • Security Guard Companies • Security Systems Manufacturing • Self Storage Facilities • Ship Repair • Shipping Companies • Sign Companies • Software Companies • Specialty Foods Distribution • Sprinkler System Installation • Steel Fabrication, Stainless Steel
Distributing Companies • Steel Office Building Manufacturing • Stock Brokerage Company • Surveying Companies • Talent Agencies
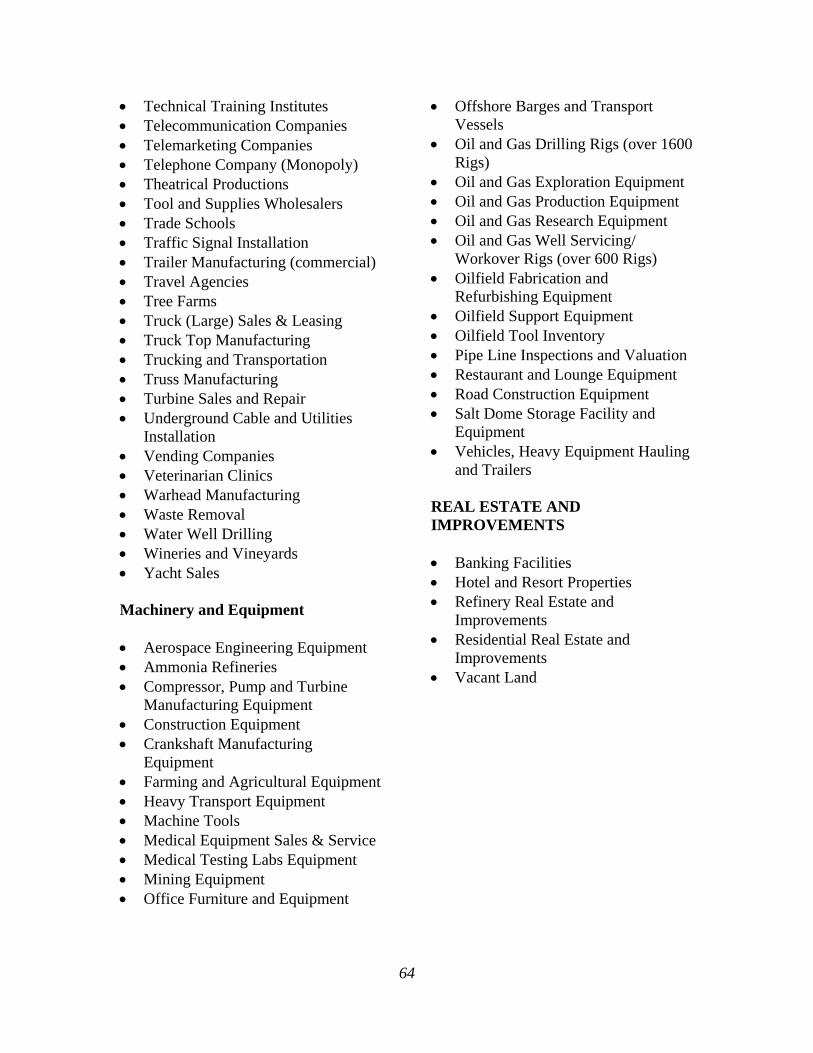
64
• Technical Training Institutes • Telecommunication Companies • Telemarketing Companies • Telephone Company (Monopoly) • Theatrical Productions • Tool and Supplies Wholesalers • Trade Schools • Traffic Signal Installation • Trailer Manufacturing (commercial) • Travel Agencies • Tree Farms • Truck (Large) Sales & Leasing • Truck Top Manufacturing • Trucking and Transportation • Truss Manufacturing • Turbine Sales and Repair • Underground Cable and Utilities
Installation • Vending Companies • Veterinarian Clinics • Warhead Manufacturing • Waste Removal • Water Well Drilling • Wineries and Vineyards • Yacht Sales
Machinery and Equipment • Aerospace Engineering Equipment • Ammonia Refineries • Compressor, Pump and Turbine
Manufacturing Equipment • Construction Equipment • Crankshaft Manufacturing
Equipment • Farming and Agricultural Equipment • Heavy Transport Equipment • Machine Tools • Medical Equipment Sales & Service • Medical Testing Labs Equipment • Mining Equipment • Office Furniture and Equipment
• Offshore Barges and Transport Vessels • Oil and Gas Drilling Rigs (over 1600
Rigs) • Oil and Gas Exploration Equipment • Oil and Gas Production Equipment • Oil and Gas Research Equipment • Oil and Gas Well Servicing/
Workover Rigs (over 600 Rigs) • Oilfield Fabrication and
Refurbishing Equipment • Oilfield Support Equipment • Oilfield Tool Inventory • Pipe Line Inspections and Valuation • Restaurant and Lounge Equipment • Road Construction Equipment • Salt Dome Storage Facility and
Equipment • Vehicles, Heavy Equipment Hauling
and Trailers REAL ESTATE AND IMPROVEMENTS • Banking Facilities • Hotel and Resort Properties • Refinery Real Estate and
Improvements • Residential Real Estate and
Improvements • Vacant Land

APPENDICES
a) Risk Management Associates Ratios b) BES Required Rates of Return
c) Comparable Sales d) U. S. Economic Outlook
e) Industry Report
f) Trade Area Outlook
g) International Glossary

PLEASE NOTE: The comparable sales data included in the following appendices:
a) Risk Management Associates Ratios and Definitions b) BES Required Rates of Return c) Comparable Sales
were the closest found after extensive research. In using the Market Comparable Approach, the appraiser has studied only those sales that are the closest to the company being valued in time, size, location and nature of business.

Risk Management Associates Ratios and Definitions

________________________________________________________________________ DEFINITIONS OF FINANCIAL & OPERATING RATIOS (Comparative Ratios) ________________________________________________________________________ Current Ratio: Year-end current assets divided by year-end current liabilities. Quick Ratio: (Year-end cash, accounts receivable and all assets shown in between cash and accounts receivable) divided by year-end total current liabilities. Working Capital: (Year-end current assets less year-end current liabilities) divided by 1000. Sales/Receivables: Year's sales divided by the average of year-beginning and year-end accounts receivable. Days in Receivables: 365 divided by the sales/receivable ratio. Cost of Sales/Inventory: year's cost of sales divided by the average of the year-beginning inventory and year-end inventory. Days in Inventory: 365 divided by the cost of sales/inventory ratio. Working Capital Turnover: Year's sales divided by the year's average working capital [year-beginning total assets plus year-end total current assets less year-beginning total current liabilities less year-ending total current liabilities) divided by 2]. Fixed Assets Turnover: Year's sales divided by average of year-beginning and year-end net fixed assets. Asset Turnover: year's sales divided by average of year- beginning and year-end total assets. Interest Expense Coverage, EBIT: (Year's pretax income from continuing operations plus year's interest expense) divided by year's interest expense. Interest Expense Coverage, EBDIT: (Year's pretax income from continuing operations plus year's interest expense plus year's depreciation/amortization expense) divided by year's interest expense. Cash Flow/Current Maturity of Long-Term Debt: (Year's net income from continuing operations plus year's depreciation/amortization expense) divided by year-beginning current maturities of long-term debt. Fixed Assets/Equity: year-end net fixed assets divided by year-end net worth.

________________________________________________________________________ DEFINITIONS OF FINANCIAL & OPERATING RATIOS (Comparative Ratios) ________________________________________________________________________ Equity as a percent of total Capital: Year-end equity divided by (year-end equity plus year-end long-term debt). Net Income/Equity: Year's net income divided by year- beginning net worth. Net Income/Assets: year's net income divided by year- beginning total assets. Debt Free Income/Total Capital: (Year's net income plus interest expense) divided by (year-beginning equity plus year-beginning long term debt). Net Income/Sales: year's net income divided by year's sales. Cash Flow/Assets: (Year's net income plus depreciation expense) divided by year-beginning total assets. Debt Free Cash Flow/Total Capital: (Year's net income plus depreciation and interest expense) divided by the sum of year-beginning equity and long-term debt. Cash Flow/Sales: (Year's net income plus depreciation expense) divided by year's sales. Debt/Net Worth: Total year-end liabilities divided by year- end net worth. Equity as a Percent of Total Capital: Average year-end equity of all sample companies divided by (average year-end long-term debt plus average year-end net worth of all sample companies). Pretax Profit/Tangible Net Worth: Year's pretax profit divided by (year-end net worth less intangible asset value). Pretax Profit/Total Assets: Year's pretax profit divided by year-end total assets (including intangible assets). Pretax Profit/Sales: Year's average pretax profits of all sample companies divided by year's average sales of all sample companies.

1 23 123 166 41 318 38 102 219 16 11 4
15 18 7 17 21 53 42 13 7
137 641
40 116 296 234 54 38
Current Data Sorted By Assets Comparative Historical Data
(4/1-9/30/04) (10/1/04-3/31/05)0-500M 500M-2MM 2-10MM 10-50MM 50-100MM 100-250MM
% % % % % %
219 24983 10347 6515 1596 121
460 553
4/1/00- 4/1/01-3/31/01 3/31/02
ALL ALL
% %16.127.1
2.07.4
52.741.3
.45.6
100.0
12.45.4
12.8.1
17.448.024.2
.32.1
25.5100.0
100.040.436.9
3.6.1
3.5
3.31.8
.9
2.81.4
.7
UND21.5
6.0
UNDUNDUND
UND23.5
8.1
10.330.6
–29.6
16.03.6
.3
.41.1
10.2
.61.9
16.0
62.531.7
4.8
29.210.0
.3
34.49.55.0
5.63.22.3
2.23.59.5
5.57.0
13.6
13.731.6
4.76.1
56.235.5
.87.5
100.0
8.36.0
17.9.5
10.242.818.5
.75.1
32.8100.0
100.026.924.4
2.5.7
1.8
2.01.5
.9
1.81.1
.7
16.49.26.0
UNDUND63.4
33.115.0
8.4
8.518.5
–90.3
12.03.4–.2
6.32.01.1
.51.02.6
.81.75.2
38.615.3
2.1
15.64.9–.5
15.69.84.6
3.72.61.8
1.83.86.6
2.63.45.7
01761
000
01645
(31)
(31)
(27)
(15)
224060
006
112443
(99)
(20)
(100)
(97)
(52)
15.531.6
3.57.0
57.634.1
1.37.0
100.0
6.25.4
16.9.8
8.738.014.8
1.32.7
43.2100.0
100.016.413.5
3.0.0
3.0
2.21.51.1
1.91.2
.8
11.27.15.3
UND384.2
38.8
21.512.2
8.0
6.412.441.9
9.83.21.0
3.91.81.0
.4
.81.4
.71.42.9
27.612.2
.9
11.24.7
.1
12.36.94.2
2.92.21.6
2.03.35.0
1.22.54.1
335169
019
173046
(418)
(154)
(441)
(414)
(168)
325273
018
173147
(500)
(172)
(535)
(504)
(180)
365373
005
163151
(280)
(117)
(285)
(275)
(127)
375377
029
213246
(213)
(79)
(220)
(64)
14.734.8
3.37.1
59.832.7
1.06.5
100.0
5.46.1
18.41.08.4
39.313.5
1.73.3
42.2100.0
100.017.914.2
3.7.3
3.4
2.21.51.2
1.81.3
.9
10.26.85.0
UNDUND67.0
22.511.9
7.1
6.211.532.8
17.05.81.9
3.92.21.3
.4
.81.3
.71.52.8
31.118.3
4.1
12.36.21.6
12.77.64.6
2.92.31.6
2.13.55.4
1.42.34.1
16.031.0
3.97.2
58.033.3
1.27.5
100.0
3.74.9
17.0.4
11.637.613.3
1.32.4
45.4100.0
100.012.8
9.13.6–.23.9
2.11.51.2
1.71.31.0
9.86.94.7
UND210.5
40.4
17.111.5
7.9
6.310.819.4
18.77.32.6
4.31.91.1
.5
.81.2
.71.32.3
26.514.9
5.4
11.85.82.2
9.86.54.0
2.52.01.6
2.43.54.8
.61.42.2
50241M 390916M 3517167M 10322056M 7077209M 9423574M11547M 138914M 1500217M 5100441M 3814223M 5580862M
18603770M 23486068M8636240M 11446375M
© RMA 2005 M = $ thousand MM = $ millionSee Pages 11 through 21 for Explanation of Ratios and Data
CONSTRUCTION – GENERAL—Highway, Street, and Bridge Construction NAICS 237310 (SIC 1611, 1622, 1721)
15.032.2
3.37.1
57.634.6
1.36.5
100.0
5.45.2
18.2.6
9.839.215.2
1.21.8
42.6100.0
100.017.013.6
3.4.3
3.0
2.11.41.1
1.71.2
.9
11.27.05.0
UND699.2
47.1
21.411.6
7.7
6.713.135.6
9.73.61.5
3.41.91.0
.4
.81.4
.71.42.9
32.014.6
4.0
11.95.41.4
11.66.84.1
2.82.21.6
1.93.55.2
1.32.85.0
365370
18
18
253751
(49)
(23)
(45)
405073
29
21
243547
(35)
(37)
(25)
12.627.5
6.110.756.931.2
1.510.3
100.0
3.04.4
17.8.8
13.940.019.3
2.22.2
36.4100.0
100.012.7
9.92.7
.22.6
1.91.51.1
1.31.0
.7
10.16.95.2
382.943.020.2
14.99.87.1
5.711.836.4
15.44.52.0
5.01.81.2
.41.11.8
1.42.33.7
23.414.4
2.3
7.54.51.2
10.95.73.3
2.31.81.2
1.94.14.9
8.524.8
5.012.650.935.4
4.19.7
100.0
2.23.7
14.3.2
12.933.317.6
1.93.1
44.1100.0
100.012.9
9.53.4
.13.4
2.01.51.2
1.31.0
.8
9.27.35.0
212.642.717.2
15.110.3
7.8
6.810.221.2
14.17.63.4
.6
.91.1
.91.52.3
20.712.6
8.3
8.25.13.3
9.25.43.2
2.11.51.3
1.72.94.5
Type of StatementUnqualifiedReviewedCompiled
Tax ReturnsOther
NUMBER OF STATEMENTSASSETS
Cash & EquivalentsTrade Receivables (net)
InventoryAll Other Current
Total CurrentFixed Assets (net)Intangibles (net)
All Other Non-CurrentTotal
LIABILITIESNotes Payable-Short Term
Cur. Mat.-L/T/DTrade Payables
Income Taxes PayableAll Other Current
Total CurrentLong-Term DebtDeferred Taxes
All Other Non-CurrentNet Worth
Total Liabilities & Net Worth
INCOME DATANet Sales
Gross ProfitOperating Expenses
Operating ProfitAll Other Expenses (net)
Profit Before Taxes
RATIOS
Current
Quick
Sales/Receivables
Cost of Sales/Inventory
Cost of Sales/Payables
Sales/Working Capital
EBIT/Interest
Net Profit + Depr., Dep.,Amort./Cur. Mat. L /T/D
Fixed/Worth
Debt/Worth
% Profit Before Taxes/TangibleNet Worth
% Profit Before Taxes/TotalAssets
Sales/Net Fixed Assets
Sales/Total Assets
% Depr., Dep., Amort./Sales
% Officers’, Directors’,Owners’ Comp/Sales
Net Sales ($)Total Assets ($)

1 22 113 145 38 276 36 91 195 14 8 215 13 62 15 48 35 10 5
122 554
29 100 266 201 48 32
Current Data Sorted By Assets Comparative Historical Data
(4/1-9/30/04) (10/1/04-3/31/05)0-500M 500M-2MM 2-10MM 10-50MM 50-100MM 100-250MM
% % % % % %
163 17858 7417 228 10
69 95
315 379
4/1/00 4/1/013/31/01 3/31/02
ALL ALL
% %
Type of StatementUnqualifiedReviewedCompiled
Tax ReturnsOther
Sales SizeNumber of Statements
EXPECTED DEFAULT FREQUENCY
Risk Calc EDF(1 yr)
Moodys EDF Risk Calc EDFRating (see note) (5 yr)
CASH FLOW MEASURES
Cash fromTrading/Sales
Cash afterOperations/Sales
Net Cash after Operations/Sales
Cash after DebtAmortization/Sales
Debt ServiceP&I Coverage
Interest Coverage(Operating Cash)
∆ Inventory
∆ Total Current Assets
∆ Total Assets
∆ Retained Earnings
∆ Net Sales
∆ Cost of Goods Sold
∆ Profit beforeInt. & Taxes
∆ Depr./Depl./Amort.
RATIOS
SustainableGrowth Rate
Funded Debt/EBITDA
Net Sales ($)Total Assets ($)
.20
.632.75
1.834.429.50
59.539.822.2
15.48.61.6
15.08.62.1
10.24.3–.6
8.13.51.1
22.19.01.8
69.127.5
5.2
38.416.4
–.3
77.622.9
–19.1
48.415.0
–.4
66.033.9
1.1
507.992.6
–21.1
30.0–6.8
–42.9
74.522.2–3.1
.41.04.2
.22
.451.16
1.823.436.58
38.422.915.5
11.15.32.5
11.45.61.9
5.81.4
–2.8
3.61.5
.4
17.76.42.3
41.5.0
–31.7
37.01.9
–30.4
22.72.2
–18.2
35.96.2
–18.8
28.17.8
–11.1
33.47.3
–11.4
177.839.5
–67.7
21.5–4.6
–19.1
23.03.4
–15.1
.61.54.5
(25)
Baa1Ba1Ba3
(28)
(28)
(28)
(27)
(86)
Baa1Baa3
Ba2
(91)
(86)
(40)
(99)
(97)
(99)
(231)
A3Baa2Baa3
(262)
(257)
(124)
(258)
(265)
(179)
A3Baa1Baa3
(194)
(187)
(126)
(190)
(200)
.20
.31
.78
1.282.434.27
24.516.610.4
10.65.71.3
10.55.61.7
5.31.9
–2.3
4.01.8
.5
24.010.3
2.2
47.57.8
–17.8
37.010.0–7.5
28.19.2
–5.1
26.58.1
–3.1
37.614.5–4.6
35.613.6–3.8
168.543.3
–29.8
17.91.1
–9.9
26.79.0
–1.6
.61.42.7
.18
.25
.53
1.141.823.41
17.412.6
8.1
9.15.01.8
9.25.72.3
5.51.9
–1.9
5.22.1
.7
25.811.5
3.2
58.215.1
–10.1
24.711.7
1.5
19.69.2
.6
18.18.0
.6
23.99.1
–3.0
25.98.7
–3.3
102.526.4
–39.0
14.32.2
–8.7
19.48.01.3
.51.43.1
36697M 331861M 3235955M 8911122M 6155666M 8286639M8273M 118502M 1377225M 4353690M 3360867M 4775809M
13931424M 17040697M6261049M 7947446M
CONSTRUCTION – GENERAL—Highway, Street, and Bridge Construction NAICS 237310 (SIC 1611, 1622, 1721)
(42)
Baa1Baa2
Ba1
(45)
(44)
(37)
(42)
Baa1Baa2Baa3
(31)
(30)
(26)
(31)
.23
.33
.82
1.572.684.50
15.611.3
6.1
7.13.7–.2
7.93.4
.6
4.0–.3
–3.3
2.91.3
.3
19.26.6
.7
31.811.0–2.4
30.416.0
.4
17.112.2
3.9
20.36.0
–3.7
19.08.7
–6.7
23.88.5
–6.5
41.7–13.6–59.6
14.14.6
–3.3
13.95.4
–2.3
1.02.65.3
.23
.26
.46
1.602.073.17
19.513.4
7.5
9.56.21.6
9.86.33.4
4.32.1–.6
3.92.91.2
19.311.1
5.9
28.79.2
–7.3
24.312.6
.0
16.57.42.3
17.48.42.3
31.611.7–5.7
31.213.5–5.4
31.6–.4
–26.9
23.38.4
.7
10.86.93.0
.82.02.7
% % % % % %
© RMA 2005 M = $ thousand MM = $ millionSee pages 6 through 18 for explanation of ratios and data. Note: The ratings are Moody’s.edf rating (e.g. Ba1.edf) and not Moody’s Investor Services Long-Term Bond Ratings.
If a number of statements appears for the Risk Calc EDF (1 yr), it also applies to the (5 yr).
.21
.551.14
1.613.676.51
22.815.2
9.5
11.06.01.8
10.75.91.8
5.4.6
–2.3
3.1.8
–2.3
13.45.12.0
31.45.9
–10.2
22.77.3
–13.0
16.65.3
–5.6
18.24.8
–7.6
19.37.1
–5.7
22.09.0
–5.6
54.4–15.3–65.2
16.76.4
–3.4
19.06.9
–4.2
.51.73.4
Baa2Baa3
Ba1
(300)
(285)
(174)
(314)
(293)
(282)
Baa3Ba1Ba2
(360)
(349)
(200)
(378)
(361)
(355)
.27
.531.11
2.003.556.36
22.115.910.6
10.96.93.3
11.26.93.4
5.82.3–.8
3.91.4–.3
16.97.23.1
18.3.0
–15.2
29.69.9
–9.7
17.95.0
–5.8
24.68.8
–2.9
23.87.7
–7.3
24.05.3
–9.8
126.419.5
–37.9
16.85.0
–7.2
24.19.4–.1
.51.63.1
%% %%


CONSTRUCTION – GENERAL—Highway, Street, and Bridge Construction NAICS 237310 (SIC 1611, 1622, 1721)
Comparative Historical Data Current Data Sorted By Sales
16.229.4
3.27.7
56.535.5
1.26.8
100.0
4.55.6
17.1.5
10.338.016.0
1.32.5
42.2100.0
100.017.113.8
3.3.3
2.9
2.21.51.1
1.81.2
.8
12.27.75.7
UND918.5
48.5
21.112.4
8.2
6.412.838.1
13.64.11.5
3.72.01.2
.5
.81.4
.71.42.7
28.813.9
3.6
12.05.31.1
12.06.84.2
2.82.21.6
2.23.65.5
1.12.44.5
14.330.9
3.88.3
57.434.7
1.26.7
100.0
5.25.3
17.6.5
10.639.215.1
1.33.2
41.3100.0
100.017.715.0
2.7.2
2.5
2.11.51.2
1.71.2
.8
11.77.45.1
UND839.5
40.9
23.511.8
7.7
6.912.932.4
10.64.11.2
3.41.91.2
.4
.81.4
.81.52.9
26.612.2
1.6
11.44.4
.3
12.17.04.1
2.82.21.6
2.13.75.4
1.22.44.3
304764
008
172945
(576)
(202)
(604)
(573)
(209)
(771)
314972
009
163148
(699)
(247)
(733)
(695)
(263)
335171
019
183147
(707)
(243)
(741)
(689)
(264)
14.631.8
3.97.5
57.733.7
1.27.4
100.0
5.45.4
17.4.6
10.739.515.3
1.43.2
40.6100.0
100.018.314.8
3.4.1
3.3
2.11.51.2
1.71.2
.8
11.07.15.1
UND631.1
41.2
20.511.9
7.7
6.712.133.0
16.55.52.1
4.12.01.2
.4
.81.4
.71.52.9
30.215.7
4.9
12.35.81.6
12.27.14.1
2.92.21.6
2.23.65.2
1.32.34.1
1 15 14 45 95 2159 26 23 41 50 208 12 6 7 5 27 16 10 4 3 14 12 13 23 35 56
137 641
29 81 66 120 188 294
(4/1-9/30/04) (10/1/04-3/31/05)0-1MM 1-3MM 3-5MM 5-10MM 10-25MM 25MM & OVER
% % % % % %14.627.4
5.31.5
48.844.0
.36.9
100.0
9.24.6
10.4.1
21.345.621.2
.78.1
24.4100.0
100.042.841.7
1.1.8.3
3.61.5
.8
3.6.9.6
42.76.24.0
UNDUND42.5
70.213.8
5.8
6.519.7
–16.1
5.51.8
–1.2
.51.29.4
.62.0
15.7
50.614.0–9.0
14.32.1
–9.4
9.54.22.3
2.71.8
.8
4.410.118.5
12.926.8
4.67.1
51.439.0
.88.8
100.0
9.07.4
11.7.5
9.738.322.2
.94.2
34.4100.0
100.031.228.1
3.0.7
2.4
2.51.71.0
2.21.4
.7
30.88.95.5
UNDUND85.4
74.216.8
7.8
7.013.5NM
8.72.7
.1
2.01.4
.7
.5
.92.6
.71.43.7
25.18.3
.1
11.93.3
–1.3
13.05.93.3
3.32.21.4
2.24.37.6
2.63.66.9
95992
009
52763
(23)
(25)
(23)
124166
004
52247
(68)
(16)
(69)
(65)
(35)
264368
00
11
142552
(57)
(16)
(57)
(56)
(29)
345577
003
163353
(115)
(44)
(115)
(109)
(57)
385373
018
173045
(176)
(77)
(183)
(174)
(77)
365070
02
12
233346
(268)
(89)
(292)
(262)
(60)
16.129.2
4.06.7
56.134.5
1.18.4
100.0
9.05.9
18.4.6
7.241.117.6
1.33.6
36.4100.0
100.022.919.2
3.7.3
3.5
2.01.41.0
1.71.1
.8
14.28.65.3
UNDUND33.9
26.614.4
7.1
6.817.6NM
12.95.32.0
3.32.11.4
.3
.92.3
.61.96.5
37.820.7
6.0
16.07.92.3
14.48.74.7
3.62.31.4
2.14.56.2
1.83.46.9
16.134.8
2.37.8
60.932.5
.85.7
100.0
5.56.3
18.5.9
8.139.314.4
1.53.3
41.6100.0
100.019.915.9
3.9.1
3.9
2.31.61.2
2.01.4
.8
10.66.74.8
UNDUND
106.1
23.511.0
6.9
5.811.224.2
20.86.21.7
4.32.31.3
.4
.71.4
.71.53.0
35.619.4
3.4
15.76.6
.8
13.48.04.3
3.02.41.6
2.13.65.4
1.83.24.5
13.935.3
3.46.8
59.532.7
1.36.5
100.0
4.95.5
18.61.09.8
39.912.9
1.62.7
43.0100.0
100.015.611.9
3.7.1
3.5
2.21.51.2
1.81.2
.9
9.76.95.0
UND509.8
45.5
21.712.0
8.1
7.111.834.7
18.85.72.1
4.02.11.1
.5
.81.2
.71.52.7
32.417.3
4.8
13.46.11.8
12.07.54.6
2.92.21.7
2.23.54.9
1.21.93.5
14.530.7
4.48.7
58.332.3
1.48.0
100.0
3.44.5
18.1.4
12.338.714.4
1.42.5
43.0100.0
100.012.3
9.03.3–.13.4
2.01.51.2
1.51.2
.9
10.27.35.2
UND175.4
29.7
16.011.1
7.9
6.811.423.5
17.86.93.1
4.52.11.3
.5
.81.3
.81.52.6
26.215.1
6.3
10.55.72.4
11.36.84.2
2.72.11.5
2.03.24.5
.61.32.0
16294M 160330M 266694M 873156M 3086522M 26378167M15547M 93770M 130035M 431031M 1521738M 13954083M
Type of StatementUnqualifiedReviewedCompiled
Tax ReturnsOther
NUMBER OF STATEMENTSASSETS
Cash & EquivalentsTrade Receivables (net)
InventoryAll Other Current
Total CurrentFixed Assets (net)Intangibles (net)
All Other Non-CurrentTotal
LIABILITIESNotes Payable-Short Term
Cur. Mat.-L/T/DTrade Payables
Income Taxes PayableAll Other Current
Total CurrentLong-Term DebtDeferred Taxes
All Other Non-CurrentNet Worth
Total Liabilities & Net Worth
INCOME DATANet Sales
Gross ProfitOperating Expenses
Operating ProfitAll Other Expenses (net)
Profit Before Taxes
RATIOS
Current
Quick
Sales/Receivables
Cost of Sales/Inventory
Cost of Sales/Payables
Sales/Working Capital
EBIT/Interest
Net Profit + Depr., Dep.,Amort./Cur. Mat. L/T/D
Fixed/Worth
Debt/Worth
% Profit Before Taxes/TangibleNet Worth
% Profit Before Taxes/TotalAssets
Sales/Net Fixed Assets
Sales/Total Assets
% Depr., Dep., Amort./Sales
% Officers’, Directors’,Owners’ Comp/Sales
Net Sales ($)Total Assets ($)
© RMA 2005 M = $ thousand MM = $ millionSee Pages 11 through 21 for Explanation of Ratios and Data
334 346 385124 164 16933 87 4021 37 41
117 138 143
629 772 778
4/1/02- 4/1/03- 4/1/04-3/31/03 3/31/04 3/31/05
ALL ALL ALL
% % %
26195663M 28364203M 30781163M12808966M 14343310M 16146204M

CONSTRUCTION – GENERAL—Highway, Street, and Bridge Construction NAICS 237310 (SIC 1611, 1622, 1721)
Comparative Historical Data Current Data Sorted By Sales
.25
.551.13
1.773.796.29
23.315.710.3
11.05.92.6
11.06.02.9
5.51.6
–2.1
4.51.9
.8
21.48.93.2
29.4.0
–19.4
23.74.4
–12.3
17.52.2
–7.4
18.86.1
–5.6
20.04.3
–8.9
22.65.3
–9.2
69.8–9.1
–60.6
19.32.4
–11.1
17.05.2
–6.2
.61.53.3
.28
.581.16
2.154.126.56
24.215.4
9.4
9.85.31.0
10.05.41.2
5.41.3
–2.8
4.01.6
.3
17.87.41.4
28.7.3
–14.2
25.48.4
–9.2
18.55.6
–6.3
19.15.6
–5.3
20.54.6
–8.7
21.54.5
–8.4
85.1.0
–62.5
14.31.4
–11.6
19.75.7
–2.9
.61.53.2
Baa2Baa3
Ba1
(506)
(493)
(290)
(530)
(532)
(532)
(509)
(532)
Baa3Baa3
Ba2
(613)
(600)
(345)
(643)
(642)
(644)
(622)
(640)
(595)
A3Baa2Baa3
(651)
(632)
(360)
(675)
(675)
(645)
(673)
.20
.30
.70
1.312.474.21
24.015.3
9.8
9.95.31.7
10.15.81.9
5.41.8
–2.1
4.31.8
.5
22.98.82.4
48.09.1
–12.5
30.511.1–5.7
21.98.9
–3.0
24.37.9
–2.7
29.611.4–4.5
31.611.7–5.3
131.329.3
–39.0
17.91.7
–10.3
22.57.8
–1.1
.61.53.1
1 13 12 42 87 1918 23 20 38 45 184 9 6 7 1 27 13 9 3 1 12 9 8 19 31 46
122 554
22 67 55 109 165 258
(4/1-9/30/04) (10/1/04-3/31/05)0-1MM 1-3MM 3-5MM 5-10MM 10-25MM 25MM & OVER
% % % % % %.37
1.183.02
3.396.56
11.95
71.242.619.7
23.914.1–1.5
24.813.8–1.5
13.06.6
–11.0
4.61.5–.2
14.17.8–.2
46.011.5
–14.5
24.15.7
–7.8
30.31.6
–19.9
48.1–.4
–18.3
70.110.6
–11.7
153.532.5
–78.9
24.5.0
–20.0
47.85.5
–15.5
.71.8
11.3
.22
.611.51
1.983.816.87
42.830.018.9
11.26.7
.8
11.16.8
.1
4.8.3
–5.9
3.51.2–.1
10.54.8
.5
7.9–3.0
–32.7
38.21.8
–18.6
23.72.1
–15.2
24.33.1
–18.8
28.410.2–9.9
37.86.9
–12.0
129.435.4
–71.7
21.2–7.4
–34.0
19.63.4
–10.5
.52.17.5
(15)
Baa3Ba2
B1
(21)
(21)
(21)
(57)
Baa1Baa3
Ba2
(61)
(57)
(24)
(66)
(66)
(63)
(47)
Baa1Baa3
Ba1
(50)
(51)
(25)
(53)
(100)
A3Baa2Baa3
(108)
(104)
(41)
(106)
(107)
(149)
A3Baa2Baa3
(159)
(91)
(160)
(227)
A3Baa1Baa3
(246)
(240)
(172)
(242)
(257)
.22
.361.02
1.723.375.12
28.821.414.3
14.15.43.0
15.56.02.8
7.71.2
–2.5
4.31.9
.5
15.37.02.3
106.4.0
–26.6
41.38.3
–13.0
33.88.5
–6.4
34.75.2
–7.4
35.219.9
–.6
37.620.6
–.2
263.652.9
–32.3
20.0.9
–14.3
24.34.9
–6.1
.61.42.5
.20
.28
.72
1.312.424.37
27.518.112.1
10.65.82.5
10.75.62.4
5.01.6
–2.1
4.41.6
.7
27.09.93.5
34.710.2
–17.2
38.18.9
–10.4
21.06.5
–6.2
29.014.4
–.9
39.916.9–3.2
35.712.7–6.4
171.947.7
–27.0
17.7–.5
–16.6
29.412.6
.3
.71.53.1
.20
.29
.68
1.282.083.90
22.014.610.2
10.25.61.2
10.35.81.4
5.52.9
–2.1
4.12.2
.4
24.210.4
1.2
52.76.9
–13.5
37.211.7
–.9
25.79.7–.4
26.47.1
–3.1
33.210.1–6.2
33.411.1–6.2
156.334.4
–45.4
17.11.3
–8.0
24.47.8
–1.9
.51.42.6
.19
.26
.55
1.241.983.48
16.812.2
7.7
8.74.71.8
8.55.42.1
4.91.7
–1.6
5.21.9
.7
22.911.4
3.3
43.612.1–7.7
25.812.4
.1
19.610.3
1.6
19.88.7
.5
25.110.2–2.7
26.69.8
–2.6
99.213.0
–31.7
17.63.7
–7.6
18.28.51.0
.51.53.1
13549M 134034M 220348M 797515M 2706326M 23086168M13320M 77905M 105323M 403301M 1302195M 12092322M
Type of StatementUnqualifiedReviewedCompiled
Tax ReturnsOther
Sales SizeNumber of Statements
EXPECTED DEFAULT FREQUENCY
Risk Calc EDF(1 yr)
Moodys EDF Risk Calc EDFRating (see note) (5 yr)
CASH FLOW MEASURES
Cash fromTrading/Sales
Cash afterOperations/Sales
Net Cash after Operations/Sales
Cash after DebtAmortization/Sales
Debt ServiceP&I Coverage
Interest Coverage(Operating Cash)
∆ Inventory
∆ Total Current Assets
∆ Total Assets
∆ Retained Earnings
∆ Net Sales
∆ Cost of Goods Sold
∆ Profit beforeInt. & Taxes
∆ Depr./Depl./Amort.
RATIOS
SustainableGrowth Rate
Funded Debt/EBITDA
Net Sales ($)Total Assets ($)
% % % % % %
© RMA 2005 M = $ thousand MM = $ millionSee pages 6 through 18 for explanation of ratios and data. Note: The ratings are Moody’s.edf rating (e.g. Ba1.edf) and not Moody’s Investor Services Long-Term Bond Ratings.
If a number of statements appears for the Risk Calc EDF (1 yr), it also applies to the (5 yr).
283 313 346109 151 15226 33 2916 30 3499 118 115
533 645 676
4/1/02 4/1/03 4/1/043/31/03 3/31/04 3/31/05
ALL ALL ALL
% % %
20883685M 22922871M 26957940M9946686M 11516356M 13994366M
% % %

BES Required Rates of Return

BES Required Rates of Return Database
Sample Paving & Excavation, Inc.
Minimum MaximumSIC Code Date City State Required Rate Required Rate Asset Value
__________________________________________________________________________________1611 12-27-02 South Coos Bay OR 26.0% 35.0% $2,170,0001611 09-15-03 South Coos Bay OR 23.0% 25.0% $1,990,0001611 07-31-98 Ft Worth TX 25.0% 29.0% $300,0001611 12-15-98 Cedar Hill TX 22.0% 24.0% $450,0001611 12-15-98 Ft Worth TX 19.0% 25.0% $40,0001611 03-04-98 Houston TX 20.0% 24.0% $670,0001611 11-10-97 Alamosa CO 22.0% 29.0% $40,0001611 07-10-96 Buena Vista CO 25.0% 28.0% $2,260,0001611 11-01-00 Billings MT 25.0% 28.0% $1,100,0001611 11-06-97 Cumming GA 19.0% 22.0% $1,520,0001611 03-04-98 Houston TX 20.0% 22.0% $670,0001611 12-08-03 Broomfield CO 22.5% 25.0% $1,270,0001794 12-29-00 Amsterdam NY 19.0% 26.0% $170,0001794 08-13-01 Blackburg SC 21.0% 24.0% $1,660,0001794 07-10-02 New Port Richey FL 23.0% 29.0% $1,430,0001794 12-29-04 Columbia SC 19.0% 26.0% $1,480,0001794 11-12-03 Pulaski WI 22.0% 24.5% $960,0001794 09-15-05 Topeka KS 17.0% 31.0% $160,0001794 03-14-05 Brooksville FL 14.0% 16.0% $980,0001794 03-14-05 Cincinnati OH 12.0% 14.0% $380,0001794 12-31-98 Spring TX 26.0% 28.0% $1,810,0001799 08-02-04 Jacksonville FL 22.5% 24.0% $430,0001799 00-00-97 Las Vegas NV 26.0% 28.0% $45,0001799 11-18-96 Robbinsville NJ 19.0% 28.0% $1,250,0001799 12-22-99 Laurel MD 21.0% 24.0% $20,0001799 05-11-98 Redmond WA 21.0% 25.0% $110,0001799 10-16-01 Gansevoort NY 25.0% 29.0% $200,0001799 10-03-03 Houston TX 20.0% 23.0% $460,0001799 12-04-03 Beltsville MD 22.5% 24.0% $260,0001799 08-06-04 Washington DC 22.5% 24.0% $180,0001799 12-00-99 Wichita KS 25.0% 28.0% $60,000
1611/0200 09-18-00 Tyngsboro MA 21.0% 23.0% $270,000
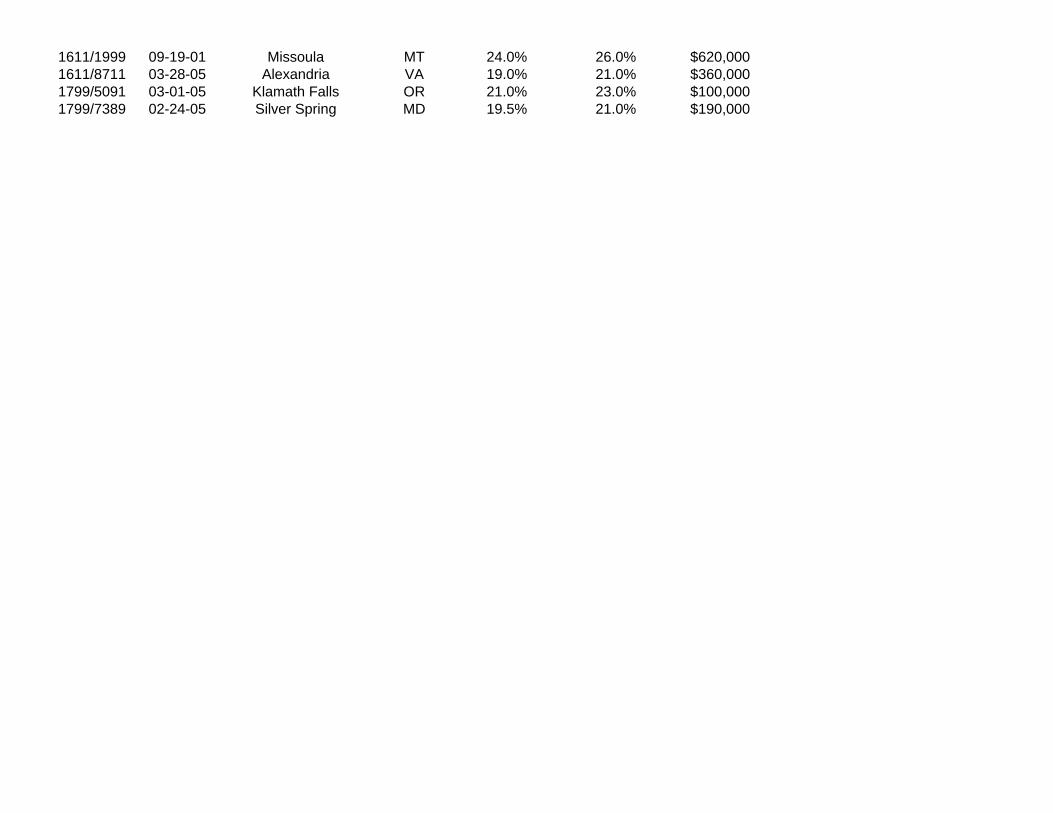
1611/1999 09-19-01 Missoula MT 24.0% 26.0% $620,0001611/8711 03-28-05 Alexandria VA 19.0% 21.0% $360,0001799/5091 03-01-05 Klamath Falls OR 21.0% 23.0% $100,0001799/7389 02-24-05 Silver Spring MD 19.5% 21.0% $190,000

Comparable Sales

Company Info
Sample Paving & Excavation, Inc.222 Westheimer StreetHouston, Texas 77539Mr. James G. Sample
Business Evaluation SystemsMr. George D. Abraham
14 February 2006Contemplation of Sale

RatiosPRICE to REVENUE Ratio PRICE to SDE Ratio
High 0.978 High 9.009Low 0.036 Low 0.476Median 0.403 Median 1.911Mean 0.423 Mean 2.197
Selected P/R Ratio 0.40 Selected SDE 1.91Company Net Revenue $0 Company SDE $0
The valuation will be based on the Price to Revenue ratio

0200400600800
1,0001,2001,4001,6001,8002,0002,2002,4002,6002,8003,0003,2003,4003,6003,8004,0004,2004,4004,6004,8005,0005,2005,4005,6005,8006,0006,2006,4006,6006,8007,000
0 100 200 300 400 500 600 700 800 900 1,000 1,100 1,200 1,300 1,400
SA
LE P
RIC
ESALE PRICE to SDESALE PRICE to SDE
SDE
Regression Line: Y = -247.91 + 3.43 X R Squared = 0.70
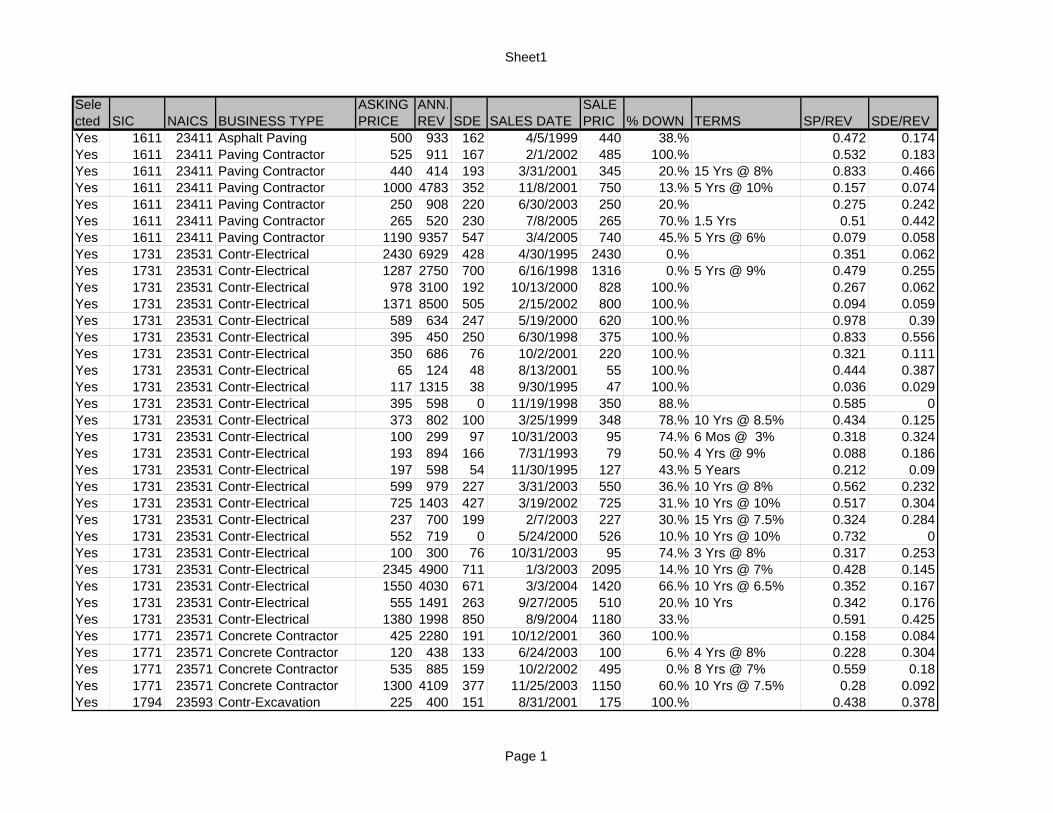
Sheet1
Selected SIC NAICS BUSINESS TYPE
ASKING PRICE
ANN. REV SDE SALES DATE
SALE PRIC % DOWN TERMS SP/REV SDE/REV
Yes 1611 23411 Asphalt Paving 500 933 162 4/5/1999 440 38.% 0.472 0.174Yes 1611 23411 Paving Contractor 525 911 167 2/1/2002 485 100.% 0.532 0.183Yes 1611 23411 Paving Contractor 440 414 193 3/31/2001 345 20.% 15 Yrs @ 8% 0.833 0.466Yes 1611 23411 Paving Contractor 1000 4783 352 11/8/2001 750 13.% 5 Yrs @ 10% 0.157 0.074Yes 1611 23411 Paving Contractor 250 908 220 6/30/2003 250 20.% 0.275 0.242Yes 1611 23411 Paving Contractor 265 520 230 7/8/2005 265 70.% 1.5 Yrs 0.51 0.442Yes 1611 23411 Paving Contractor 1190 9357 547 3/4/2005 740 45.% 5 Yrs @ 6% 0.079 0.058Yes 1731 23531 Contr-Electrical 2430 6929 428 4/30/1995 2430 0.% 0.351 0.062Yes 1731 23531 Contr-Electrical 1287 2750 700 6/16/1998 1316 0.% 5 Yrs @ 9% 0.479 0.255Yes 1731 23531 Contr-Electrical 978 3100 192 10/13/2000 828 100.% 0.267 0.062Yes 1731 23531 Contr-Electrical 1371 8500 505 2/15/2002 800 100.% 0.094 0.059Yes 1731 23531 Contr-Electrical 589 634 247 5/19/2000 620 100.% 0.978 0.39Yes 1731 23531 Contr-Electrical 395 450 250 6/30/1998 375 100.% 0.833 0.556Yes 1731 23531 Contr-Electrical 350 686 76 10/2/2001 220 100.% 0.321 0.111Yes 1731 23531 Contr-Electrical 65 124 48 8/13/2001 55 100.% 0.444 0.387Yes 1731 23531 Contr-Electrical 117 1315 38 9/30/1995 47 100.% 0.036 0.029Yes 1731 23531 Contr-Electrical 395 598 0 11/19/1998 350 88.% 0.585 0Yes 1731 23531 Contr-Electrical 373 802 100 3/25/1999 348 78.% 10 Yrs @ 8.5% 0.434 0.125Yes 1731 23531 Contr-Electrical 100 299 97 10/31/2003 95 74.% 6 Mos @ 3% 0.318 0.324Yes 1731 23531 Contr-Electrical 193 894 166 7/31/1993 79 50.% 4 Yrs @ 9% 0.088 0.186Yes 1731 23531 Contr-Electrical 197 598 54 11/30/1995 127 43.% 5 Years 0.212 0.09Yes 1731 23531 Contr-Electrical 599 979 227 3/31/2003 550 36.% 10 Yrs @ 8% 0.562 0.232Yes 1731 23531 Contr-Electrical 725 1403 427 3/19/2002 725 31.% 10 Yrs @ 10% 0.517 0.304Yes 1731 23531 Contr-Electrical 237 700 199 2/7/2003 227 30.% 15 Yrs @ 7.5% 0.324 0.284Yes 1731 23531 Contr-Electrical 552 719 0 5/24/2000 526 10.% 10 Yrs @ 10% 0.732 0Yes 1731 23531 Contr-Electrical 100 300 76 10/31/2003 95 74.% 3 Yrs @ 8% 0.317 0.253Yes 1731 23531 Contr-Electrical 2345 4900 711 1/3/2003 2095 14.% 10 Yrs @ 7% 0.428 0.145Yes 1731 23531 Contr-Electrical 1550 4030 671 3/3/2004 1420 66.% 10 Yrs @ 6.5% 0.352 0.167Yes 1731 23531 Contr-Electrical 555 1491 263 9/27/2005 510 20.% 10 Yrs 0.342 0.176Yes 1731 23531 Contr-Electrical 1380 1998 850 8/9/2004 1180 33.% 0.591 0.425Yes 1771 23571 Concrete Contractor 425 2280 191 10/12/2001 360 100.% 0.158 0.084Yes 1771 23571 Concrete Contractor 120 438 133 6/24/2003 100 6.% 4 Yrs @ 8% 0.228 0.304Yes 1771 23571 Concrete Contractor 535 885 159 10/2/2002 495 0.% 8 Yrs @ 7% 0.559 0.18Yes 1771 23571 Concrete Contractor 1300 4109 377 11/25/2003 1150 60.% 10 Yrs @ 7.5% 0.28 0.092Yes 1794 23593 Contr-Excavation 225 400 151 8/31/2001 175 100.% 0.438 0.378
Page 1

Sheet1
Yes 1794 23593 Contr-Excavation 300 0 336 10/31/1996 300 90.% 3 Yrs @ 10% 0 0Yes 1794 23593 Contr-Excavation 155 372 71 4/30/2003 150 50.% 3 Yrs @ 7% 0.403 0.191Yes 1794 23593 Contr-Excavation 7850 #### 1300 9/30/1999 6850 10.% 10 Yrs @ 9.5% 0.612 0.116Yes 1794 23593 Site Excavation 300 425 138 11/17/2003 300 79.% 3 Yrs @ 6.5% 0.706 0.325Yes 1794 23593 Contr-Excavation 1000 1237 111 6/23/2005 1000 0.% 0.808 0.09Yes 1799 23599 Fencing Contractor 369 1485 170 1/5/2000 325 69.% 10 Yrs @ 10.5% 0.219 0.114Yes 1799 23599 Fencing Contractor 590 984 282 8/21/2001 580 100.% 0.589 0.287Yes 1799 23599 Contr-Specialty 516 1936 185 7/22/2002 516 100.% 0.267 0.096Yes 1799 23599 Fencing Contractor 600 1300 110 9/26/2001 475 100.% 0.365 0.085Yes 1799 23599 Fencing Contractor 166 1171 104 8/29/2002 156 100.% 0.133 0.089Yes 1799 23599 Fencing Contractor 850 926 109 12/20/2001 100 100.% 0.108 0.118Yes 1799 23599 Fencing Contractor 595 1400 485 1/16/1999 870 90.% 0.621 0.346Yes 1799 23599 Fencing Contractor 425 1032 164 4/14/2003 410 75.% 0.397 0.159Yes 1799 23599 Fencing Contractor 395 605 141 9/30/1996 270 67.% 2 Yrs @ Pr+2% 0.446 0.233Yes 1799 23599 Fencing Contractor 1193 2100 425 5/31/2004 1193 63.% 15 vYrs @ 7% 0.568 0.202Yes 1799 23599 Fencing Contractor 125 452 81 4/30/1993 100 55.% 5 Yrs @ 9% 0.221 0.179Yes 1799 23599 Parking Lot Stripping 120 145 89 8/28/2003 90 51.% 5 Yrs 0.621 0.614Yes 1799 23599 Contr-Specialty 218 506 97 7/15/2002 188 50.% 5 Yrs @ 10% 0.372 0.192Yes 1799 23599 Fencing Contractor 675 1299 397 6/3/1998 625 43.% 10 Yrs @ 8% 0.481 0.306Yes 1799 23599 Fencing Contractor 200 580 74 2/28/1996 75 33.% 5 Yrs @ 8% 0.129 0.128Yes 1799 23599 Fencing Contractor 147 775 122 9/27/2001 147 30.% 10 Yrs @ 7.5% 0.19 0.157Yes 1799 23599 Fencing Contractor 1120 1288 272 7/6/1998 685 26.% 12 Yrs @ 7.5% 0.532 0.211Yes 1799 23599 Fencing Contractor 139 688 55 9/18/1995 120 25.% 10 Yrs @ 9% 0.174 0.08Yes 1799 23599 Parking Lot Maintenanc 149 176 78 9/15/2000 149 20.% 5 Yrs @ 9% 0.847 0.443Yes 1799 23599 Parking Lot Maintenanc 72 76 36 1/31/1994 56 20.% 5 Yr @ 9% 0.737 0.474Yes 1799 23599 Contr-Specialty 278 310 168 7/18/2002 258 18.% 10 Yrs @ 10.5% 0.832 0.542Yes 1799 23599 Contr-Specialty 780 1173 190 8/8/2002 765 13.% 10 Yrs @ 9% 0.652 0.162Yes 1799 23599 Contr-Fencing 325 880 169 3/12/2004 215 24.% 5 Yrs @ 7% 0.244 0.192Yes 1799 23599 Fencing Contractor 104 395 30 1/7/2005 96 100.% 0.243 0.076
Page 2

Sheet1
SP/SDEINVENTORY
FF&E
RENT % LOCATION AREA
Franchise Royalty
Days on Market
Number of Employees
2.716 0 270 1.8% West Michigan MW 459 2.904 0 0 0.% North Carolina E 170 91.788 0 185 0.% Texas W 220 52.131 5 140 1.1% Florida S 216 71.136 0 250 0.% Phoeniz, AZ W 0 1.152 0 30 0.% South Florida S 142 101.353 10 500 0.3% Florida S No 264 615.678 70 100 0.3% Eastern WA W 0
1.88 13 119 0.% Altamonte Springs, FL S 0 4.313 20 172 0.% Tampa Bay, FL S 90 1.584 25 240 0.3% Georgia S 560 62
2.51 10 16 0.1% Southeast Florida S 133 31.5 30 70 0.% Phoeniz, AZ W 157
2.895 8 127 2.2% Florida S 335 8 FT/1 PT1.146 1 12 0.% Florida S 240 11.237 3 110 0.% Grand Junction, CO W 0
0 17 180 2.2% Central Florida S 223 3.48 107 200 0.% Boise, ID W 153
0.979 0 50 0.% South Florida S No 530 30.476 7 35 1.% Ventura, CA W 0 2.352 3 90 0.% Rocky Mountains, CO W 0 2.423 20 0 3.9% Florida S No 71 111.698 0 11 0.6% Florida S 193 101.141 3 60 0.% Florida S No 306 5
0 28 359 0.% Boise, ID W 94 1.25 0 50 1.% Florida S 530 3
2.947 55 500 0.% Georgia S 193 502.116 0 187 0.7% Georgia S 171 451.939 40 39 4.% South Florida S 731 141.388 20 11 0.8% Florida S No 342 15 Ft/1 PT1.885 1 0 0.% San Jose, CA W 192 0.752 0 19 0.% South Florida S No 72 43.113 1 298 10.% Orange County, CA W 455 9
3.05 0 422 0.7% Florida S 88 21.159 0 85 1.% Central Florida S 86 7
Page 3

Sheet1
0.893 0 240 0.% Boise, ID W 0 2.113 0 97 0.% Florida S No 86 55.269 150 3700 0.% Southwest Florida S 700 2.174 0 120 0.6% Florida S 39 79.009 0 610 0.% Minnesota MW No 155 1.912 70 70 2.% Central Florida S 160 2.057 25 275 0.% Florida S 706 2.789 64 300 0.% Georgia S 52 11 FT/3 PT4.318 100 200 0.% Colorado W 229 10
1.5 24 55 1.% Colorado W 255 60.917 33 52 4.5% Georgia S 254 41.794 5 150 4.% Denver, CO W 20
2.5 20 100 1.% Florida S No 102 111.915 5 60 6.% Rocky Mtns, CO W 98 2.807 157 650 0.% Colorado W 90 201.235 1 44 3.% Houston, TX W 0 1.011 0 20 0.% Colorado W No 151 1 FT/1 PT1.938 7 51 3.3% Florida S 300 81.574 75 120 1.6% Colorado W 220 1.014 10 31 1.7% So Carolina E 0 1.205 3 5 0.% Texas W 300 102.518 80 80 3.% Knoxville, TN S No 123 2.182 20 30 2.% Spokane, WA W 158
1.91 0 20 0.% Central Florida S 165 1.556 0 43 3.% Minneapolis, MN MW 0 1.536 2 60 3.% Florida S 116 74.026 70 80 2.6% Florida S 150 111.272 0 41 1.% Florida S No 359 7
3.2 14 60 2.% Colorado W No 95
Page 4

U. S. Economic Outlook

U. S. Economic Outlook Fourth Quarter 2005 The U.S. economy, hampered by rising interest rates and surging energy prices, grew at a its slowest pace in three years during the fourth quarter of 2005. Although the fourth-quarter figure was much lower than expected, the gross domestic product (GDP), which is the broadest measure of the economy's health, still grew for the 17th consecutive quarter. While the Fed is still expected to increase interest rates at the beginning of 2006, inflationary pressures in the fourth quarter of 2005 remained moderate. The U.S. Department of Commerce reported that the nation's economy increased at an annual rate of 1.1 percent in the fourth quarter of 2005, as indicated by the GDP, and marked the slowest pace since the last quarter in 2002. This is down from the 4.1 percent rate that was posted in the third quarter of this year, as can be seen in Exhibit 1. The fourth-quarter GDP marked the end of the streak of eight straight quarters of GDP growth between 3 and 4.5 percent, which was the longest streak of such consistent growth since World War II. In 2005, the economy grew by 3.5 percent, compared to an increase of 4.2 percent in 2004 and 2.7 percent in 2003. The deceleration in fourth-quarter GDP growth was largely contributed to the slowdown in consumer and defense spending, business investment, housing construction, and the widening trade deficit.
Consumer spending, which accounts for two-thirds of all economic activity in the United States, increased by 1.1 percent during the fourth quarter of 2005. This compares with a 4.1 percent increase in the previous quarter and a 3.4 percent gain in the second quarter of this year. The fourth quarter figure was the lowest growth rate since a 0.5 percent increase in the first quarter of 2001. In 2005, consumer spending rose by 3.6 percent, compared with a 3.9 percent increase in 2004 and a 2.9 percent increase in 2003.
EXHIBIT 1: Real Gross Domestic Product 4Q 2001-4Q 2005
-2.00%
0.00%
2.00%
4.00%
6.00%
8.00%
4Q20
01
1Q20
02
2Q20
02
3Q20
02
4Q20
02
1Q20
03
2Q20
03
3Q20
03
4Q20
03
1Q20
04
2Q20
04
3Q20
04
4Q20
04
1Q20
05
2Q20
05
3Q20
05
4Q20
05
Year
Ann
ual G
row
th
Source of data: U.S. Department of Commerce

2
Consumer expenditures only increased the fourth-quarter GDP by 0.79 percentage points. This compares with a GDP increase of 2.85 percentage points in the previous quarter and a 2.35 percentage point increase in the second quarter of 2005.
EXHIBIT 2: HISTORICAL ECONOMIC DATA AND FORECASTS 2001-2015
HISTORICAL
DATA CONSENSUS
FORECASTS**
2001 2002 2003 2004 2005 2006 2007 2007-2010
2011-2015
Real GDP* 0.80 1.60 2.70 4.20 3.50 3.40 3.10 3.18 3.10
Industrial Production* -
3.60 -
0.30 0.00 4.10 3.10 3.40 3.60 3.45 3.40 Personal Consumption* 2.50 2.70 2.90 3.90 3.60 2.80 3.00 2.95 2.80 Nonresidential Investment*
-4.20
-9.20 1.30 9.40 8.50 8.30 6.40 5.53 5.30
Government Spending* 3.40 4.40 2.80 2.20 1.70 2.50 1.70 NA NA CPI* 2.80 1.60 2.30 2.70 3.30 2.80 2.30 2.40 2.40 Unemployment Rate* 4.70 5.80 6.00 5.50 5.10 4.90 4.90 NA NA Housing Starts (millions) 1.60 1.71 1.85 1.95 2.06 1.89 1.80 NA NA Source of historical data: www.bea.gov, www.bls.gov, www.census.gov, www.federalreserve.com Source of consensus forecasts: Consensus Forecasts - USA, January 9, 2006, www.consensuseconomics.com Notes: *Numbers are based on percent change from preceding period, seasonally adjusted rates. **Forecast numbers are based on average percent change on previous calender year. *** Long term forecasts last updated in Consensus Forecasts - USA, October 10, 2005. Personal Consumption includes spending on services, durable, and nondurable goods. Government Spending includes federal, state, and local government spending.
During the fourth quarter of 2005, government spending decreased at a rate of 2.4 percent, compared with an increase of 2.9 percent during the previous quarter and a 2.5 percent increase in the second quarter of this year. The fourth quarter figure was the first decrease in government spending since a 0.3 percent decline in the first quarter of 2003. In 2005, government spending increased by 1.7 percent, which is down from a 2.2 percent increase in 2004 and a 2.8 percent increase in 2003. During the fourth quarter, federal government spending decreased by 7.0 percent, compared with a 7.4 percent increase in the previous quarter. National defense spending declined by 13.1 percent during the fourth quarter, following a large increase of 10.0 percent in the previous quarter and a 3.7 percent gain in the second quarter of this year. In 2005, national defense spending rose by 2.3 percent, which is down from a 7.0 percent increase in 2004 and an 8.8 percent increase in 2003. State and local government spending increased by 0.4 percent in the fourth quarter of 2005, which was up slightly from the 0.2 percent increase in the previous quarter.

3
Business investments continued to grow during the fourth quarter of 2005, but at its slowest pace since the first quarter of 2003. Business spending, or nonresidential fixed investment, increased at a rate of 2.8 percent during the fourth quarter after rising by 8.5 percent in the previous quarter and by 8.8 percent in the second quarter of this year. In 2005, business spending rose by 8.5 percent, compared to an increase of 9.4 percent in 2004 and a 1.3 percent increase in 2003. Business expenditures on equipment and software increased by 3.5 percent during the fourth quarter, which follows a 10.6 percent rise in the previous quarter and a 10.9 percent increase in the second quarter of 2005. Business spending on structures increased slightly by 0.7 percent in the fourth quarter, compared to a 2.2 percent increase in the third quarter and a 2.7 percent rise in the second quarter of this year. During the fourth quarter of 2005, companies increased inventories after two straight quarters of decreases. The rise in private business inventories increased the fourth-quarter GDP by 1.45 percentage points after decreasing the previous quarter’s GDP by 0.43 percentage points. Businesses increased their inventories of unsold goods at a rate of $25.7 billion in the fourth quarter, following decreases of $13.3 billion in the previous quarter and $1.7 billion in the second quarter of this year. The third quarter inventory drop was the largest since the fourth quarter of 2001 when they fell at an $86.7 billion rate. For the ninth time in the last 10 quarters, the trade deficit provided a negative contribution to the GDP. Exports, which grew for the tenth straight quarter, rose by 2.4 percent in the fourth quarter, following an increase of 2.5 percent in the previous quarter and a 10.7 percent increase in the second quarter of 2005. The fourth quarter increase in exports is the slowest since a 2.1 percent decline in the second quarter of 2003. In 2005, exports rose by 6.7 percent, compared with an 8.4 percent increase in 2004 and a 1.8 percent increase in 2003. The U.S. dollar’s weakness in recent years has helped boost exports, making U.S. goods cheaper overseas. Foreign imports jumped by 9.1 percent during the fourth quarter of 2005 after an increase of 2.4 percent in the previous quarter. In 2005, imports increased by 6.2 percent, compared with a 10.7 percent rise in 2004 and a 4.6 percent increase in 2003. During the fourth quarter of 2005, the trade deficit increased from last quarter's annualized rate of $730.4 billion in real terms to $784.1 billion. The trade deficit decreased the fourth-quarter GDP by 1.18 percentage points after only decreasing the previous quarter's GDP by 0.12 percentage points. Despite rising gasoline prices, inflationary pressures remained in check during the fourth quarter of 2005. According to the U.S. Department of Commerce, the price index for gross domestic purchases, which measures prices paid by U.S. residents, increased by 3.3 percent in the fourth quarter. This compares with an increase of 4.2 percent in the previous quarter. Excluding food and energy prices, the price index for gross domestic purchases increased by 2.9 percent in the fourth quarter, compared with a 2.5 percent increase in the previous quarter.

4
The U.S. Department of Labor reported that the Producer Price Index for Finished Goods, which measures inflationary pressures before they reach consumers, increased by 0.9 percent in December 2005, following a 0.7 percent decline in November and a 0.7 percent rise in October. In 2005, the price for finished goods rose by 5.4 percent, compared with a 4.2 percent increase in 2004 and a 4.0 percent increase in 2003. The costs of intermediate goods rose slightly in December by 0.2 percent, compared to a decrease of 1.2 percent in November and an increase of 3.0 percent in October. The cost for intermediate goods rose by 8.4 percent in 2005, following a 9.2 percent increase in 2004 and a 3.9 percent increase in 2003. Finished goods prices other than food and energy rose by 0.1 percent in December, after increasing by 0.1 percent in November and decreasing by 0.3 percent in October. Finished consumer food prices increased by 0.9 percent in December, compared with an increase of 0.5 percent in November and a slight decrease of 0.1 percent in October. The Department of Labor reported that the Consumer Price Index for All Urban Consumers (CPI-U) decreased by 0.4 percent in December 2005, but is 3.4 percent higher than its level one year earlier. While the Consumer Price Index for Urban Wage Earners and Clerical Workers (CPI-W) is 3.5 percent higher than one year ago, the index decreased by 0.5 percent in December. At the end of the fourth quarter of 2005, a barrel of light crude oil sold at $61.04 per barrel, while heating oil and unleaded gasoline closed at about $1.73 and $1.71 per gallon, respectively. At the end of the third quarter, a barrel of light crude oil traded at $66.24, while heating oil and unleaded gasoline traded at $2.07 and $2.14, respectively. A year ago, the prices were $43.45 for light crude oil, $1.23 for heating oil, and $1.09 for unleaded gasoline. Energy goods prices grew by 3.1 percent in December, following a
EXHIBIT 3: Key Economic Variables Actual 2001-2005 and Forecast 2006-2015
-4.00
-2.00
0.00
2.00
4.00
6.00
2001 2002 2003 2004 2005 2006 2007 2007-2010 2011-2015
Year
Perc
ent p
er y
ear
Real GDP
Industrialproduction
Personalconsumption
Consumer priceindex
Sources of data: U.S. Department of Commerce, Consensus Forecasts - USA, October 10, 2005 and January 9, 2006, www.consensuseconomics.com.

5
4.0 percent decrease in the previous month. Prices for crude oil dropped in December by 2.3 percent, following a decrease of 1.2 percent in November and an increase of 6.7 percent in October. Crude materials for further processing rose by 22.1 percent in 2005, compared to a 17.4 percent increase in 2004 and a 19.5 percent increase in 2003.
Exhibit 4. Fourth Quarter 2004 Compared to Fourth Quarter 2005 As feared by the markets and economists, the Federal Reserve Board (FRB) continued to raise its target for the federal funds rate by a quarter of a percent at each of its two meetings in the fourth quarter of 2005. The FRB started to raise the federal funds rate in June 2004, after it had been stable at 1.0 percent for a year before that. Since June 2004, the FRB raised its target short-term rate thirteen times—each time by a quarter of a percent— up to 4.25 percent at the end of the fourth quarter of 2005. The federal funds rate is the interest rate at which a commercial bank lends immediately available funds in balances at the Federal Reserve to another commercial bank. The Federal Open Market Committee (FOMC) met twice during the fourth quarter —November 1 and December 13—and at both meetings decided to raise the federal funds rate by a quarter percent to 4.0 percent and 4.25 percent, respectively. At both meetings, the FOMC noted that, although the core inflation has stayed relatively low in recent months and the long-term inflation expectations remain contained, the collective rise in energy – among other costs - has the potential to add to inflation pressures. The FOMC press release, dated November 1, stated, “The cumulative rise in energy and other costs has the potential to add to inflation pressures; however, core inflation has been relatively low in recent months and longer-term inflation expectations remain contained.” The increases in the federal funds rate are expected to have an impact on other interest rates such as credit card rates, adjustable-rate mortgage rates and home equity lines of credit, as well as money-market account and certificate of deposit rates.
Crude OilHeating Oil
Gasoline
$0.00
$0.50
$1.00
$1.50
$2.00
20042005

6
Also during the fourth quarter, the Board of Governors of the Federal Reserve System (FRB) voted twice to raise the discount rate by a quarter percent to 5.0 percent and then to 5.25 percent. The FRB started to raise the federal funds rate in June 2004, after it had been stable at 2.0 percent for a year before that. The discount rate is the interest rate a commercial bank is charged to borrow funds, typically for a short period, directly from a Federal Reserve Bank. The board of directors of each Reserve Bank establishes the discount rate every 14 days, subject to the approval of the Board of Governors. During the fourth quarter of 2005, the unemployment rate remained steady. The unemployment rate was at 5.0 percent in the fourth quarter, remaining unchanged from the rate posted in the previous quarter. The number of unemployed persons was 7.455 million in the fourth quarter, compared with 7.503 million in the third quarter of 2005. During the fourth quarter, the construction, manufacturing, education and health services, and professional and business services sectors continued to add jobs, while retail trade employment was down slightly from the previous quarter. During the fourth quarter of 2005, manufacturing employment increased by 10,000 jobs, with the majority of the job gains occurring in the component industries, including wood products and computer and electronic products. The construction industry continued to trend upward, adding 62,000 jobs over the quarter and 246,000 jobs in 2005. Employment in professional and business services continued to increase, adding 118,000 jobs during the fourth quarter. The government added 30,000 jobs in the fourth quarter, while the leisure and hospitality industry remained unchanged over the same time period. The education and health services sector added 59,000 jobs in the fourth quarter and expanded by 271,000 jobs in 2005. The retail trade industry, which was hampered by less-than-usual seasonal hiring by general merchandise stores, lost 40,000 jobs over the fourth quarter. Average hourly earnings increased to $16.30 in the fourth quarter of 2005 from $16.17 in the previous quarter. Average weekly earnings also increased to $550.51 in the fourth quarter from $545.36 in the third quarter. Consumer spending, which accounts for two-thirds of overall economic growth, increased at a rate of 1.1 percent during the fourth quarter of 2005, down from a 4.1 percent increase in the previous quarter and a 3.4 percent gain in the second quarter of this year. The fourth quarter consumer spending rate is the slowest growth rate since a 0.5 percent increase in the first quarter of 2001. Consumer spending on durable goods— items meant to last three or more years— dropped by 17.5 percent in the fourth quarter of 2005, mostly due to plunging automobile sales. This compares with a 9.3 percent increase in the previous quarter and a 7.9 percent rise in the second quarter. In 2005, consumer spending on durable goods rose by 4.4 percent, compared with a 6.0 percent increase in 2004 and a 6.6 percent increase in 2003. Spending on nondurable goods, such as clothing and food, increased by 5.1 percent in the fourth quarter of 2005. This compares to a 3.5 percent jump in the previous quarter and a 3.6 percent increase in the second quarter of this year. In 2005, consumer spending on

7
nondurable goods jumped by 4.4 percent, compared with a 4.7 percent increase in 2004 and a 3.2 percent increase in 2003. Service expenditures increased by 3.2 percent in the fourth quarter, compared to a 3.3 percent increase in the previous quarter. According to the U.S. Department of Commerce, retail and food service sales rose 0.6 percent in the fourth quarter of 2005, compared to a 1.6 percent increase in the previous quarter. During the fourth quarter, automobile sales decreased by 3.8 percent, after decreasing by 0.5 percent in the third quarter. Consumer confidence, a barometer of consumer spending, surged to its highest levels since Hurricane Katrina decreased Americans’ expectations of the economy. The Conference Board, which surveys 5,000 households, reported that its Index of Consumer Confidence rose to 103.6 in December. This is up from a 98.3 reading in November and an 86.6 reading at the end of the third quarter of 2005. Conference Board numbers above 100.0 mean a growing economy. A figure between 80.0 and 100.0 suggests slow growth, whereas a reading below 80.0 indicates a recession. The University of Michigan’s Index of Consumer Sentiment reported a reading of 91.5 in December 2005, which is a large increase from the 81.6 in November and 76.9 at the end of the third quarter of this year. The Michigan sentiment survey is based on telephone interviews with roughly 500 Americans across the country on personal finances, business conditions, and buying conditions. After a first quarter that finished with small and moderate losses across major indexes, a second quarter that finished with small gains, and a third quarter that marked a slight rebound of the markets, the fourth quarter of 2005 ended as a slight improvement, with most indexes posting modest gains for the quarter. 2005 was the third year that brought gains, although modest, following three previous years of down markets. 2005 saw gains for the S&P 500, Wilshire 5000, and Russell 2000, and Nasdaq Composite, but saw a slight loss of 0.61 percent for the Dow Jones Industrial Average (DJIA). The fourth quarter of 2005 brought single-digit gains for all indices when compared to the third quarter. The best performing Dow Jones Industry Groups in 2005 were Oil & Gas, with a growth of 32.41 percent and Exploration & Production with a growth of 64.22 percent. The worst performing Industry Group in 2005 were Automobiles, seeing a loss of 38.97 percent. Performance was similar across the market, with most major indexes posting slight losses in October followed by small gains November. December saw a mix of modest gains and small losses compared to November. Because of the losses in the first quarter—which for some of the indexes were the worst in the last couple of years—the small gains of the second, third, and fourth quarters were enough for some indexes to show slight gains for the year, such as the S&P 500, which was up 4.68 percent for the year and the Wilshire 5000, which was up 6.19 percent for the year. The AMEX Composite showed impressive results for the year of 2005 with a gain of 22.6 percent, while only gaining 1.4 percent from the third quarter. For other indexes – like the DJIA- the gains of the third and fourth quarter were not enough to result in a year-to-date gain. For the year of 2005,

8
the DJIA was down 0.61 percent, while the Nasdaq was up a modest 1.37 percent. This alleviates the questions regarding whether 2005 will be the third up year or will finish with a loss for stock market investors. In the first quarter, the factors negatively affecting the stock market were climbing interest rates and higher inflation, whereas the culprits in the second quarter of 2005 were again, increasing interest rates, worries about economic growth, and rising energy prices. In the third quarter, the headwinds facing the stock market were the high oil prices, the twin hurricanes, and the Federal Reserve’s determination to continue to raise interest rates. Investors and analysts alike regarded 2005 as a below-average year for equities, with many expecting below-average returns for 2006. According to The Wall Street Journal, “The mediocre returns on stocks have come as a surprise to investors. After all, the economy is booming, with economic growth and corporate-profit growth outpacing forecasts.” Analysts view the Federal Reserve as a wildcard that that could impact the future performance of the market. If the Fed would call a halt, or at least a pause, in its rate-increase campaign, analysts predict stocks would be positively impacted. What the Fed decides to do will be heavily dependant on inflation numbers. Some analysts predict inflation to increase, causing more Fed rate increases, which could lead to bad news for stocks. The DJIA, an index of 30 “blue-chip” U.S. stocks, started the fourth quarter at 10,568.70 and finished it at 10,717.50, for a gain of 1.41 percent for the quarter. Despite the gain, the DJIA’s performance in the fourth quarter was less than its third quarter performance when it gained 2.86 percent percent. A year ago, the DJIA posted a 6.97 percent gain for the fourth quarter of 2004. As of December 31, 2005, the DJIA has lost 0.61 percent for the year compared with a gain of 3.15 percent for the year of 2004. As of the end of the fourth quarter, the DJIA has jumped 47.09 percent since its five-year low of 7,286.27 on October 9, 2002, but still is 8.58 percent off its five-year high of 11,723 on January 14, 2000. The Nasdaq Composite Index, consisting mainly of high-tech stocks, started the fourth quarter at 2,141.07 and finished at 2,205.32, reflecting a gain of 3 percent for the quarter and a gain of 1.37 percent for the year to date. This was a deterioration from the third quarter when the index gained 4.09 percent. A year ago, the index was up 14.69 percent for the fourth quarter and up 8.59 percent for the year. The Nasdaq’s performance for the last twelve months—a gain of 1.37 percent—was inferior when compared to the twelve months prior when the index increased by 8.59 percent. As of the end of the fourth quarter, the Nasdaq has jumped 97.94 percent since its low of 1,114.11 on October 9, 2002, but is still 56.32 percent off its five-year high of 5,048.62 on March 10, 2000. The S&P 500, consisting of a representative sample of 500 leading companies of the U.S. economy, and commonly viewed as a proxy for the market, started the fourth quarter at 1,218.02 and finished it at 1,268.66, for a gain of 4.16 percent for the quarter and a gain of 4.68 percent for the year. A year ago, the index was up 8.73 percent for the fourth quarter and up 8.99 percent for the year. The index performed better than the third quarter when it gained 2.24 percent and much better than the index’s second quarter performance when the index gained 0.91 percent. For the last twelve months ended December 2005, the S&P gained 4.68 percent. As of the end of the fourth quarter, the S&P 500 has gained

9
63.33 percent since its low of 776.8 on October 9, 2002, but is still 16.94 percent off its five-year high of 1,527.4 on March 23, 2000. The Dow Jones Wilshire 5000 Index (previously known as Wilshire 5000), which consists of almost all publicly traded companies based in the United States, started the fourth quarter at 12,189.60 and closed it at 12,711.70—posting a 4.28 percent gain for the quarter and a 6.19 percent gain for the year. The index performed better than in the third quarter when it saw gains of 2.63 percent. For the last twelve months ended December 2005, the index gained 6.19 percent, while for the twelve months ended December 2004 it gained 10.85 percent. A year ago – as of the end of December 2004 – the index posted gains of 9.87 percent for the fourth quarter. The Russell 2000 Index, which consists of small stock issues, started the fourth quarter at 663.33 and closed it at 686.44, reflecting a quarterly gain of 3.48 percent and a gain of 5.35 percent for the year. This compares similarly to a gain of 3.7 percent for the third quarter of 2005. A year ago – as of the end of December 2004 – the index posted gains of 13.72 percent for the quarter and 17 percent for the year. For the last twelve months, the index is up 5.35 percent after a much more sizeable gain of 17 percent for the twelve months ended December 2004. On October 9, 2005, Russell 2000 marked its historic high of 690.57. Since then, the index lost 0.6 percent, but it is still 109.89 percent higher than its low of 327.04 on October 9, 2002. The Wall Street Journal stated that, “Though U.S. corporate profits surged in 2005, share prices didn’t keep pace. In an attempt to correct that, companies have been giving more cash back to shareholders in the form of bigger dividends and stock buybacks. According to Standard and Poor’s, the companies that comprise the S&P 500-stock index spent more than $500 billion on share buybacks and dividends in 2005, an increase of more than 35% from 2004, which had been a record year.”
After a third quarter during which both long-term and short-term yields increased, the fourth quarter brought slightly higher yields. The Wall Street Journal reported that, “In 2005, bonds all but defied gravity. Though the Federal Reserve raised its short-term interest-rate target by two percentage points, 4.25% from 2.25%, and two of the world’s largest issuers of corporate debt, General Motors Corp. and Ford Motor co., had their credit ratings downgraded to ‘junk’ from investment grade, bond prices stayed high and yields low.” In 2005, the bond prices rose modestly across the maturity spectrum. An increase in yields signifies a decrease in the price of the bonds, which in turn may be explained by increased selling and supply. A decrease in yields signifies an increase in the price of the bonds. The 10-year Treasury bond finished the fourth quarter with a yield of 4.39 percent, slightly up from a yield of 4.34 percent at the end of the third quarter. The 10-year bond yield was 4.24 percent at the end of 2004 and 4.0 percent at the end of 2003. At the end of the fourth quarter of 2005, the 20-year bond was at 4.61 percent, compared with 4.62 percent at the end of the third quarter. The 20-year bond yield was 4.85 percent at the end of 2004. 2004 was the first year since 2000 that the yield on the 10-year Treasury

10
increased for the year; it had previously declined from 6.0 percent at the end of 2000 to 4.0 percent at the end of 2003. The five-year Treasury finished the fourth quarter at a yield of 4.35 percent, up from 4.18 percent at the end of the third quarter. The yield on the five-year note was 3.6 percent at the end of 2004 and 3.3 percent at the end of 2003. The 30-day T-bill was at 4.01 percent at the end of the fourth quarter, up from 3.15 percent at the end of the third quarter. The 30-day bill was at 1.89 percent at the end of 2004 and 0.9 percent at the end of 2003. A calm market and largely stable prices meant skimpy returns for most bonds in 2005. Emerging markets was an exception to this, seeing returns of 12%. This is due to improving finances and ratings upgrades attracted big investment flows, which boosted returns. According to the U.S. Department of Commerce, housing starts decreased 8.9 percent to 1.933 million units in December 2005, down from 2.121 million units in November. An estimated 2.064 million units were started in 2005, which is 5.6 percent above the 2004 figure of 1.956 million units. Construction of single-family homes decreased to an annual rate of 1.577 million units in December 2005, down 12.3 percent from a rate of 1.798 million units in the previous month. Building permits, a better leading indicator of demand for new homes, decreased by 4.4 percent in December 2005 to an annual rate of 2.068 million units, down from 2.163 million units in the previous month. In 2005, an estimated 2.141 million housing units were authorized by building permits, which is 3.4 percent above the 2004 figure of 2.071 million. During December 2005, overall spending on private construction increased by 1.1 percent to an annual rate of $904.3 billion. Spending on new construction increased 1.0 percent in the month of December to an annual rate of $1,160.6 billion, up from $1,149.3 billion in November. The value of construction spending in 2005 was $1,119.7 billion, which is 8.9 percent above the $1,027.7 billion spent in 2004. Spending on residential construction increased by 1.0 percent in December to an annual rate of $648.9 billion, while spending on nonresidential construction increased by 1.3 percent to an annual rate of $255.4 billion over the same month. According to the Federal Reserve, industrial production, which is the total output of factories and mines in the United States, increased by 0.6 percent in December 2005 after a 0.8 percent gain in November. During the fourth quarter of 2005, total industrial production increased at an annual rate of 3.8 percent, compared with an increase of 1.4 percent during the previous quarter. Manufacturing increased by 0.2 percent in December, but rose at an annual rate of 7.9 percent over the fourth quarter, compared with an increase of 2.0 percent in the third quarter of 2005. Capacity utilization, the percentage of production capacity manufacturers actually use, increased to 79.6 percent during the fourth quarter of 2005, up from a 78.5 percent rate during the third quarter. The current capacity utilization rate of 79.6 percent is 1.4 percentage points below its

11
1972-2004 average rate of 81.0 percent. In 2005, capacity utilization was at 78.8 percent compared to 77.1 percent in 2004. New orders for goods made in U.S. factories increased in December 2005 by 1.1 percent to $415.1 billion, which follows a 3.3 percent increase in November. Up three consecutive months, new orders for durable goods—items intended to last for three years or more — increased 1.8 percent to $229.1 billion in December. New orders for nondurable goods, such as food and clothing, increased 0.3 percent to $186.0 billion in December. The Institute for Supply Management reported that its monthly Manufacturing Index slumped to 54.2 in December, following a 56.6 reading in November 2005. Any reading above 50.0 suggests growth, whereas one below 50.0 shows contraction.
Hampered by rising interest rates and surging energy prices, the economy recorded its slowest growth in three years during the fourth quarter of 2005. Although the economy grew at a slower-than-predicted rate during the final quarter of 2005, economists in the financial press feel strong spending by businesses should bolster the nation’s economy in 2006, but a softening housing market is likely to slow the overall pace of growth in the coming year. According to Consensus Economics, Inc., publisher of Consensus Forecasts - USA, the real GDP is expected to grow by 3.6 percent in the first quarter of 2006 and by 3.3 percent in the second quarter (percentage change from previous quarter, seasonally adjusted annual rates). For 2006 and 2007, the real GDP growth rate is expected to be 3.4 percent and 3.1 percent respectively (average percentage change on previous calendar year). In the long term, the real GDP is expected to grow by 3.2 percent for 2007-2015 (average percentage change over previous year).
According to the survey, consumer prices will increase 2.8 percent in 2006 and 2.3 percent in 2007. In the long term, Consensus Forecasts - USA also predicts consumer prices will grow by 2.4 percent for 2007-2015 (average percentage change over previous year). Producer prices are expected to increase 3.3 percent in 2006 and 1.5 percent in 2007. Interest rates on three-month Treasury bills and 10-year Treasury bonds will rise over the next year, according to the forecasters of Consensus Forecasts - USA. According to the survey, three-month Treasury bills will rise from 4.5 percent at the end of April 2006 to 4.7 percent by the end of January 2007. The yield on 10-year Treasury notes is expected to climb to 4.9 percent by the end of April 2006 and to continue to increase to 5.1 percent by the end of January 2007. Both the three-month and the 10-year Treasury rates are expected to experience an upward trend over the next 10 years. According to the survey, the three-month Treasury rate will average 4.5 percent over 2007-2015. The 10-year Treasury bond yield is expected to average 5.4 percent for 2007-2010 and 5.5 percent for 2011-2015.

12
The forecasters polled by The Livingston Survey in December 2005 posted slightly more optimistic expectations about the level of the S&P 500 index in 2006 and 2007 than they did in June 2005 survey. The Livingston Survey, which reports the median value across the 42 forecasters on the survey’s panel, predicts that the S&P 500 index will rise steadily during the next two years. The December 8, 2005 survey estimates that the index will reach 1300.0 by June 30, 2006. The June 2005 survey estimated the index would only reach 1294.9 by June 30, 2006. The index is projected to rise to 1343.4 by December 29, 2006 and 1419.9 by the end of 2007. The growth rate in after-tax corporate profits is expected to be 5.2 percent in 2006 followed by 2.7 percent in 2007. The semiannual White House economic forecast (December 1, 2005) predicted strong economic growth, healthy job creation, and contained inflation. The administration's new forecast calls for the economy to grow 3.4 percent in 2006, down from 3.5 percent in 2005 and consistent with the forecast issued in June 2005. The forecast, which predicted moderate inflation for the next six years, called for CPI inflation to remain at 2.4 percent during 2006 and beyond. The White House also predicted that the nation would add about 176,000 jobs a month in 2006 and that the unemployment rate would approximate 5.0 percent. The same source forecasts that the Federal Reserve will raise interest rates in 2006, but they will remain fairly steady during the next five years. Specifically, it forecasts that rates on three-month Treasury bills will jump from 3.2 percent in 2005 to 4.2 percent in 2006 and 2007, but will then remain at 4.3 percent from 2008 through 2011. In the fourth quarter, the FOMC raised the federal funds rate from 3.75 to 4.0 percent in November and to 4.25 percent in December. The Committee noted that “Elevated energy prices and hurricane-related disruptions in economic activity have temporarily depressed output and employment. However, monetary policy accommodation, coupled with robust underlying growth in productivity, is providing ongoing support to economic activity that will likely be augmented by planned rebuilding in the hurricane-affected areas.” Respecting plans for future interest rate actions, the policymakers estimated that further policy structuring is probably going to be needed to keep sustainable growth and price stability in balance. The Committee’s official comment was, “The Committee judges that some further measured policy firming is likely to be needed to keep the risks to the attainment of both sustainable economic growth and price stability roughly in balance. In any event, the Committee will respond to changes in economic prospects as needed to foster these objectives.” This Economic Outlook Update™ reflects the general economic conditions at the end of the fourth quarter of 2005 and was compiled using data available as of January 31, 2006. All of the contents of the economic outlook section of this valuation report are quoted from the Economic Outlook Update™ 4Q 2005 published by Business Valuation Resources, LLC, © 2006, reprinted with permission. The editors and Business Valuation Resources, LLC, while considering the contents to be accurate as of the date of publication of the Update, take no responsibility for the information contained therein.

13
References Bivens, Josh, “GDP Picture,” Economic Policy Institute [Internet]. January 27, 2006: Available from: http://www.epi.org/content.cfm/webfeatures_econindicators_gdppict_20060127. Browning, E.S., “A Fight to the Finish for Stocks,” The Wall Street Journal, Tuesday, January 3, 2006. Bureau of Economic Analysis [Internet]. U.S. Department of Commerce; Available from: http//www.bea.gov. Bureau of Labor Statistics [Internet]. U.S. Department of Labor; Available from: http//www.bls.gov. Commodity Charts & Quotes, The [Internet]. Available from: http://futures.tradingcharts.com. “Confidence back to pre-Katrina levels,” CNNMoney [Internet]. December 28, 2005: Available from:http://money.cnn.com/2005/12/28/news/economy/consumer_confidence/index.htm. Consensus Forecasts - USA, Consensus Economics, Inc., October 10, 2005 and January 9, 2006. Available from: www.consensuseconomics.com. Council of Economic Advisers [Internet]. The White House; Available from: http://www.whitehouse.gov/cea/ Council of Economic Advisers [Internet] – Executive Office of the President. Joint Press Release of the Council of Economic Advisers, The Department of the Treasury, and The Office of Management and Budget, December 1, 2005: Available from: http://www.whitehouse.gov/cea/pr12012005.html “Economic Growth Slowed to 1.1% In Fourth Quarter,” The Wall Street Journal [Internet]. January 28, 2006: Available from: http://online.wsj.com/article/SB113836607293558161-search.html? Energy Information Administration, The [Internet]. Available from: http://tonto.eia.doe.gov/oog/info/twip/twip.asp Federal Reserve Bank of Philadelphia, The Livingston Survey, December 8, 2005. Federal Reserve Bank of St. Louis [Internet]. Available from: http://stlouisfed.org

14
Federal Reserve Board Press Release, November 1 and December 13, 2005. Federal Reserve Board, The [Internet]. Available from: http://www.federalreserve.gov. “GDP posts smallest gain in 3 years,” CNNMoney [Internet]. January 27, 2006: Available from: http://money.cnn.com/2006/01/27/news/economy/gdp/index.htm. Gerena-Morales, Rafael and Annett, Tim, “Growth May Slow in 2006 as Market For Housing Cools,” The Wall Street Journal, Tuesday, January 3, 2006. “Manufacturing much weaker than forecast,” CNNMoney [Internet]. January 3, 2006: Available from: http://money.cnn.com/2006/01/03/news/economy/ism/index.htm. Pratt, Shannon P., Reilly, Robert F., and Schweihs, Robert P., Valuing A Business: Analysis and Appraisal of Closely Held Companies, 4th Edition, (New York: McGraw Hill, 2000). Revenue Ruling 59-60, 1959-1 CB 237—IRC Sec. 2031. U.S. Census Bureau [Internet]. U.S. Department of Commerce; Available from: http://www.census.gov. Whitehouse, Mark, “Bonds’ Gravity-Defying Act,” The Wall Street Journal, Tuesday, January 3, 2006. Yahoo! Finance [Internet]. Available from: http://finance.yahoo.com/?u.

Industry Report
Excavation and Paving Industry Outlook
The following forecast is for industries related to the company being appraised because there were no reliable sources available for information directly relating to this company. Trends for these companies are going to be directly related to the decline or growth of the subject industry. The value of transportation construction in 2003 continued to decline, following a pattern begun in 2001, falling to below $47 billion – down $2.2 billion from 2002 and $2.5 billion from 2001. Meanwhile the number of contracts awarded in 2003 were the lowest total in five years – 1,922 fewer than were awarded in 2001.
Historical trends for the past five years illustrate the change. The 2003 figures were hurt by a comparatively weak autumn, when highway contracts were well below past levels. Highway contracts remain the dominant market, contributing nearly two-thirds of the value and over three-quarters of the actual contracts. Bridge and tunnel contracts were the year’s strongest market, posting 5.5 percent growth in value.
0%
20%
40%
60%
80%
100%
1 2 3 4 5
Historical Trends
ValueNumberYear
0% 50% 100%
Number
Value
Contracts by Type Airport
Bridge andTunnelDock, Pier,WharfHighway
Railroad
TOTAL

The value of highway contracts awarded in 2003 was down 5.2 percent over last year. The 2003 highway market started off well and rose to a summer peak of $3.9 billion in July. However, autumn saw a sharp weakening of the highway market, with values slumping to below $2.0 billion in September. The bridge and tunnel market posted 5.5 percent growth in value in 2003 – the only market to show year-on-year growth. However the number of contracts awarded in 2003 was down 10.9 percent from last year from last year, hitting a five year low. The bridge and tunnel market was strong all year.
Bridge and Tunnel Contracts (millions of dollars)
Year Number Value Average Value 2003 4,737 11,675.354 2.465 2002 5,316 11,067.587 2.082 2001 4,868 11,101.357 2.280 2000 5,086 10,440.695 2.053 1999 5,391 9,170.461 1.701 The value of railroad contracts tumbled and the number of contracts also declined in 2002. For the second year in a row, the weakest market was the railroad market, which posted a 34.95 percent decline in value and saw the number of contracts awarded fall 8.9 percent. Like last year, analysis indicates that the year-on-year fall is principally due to a lack of major investor states. New York led the railroad market in 2002, with just $211 million in awards. By contrast, just two years ago, three states awarded over $500 million in railroad contracts.
010,00020,00030,00040,00050,00060,000
1 2 3 4
Highway Contracts
Value Million $Number Jobs

Railroad contracts (millions of dollars)
Year Number Value Average Value 2003 184 1,507.597 8.193 2002 202 2,314.953 11.460 2001 224 3,250.105 14.509 2000 214 1,888.309 8.824 1999 220 1,761.544 8.007 Airport contract numbers didn’t improve in 2003 despite a 3.6 percent rise in the number of airport contracts awarded in 2003, the value of those contracts were down 16.1 percent compared to last year. Texas, Georgia and Alaska led the airport market in 2003; each state issued more than $100 million in airport contracts last year. Rhode Island was the only state not to issue an airport contract in 2003.
Airport contracts (millions of dollars)
Year Number Value Average Value 2003 891 1,601.737 1.798 2002 860 1,909.933 2.221 2001 850 2,132.714 2.509 2000 712 1,648.163 2.315 1999 677 1,588.858 2.347 The value of dock, pier and wharf contracts was just below last year’s record total, but the number of contracts awarded declined 8.5 percent. California and Kentucky were the market leaders in 2003; each state awarded over $100 million in dock, pier and wharf contracts last year.
Docks, Pier and Wharf (millions of dollars)
Year Number Value Average Value 2003 396 907.419 2.291 2002 433 908.062 2.097 2001 444 602.479 1.357 2000 433 665.284 1.536 1999 530 834.059 1.574 The transportation construction market got off to a slow start for 2004. The new year started with more of a whimper than a bang. With just over 1,400 transportation construction contracts worth about $2.3 billion awarded in January, the market was well off last January’s early pace.

January Contracts by Type
(millions of dollars) Airport 21 63.320 Bridge and Tunnel 290 482.543 Dock, Pier and Wharf 21 37.532 Highway 1,100 1,678.099 Railroad 11 13.498 TOTAL 1,443 2,274.992
Comparing this January to past years further reveals the market’s lackluster performance. The value of contracts awarded in January this year was about $1.6 billion less than last year, and $600 million below January 2000. However, the number of contracts awarded last month was above the 2001 low, well off the pace from 2002 and 2003.
Number and Value of Contracts: Year-to-Date Historical Comparison
(millions of dollars) Year Number Value 2000 1,782 2,976.355 2001 1,074 2,683.893 2002 1,964 3,674.547 2003 1,941 3,923.625 2004 1,443 2,274.992 The total value of highway contracts awarded in January 2004 was down nearly $1 billion compared to last January – a decline of 37 percent. Similarly, the number of highway contracts awarded last month was down by nearly 25 percent from January 2003.
Total Highway Contracts - January (millions of dollars)
Year Number Value Average Value 2000 1.324 1,615.606 1.220 2001 813 1,510.465 1.858 2002 1,508 2,203.630 1.461 2003 1,459 2,668.016 1.829 2004 1,100 1,678.099 1.526 The year-on-year bridge and tunnel contracts were halved in value and declined in number making the tall the worst value and second worst number since 2000. The value of bridge and tunnel contracts awarded in January was less than half of last year, while the number of contracts dropped by 30 percent.

Bridge and Tunnel Contracts – January (millions of dollars)
Year Number Value Average Value 2000 384 1,089.151 2.836 2001 197 584.596 2.967 2002 377 936.415 2.484 2003 415 1,057.800 2.549 2004 290 482.534 1.664 The value of railroad contracts derailed in January making January the lowest monthly total since 2000 – less than a quarter of last year’s total for the month. Only 11 contracts were awarded last month, worth less than $14 million. As a result, the average value of a railroad contract in January was only $1.227 million – far below the usually monthly average.
Total Railroad Contracts – January (millions of dollars)
Year Number Value Average Value 2000 12 119.297 9.941 2001 14 352.508 25.179 2002 16 394.119 24.632 2003 11 56.543 5.140 2004 11 13.498 1.227 Airport contracts were mediocre for January. The value of airport contracts awarded in January was two-thirds of last January, but nearly double the 2002 tally. Meanwhile, the number of airport contracts awarded last month was down slightly from last year, which was down slightly from the year before.
Total Airport Contracts – January (millions of dollars)
Year Number Value Average Value 2000 19 74.083 3.899 2001 24 143.090 5.962 2002 27 33.059 1.224 2003 24 94.882 3.953 2004 21 63.320 3.015 The value of dock, pier and wharf contracts awarded in January 2003 was down 19 percent from last year, hitting a record low for the month. Similarly, the number of dock, pier and wharf contracts awarded slid to a five-year low.

Total Docks, Pier and Wharf Contracts – January (millions of dollars)
Year Number Value Average Value 2000 43 78.198 1.819 2001 26 96.234 3.586 2002 36 107.324 2.979 2003 32 46.384 1.450 2004 21 37.532 1.787 In November 2003, 28 states increased the value of highway contract awards compared to November 2003. The number of highway contract awards was up in 28 states. Year to date, 15 states have awarded more highway contracts and eight have increased the value of contract awards over last year. A large factor in road construction is fuel costs. As of February, 2004, the average price of gasoline was up 0.9 cents from the previous week; the price of gasoline was 1.1 cents lower than the price one year ago. The average price of diesel fuel was up 1.6 cents from the previous week but was 12 cents lower than the previous year. Crude oil prices rose $1.97 in February 2004 but that price was still lower by $2.19 per barrel than the previous price in 2003. In February 2004, the nation’s stock of crude oil stood at 273.8 million barrels, up 4.9 million barrels from earlier in the month and 0.9 million more than one year ago. The stock of gasoline was 205 million barrels, an increase of 0.6 million barrels from the previous week but 6.2 million less than a year ago. Insurance costs have skyrocketed since the events of 9/11 which cost the insurance industry an estimated $40 to $70 billion. The catastrophe cast the insurance industry about 25 percent of its net worth. Insurance premiums have averaged hikes well into double-digits since 9/11. “We find people reeling from 30 to $40 percent increases on their average insurance costs,” observes Luke Laborde, president of the Willis Group office in Cary, North Carolina, noting that comprehensive insurance was probably averaging 20 percent higher in 2002 than a year earlier. “Umbrella liability policies went up 80 percent and even up to 200 percent,” he added. Auto fleet coverage for grading and excavation contractors increased “an average of 28 percent between the first quarter of 2001 and the first quarter of 2002. The year 2002 also marked the first time in over 24 years in which construction insurance, surety bonding and employee benefits costs all rose in double digits simultaneously.

According to a recent article by Dr. William R. Buecher, vice president of economics and research for ARTBA, the TEA-21, or Transportation Equity Act for the 21st Century, has assured that highway funding is spent for highway improvements. For instance, in 2003 Congress added $8 billion to the Revenue Aligned Budget Authority (RABA) adjusted highway funding in order to maintain federal highway investment at the 2002 level. In 2004, congress has set a highway investment target of $33.6 billion – about $4.7 billion above anticipated Highway Account (HA) revenues. Although the Highway account has drawn down considerably from its peak in 2000 there are still about $7 billion to be allocated at the end of the current fiscal year. Absent new revenues, the spend-down of the balance will continue as states pay for work that has been previously contracted. Depending on the level of federal highway investment enacted in 2005, the balance of the Highway Account will be drawn to zero by the end of 2005 or early in 2006. Part of the reason for reduced funds is the fact that the primary highway user fee, federal motor fuels tax, has not been increased in over a decade. Over time inflation has cuts the Highway Accounts purchasing power by almost one-third. Projected HA revenues cannot support current federal highway investment levels, let alone the $50 billion annual federal investment identified by the U. S. Department of Transportation as needed to maintain current physical and performance conditions on the nation’s highways and bridges. In construction work nationwide, heavy and highway construction activities are among the most hazardous. Consider the following annual average annual fatality rates in the United States. In the United States, a total of 120 to 130 workers die each year in road construction activities. Of this total, approximately 23 percent of the fatalities are due to pedestrian
Average Annual Fatality Rates per 100,000 Workers
39
19
6 Heavy/HighwayConstructionAll ConstructionActivitiesAll Industries

workers being struck by traffic vehicles. Over 62 percent of the fatalities are not directly related to traffic issues. The major cause of fatalities and serious injuries in road construction work summarized below: Fatalities Serious Injuries 74 percent of all fatalities are due to: 67 percent of the non-fatal serious
injuries experienced by 20 road construction contracts were due to the following hazards:
Pedestrian workers struck by traffic 23% Over exertion – 27% Pedestrian workers struck by work zone Falls – 23% Construction vehicles – 18% Work zone vehicle operator and occupant Struck by other objects – 17% Events – 18% Highway travel traffic accidents – 15% Asphalt paving is used in the vast majority of the highways and roads in the United States. In fact, approximately 95 percent of this country’s four million miles of roadways are constructed using asphalt. Not only roads and highways use asphalt paving. So do airport runways and tarmacs, parking lots, driveways and racetracks, as well as tennis courts and other surfaces that need a resilient durable finish that is provided by asphalt paving. As paving material asphalt is durable, environmentally acceptable, and easy to build and maintain. Plus it is 100 percent recyclable. Called by a variety of names including macadam, blacktop, asphalt concrete, bituminous concrete or tarmac, asphalt has the same composition no matter what the name. A combination of aggregates composed of crushed rock, gravel and sand, and a viscous material called asphalt cement are combined at a low temperature to produce what is popularly known as “hot mix asphalt”. The hot mix is generally mixed at between 300 and 350 degrees Fahrenheit and held between 250 and 300 degrees to ensure pourability. Most aggregate is locally mined material to make mixing more economically feasible. Hot mix asphalt is generally produced in the same area where it’s used because the further it must transported the less chance it will arrive at an appropriate temperature to pour. A number of factors can affect the laying of asphalt including mean temperature, rain or wind storms. Air and surface temperatures affect the amount of time that can be allowed to place the mixture and compact it before it cools beyond malleability. Asphalt has been used for centuries for paving purposes. It dates back to the Babylonians and was used by civilizations including the Greeks and Romans. The Greeks are credited
with coining the current word asphalt that is derived from the Greek asphaltos meaning secure. The Romans used asphalt to seal their baths, reservoirs and aqueducts according to the National Asphalt Paving Association. There was a considerable lag in construction from the Greeks and Romans to the Americans. Road construction wasn’t at the level of competence demonstrated by the Romans when America was first colonized, therefore, asphalt paving was of no use. In the mid-1800s coal tar was first used to bind the aggregate and produce a mixture that could be used to pave sidewalks and even some roadways. However, coal tar did not make an acceptable mixture and in 1870 a Belgian chemist named Edmund J. DeSemdt created a mixture containing sand. He had the mixture poured in front of city hall in Newark, New Jersey. It was the first time real asphalt had been used in this country. DeSmedt also paved Pennsylvania Avenue, the famous street that runs past the White House in Washington, D. C. The use of sheet asphalt from Trinidad Lake Asphalt was the turning point for domestic asphalt as this proved to be the equal of any imported from Europe. Strangely enough, many people tried to claim their asphalt had properties superior to that manufactured by other companies. Only in the last few decades has hot mix asphalt been considered a single entity. As early as 1871, a patent was filed by Nathan B. Abbott, Brooklyn, New York. The mixture combined bitumen and aggregate and was patented under the name “bitulithic” a name that came to be used to describe any asphalt paving, much to the chagrin of the Warren Brothers Company. Frederick J. Warren fought to retain his hold on “bitulithic” and to preclude others from referring to their material by that name but he wasn’t successful. In the decades since Frederick Warren first patented “bitulithic” the patents to the various paving materials have expired and become extinct in the road building trade. Today, hot mix asphalt is basically made from the same petroleum based materials that are a by-product of gasoline refining. But, previously asphalt was made from naturally occurring substances found in Lake Trinidad and Bermudez Lake in Venezuela. Road building became such a growth industry that it soon outstripped the available natural resources and petroleum based materials were required. As more and more automobiles were manufactured and purchased, citizens began demanding more and better roads. It was this demand that precipitated the invention of the first hot mix asphalt plants or facilities. The first such facility was built by Warren Brothers of East Cambridge, Massachusetts in 1901. The original concept is still in use today with some modifications including drum mixers, vibrating screens and pressure injection systems. Asphalt patching operations still use the original equipment used to lay asphalt in the early days of road building. Brooms, lutes, squeegees and tampers are all still in use

today although there are sophisticated rollers and spreaders that ease much of the labor intensive work of the past. Recycling didn’t reach full potential until the 1970s when the energy crisis forced everyone to look at ways to use petroleum products in new and creative ways. According to the National Asphalt Paving Association “over 70 million metric tons of asphalt paving material is recycled each year. Today, asphalt paving is America’s most recycled material.” Highway construction and maintenance are cyclical industries based primarily on the state of the economy, consumer optimism and weather conditions. Even in a booming economy, highway construction is going to lag behind need. Most construction projects are two to three years in planning prior to actual construction beginning. Pavement design is continually evolving. Empirical processes were developed 40 to 60 years ago. These involved observations of how pavements interacted with soils, climates and levels of traffic, and then basing the pavement thickness on these observations. While empirical methods are still widely used, the industry is moving toward mechanistic-empirical procedures. In these newer design methods, the pavement is treated like a structure such as a building or bridge. The reactions of the pavement to different traffic loads are modeled mathematically, giving designers more information concerning options on materials and design factors. This could result in more efficient utilization of materials to obtain long-lasting pavements. The five areas of the country that show the highest traffic congestion levels were Los Angeles (1.57), Washington, D. C. (1.43), Miami-Hialeah (1.34), Chicago (1.34), and San Francisco-Oakland (1.33).
1.20%
1.30%
1.40%
1.50%
1.60%
1
Highest Traffic CongestionLos Angeles
Washington, DC
Miami-Hialeah
Chicago
San Francisco-Oakland

Cities at the opposite end of the scale included: Bakersfield, California (0.68), Laredo, Texas (0.73), Colorado Springs, Colorado (0.74), Beaumont, Texas (0.76) and Corpus Christi, Texas (0.78). In a study conducted by the Texas Transportation Institute a measurement system to track the difference between traveling at peak times and off times was called the Travel Rate Index. The Travel Rate Index showed that driver had increased their travel time from 20 to 50 percent during the previous two years. And, in cities with a population between one and three million the Index zoomed up to 260 percent. Well-designed and well-built asphalt pavements last many years. There are a number of case studies which support this conclusion. For instance, the asphalt portions of Interstate 90 in Washington State have been in place since their original construction up to 35 years ago with no rehabilitation for structural reasons. These pavements have only required maintenance and periodic replacement of their surface layer. The New Jersey DOT found the same to be true on I-287 on a 26-year old 10-inch asphalt pavement; the original structure has remained intact and only a surface profiling followed by an overlay was necessary to restore the pavement. The entire New Jersey Turnpike is asphalt. It was built in 1951. They have never had a structural failure in the pavement. The only maintenance they've done is surface treatments and overlays. In a recent interview, the chief engineer for the Turnpike said that expected the pavement to last another 50 years. It was very well-designed and well-built. The designers put a lot of thought and care into the pavement structure and how they built it, they used top-quality materials, and they got a pavement which has held up extremely well. The National Center for Asphalt Technology in Auburn, Alabama, is currently conducting experiments on its test track directed toward improving asphalt pavement performance. They are putting 10 million ESALS (Equivalent Single Axle Loads) on the pavement in two years. They are now about halfway through the tests, and they have
0.60%
0.65%
0.70%
0.75%
0.80%
1
Lowest Traffic CongestionBakerfield
Laredo
ColoradoSpringsBeaumont
Corpus Christi

found very little distress in the pavement. They are using a wide range of asphalt mixes, including conventional, Superpave, Stone Matrix Asphalt, and Open Graded Friction Courses. The tests show that asphalt mixes which are well-designed and well-built will give very good service. They will last a long, long time. Although at least 70 percent of Americans admit there are major transportation problems in this country, even more of them feel that more money should be spent maintaining and even, constructing new roadways. American Road and Transportation Builders Association (ARTBA) President and CEO Pete Ruane finds that the American people are very troubled by the current transportation problems occurring in the nation. Ruane said, “With the U. S population projected to increase by 60 million people and highway travel by more than 40 percent over the next 20 years, there are a number of things Congress should be considering now to address the nation’s transportation challenges. Number one is significantly increasing highway and mass transit capital investment. No revenue raising option should be taken off the table – including the gas tax.” The Transportation Equity Act for the 21st Century (TEA-21) was passed to ensure the financial security of money for the nation’s roadways. In 1998, Congress put a provision in TEA-21 that set the obligation limitation annually to the projected prior year revenues which were to be placed into the Highway Account of the Highway Trust Fund thereby promising to spend all the Highway Account User fees solely on Highways. Other problems that plague highway building contractors are:
• The Clean Air Act. • Environmental extremists who work to stop highway projects • Governmental controls that move from the federal to state levels • Thieves and vandals
In highway construction, state funds account for slightly more than half of all construction work performed on highways and bridges. Most state highway construction programs are financed from dedicated highway use fees such as fuel taxes and vehicle registration fees. States that are experiencing revenue problems are also having difficulties with highway construction and maintenance. A relatively new source of information, the Internet, is providing a faster, much more efficient method for contractors, equipment suppliers and customers to exchange information. Manufacturers and suppliers can offer their products, receive and transmit orders and much more with few keystrokes. And, national borders no longer interfere with advertising, sales or service. The United States uses about 500 million tons of asphalt annually at a cost of $11.5 billion. During the past three decades asphalt has come into its own. It’s now utilized in

such places as sanitary landfills and hazardous waste dumps, in drinking water reservoirs and fish hatcheries. Even the events of September 11th have not slowed the progress on airport construction and related projects that entail the use of asphalt construction and maintenance. Experts predict that Congress provided an estimated $3.4 billion for airport improvements in 2003. Clearly indicating a rosy future for the industry near term.
Following a strong third quarter of 2003, the U.S. economy slowed sharply during the fourth quarter, but continued to show strength throughout many of the economic sectors. The gross domestic product (GDP), which is the broadest measure of the economy's health, posted a less-than-expected fourth quarter figure, but still offered compelling evidence that the economy is on the road to recovery.
The U.S. Department of Commerce reported that the nation's economy grew at an annual rate of 4.0 percent in the fourth quarter of 2003, as indicated by the GDP, about half the robust 8.2 percent rate in the third quarter, as can be seen in Exhibit 1. With the help of this year’s strong second half, the economy grew by 3.1 percent in 2003. This marks an improvement over the 2.2 percent increase in 2002 and is the strongest showing since a 3.7 percent increase in 2000. Growth in the fourth quarter was due in large part to the increase in business investments in equipment and software, business inventories, and exports, but was offset by the deceleration in consumer spending.
Construction of single-family homes increased at a rate of 1.414 million units in 2003, up 7.7 percent from a rate of 1.313 million units in the previous month. Thirty-year mortgage rates, which averaged 7.21 percent last year, have been below the 6 percent mark in early 2003.

Trade Area Outlook

Houston, Texas Harris County

222 Westheimer Street Houston, Texas 77539

Houston, Texas Harris County
Houston is the largest city in the state of Texas and the fourth-largest in the United States. The city covers more than 600 square miles and is the county seat of Harris County—the
third most populous in the country. As of the 2004 U. S. Census estimate, Houston had a total population of more than two million. The city is at the heart of the Houston–Sugar Land–Baytown metropolitan area, the largest cultural and economic center of the Gulf Coast region and the seventh-largest metropolitan area in the U.S. with a population of 5.3 million in 10 counties. 1
Houston Skyline
The American Chamber of Commerce Researchers Association (ACCRA) Cost of Living Index shows that Houston’s overall after-taxes living costs are 12 percent below the nationwide average, largely due to housing costs that are 24 percent below the housing average.
• Houston’s housing costs are 44 percent below the average for large metro areas and have the lowest housing prices among the 20 largest metros.
• Houston’s grocery prices are 21 percent below the major metro average. • Utility costs in Houston are 10 percent below the major metro average. • Transportation costs are 9 percent below the average. • Healthcare costs are 7 percent below the average. • Costs for miscellaneous goods and services in Houston are 11 percent below the
average.2
Houston is world-renowned for its energy (particularly oil) and aeronautics industries, and for its ship channel. The area is also the world's leading center for building oilfield equipment. Houston is the U.S. energy headquarters and a world center for virtually every segment of the petroleum industry. 3
• The Houston metropolitan area has more than 3,600 energy-related establishments, both upstream and downstream.
• In January 2005, the Houston MSA held 31 percent of the nation’s jobs in oil and gas extraction, 14 percent of jobs in support activities for mining and 10.3 percent of agricultural, construction and mining machinery manufacturing jobs.
• The Texas Gulf Coast has 23 percent of the nation’s refining capacity, including two of the four largest U.S. refineries.
1 Wikipedia, U. S. Census Bureau 2 Greater Houston Convention and Visitors Bureau 3 Wikipedia, U. S. Census Bureau
2
• Fourteen of the nation’s top 20 natural gas transmission companies have corporate or divisional headquarters in the city, accounting for 57.5 percent of the nation’s gas pipeline mileage.
• The Houston MSA in 2002 had 382 chemical plants, large and small. • Nine of the nation’s 25 largest publicly traded oil and gas exploration and
production firms are headquartered in Houston; 10 of the remaining 16 have subsidiaries, major divisions or other significant operations here.
• Petroleum, petroleum products, organic chemicals and plastics accounted for 79 percent of the Port of Houston’s 141 million tons of foreign shipments in 2004.4
The Port of Houston is the sixth-largest port in the world; amid other U.S. ports, it is the busiest in foreign tonnage and second in overall tonnage. Second only to New York City in Fortune 500 headquarters, Houston is the seat of the internationally-renowned Texas Medical Center, which contains the world's largest concentration of research and healthcare institutions.
Houston is ranked as one of 11 U.S. world-class cities by the Globalization and World Cities Study Group & Network. The city has a vibrant visual and performing arts scene—the Houston Theater District is ranked second in the country for the number of theatre seats in a concentrated downtown area per capita and has world-class visual and performing arts organizations. The city is also close to beaches on Galveston Island as well as one of the United States' largest concentrations of pleasure boats and local tourist attractions.
In the mid-1800s, two brothers who were New York real estate promoters, John Kirby Allen and Augustus Chapman Allen, sought a location where they could begin building "a great center of government and commerce." In August 1836, they purchased 6,642 acres of land from T. F. L. Parrot, John Austin's widow, for $9,428. The Allen brothers named their town after Sam Houston.
Hurricane Rita evacuation in September 2005
In 2001, Tropical Storm Allison dumped feet of rain on the city, causing billions of dollars in damage and killing 43 people. To date, the flooding caused by Allison was the worst in the city's history. Many neighborhoods and communities have changed since the storm; older houses in some affected neighborhoods have been torn down and replaced with larger houses with bigger foundations.
In the wake of Hurricane Katrina in August 2005, Houston provided shelter to more than 25,000 refugees from New Orleans, Louisiana in various facilities around the city, including the infrequently-used Reliant Astrodome stadium. This unprecedented situation 4 Greater Houston Convention and Visitors Bureau

3
involved Houston-area public school systems, which are providing education for child refugees. According to CNN, around 230,000 people from the New Orleans metropolitan area are now living in the Houston area, in shelters or elsewhere. Katrina refugees have swelled the city proper's population past 2.5 million. It is unclear how that variable will fluctuate in the coming months. Some have speculated that, because of a variety of social and economic factors, the enormous population shift could—at least in part—be permanent.
Approximately 2.5 million (out of 5.2 million) Greater Houston area residents evacuated when Hurricane Rita approached the Gulf Coast one month after Hurricane Katrina. Hurricane Rita left little damage to the Houston metropolitan area. Dead stop traffic and gas shortages were rampant during the evacuation. This event marked the largest evacuation in the history of the United States.
According to the United States Census Bureau, the city has a total area of 601.7 square miles. 579.4 square miles of it is land and 22.3 square miles of it is water. The total area is 3.7 percent water.
Houston's climate is classified as humid subtropical. The city is located in the gulf coastal plains biome, and its vegetation is classified as temperate grassland. Much of Houston was built on forested land, marshes, swamp, or prairie, all of which can still be seen in surrounding areas. The average yearly precipitation level is approximately 48 inches. Prevailing winds are from the south and southeast during most of the year, bringing heat from the deserts of Mexico and moisture from the Gulf of Mexico.
Founded in 1836 and incorporated in 1837, Houston is one of the fastest growing major cities in the United States and the largest without zoning laws. The city is the county seat of Harris County. A portion of southwest Houston extends into Fort Bend County and a small portion in the northern extension.
The Port of Houston
Houston's energy industry is a world powerhouse (particularly oil), but biomedical research, aeronautics, and the ship channel are also large parts of the city's industrial base. The Houston metropolitan area comprises the largest petrochemical manufacturing area in the world, including for synthetic rubber, insecticides, and fertilizers. The area is also the world's leading center for building oilfield equipment. Much of Houston's success as a petrochemical complex is due to
its busy man-made ship channel, the Port of Houston.
Because of these economic trades, many residents have moved to Houston from other U.S. states, as well as hundreds of countries worldwide. Unlike most places, where high

4
gas prices are seen as harmful to the economy, they are generally seen as beneficial for Houston as many are employed in the energy industry.
Historically, Houston has had several growth spurts (and some devastating economic recessions) related to the oil industry. The discovery of oil near Houston in 1901 led to its first growth spurt — by the 1920s, Houston had grown to almost 140,000 people. The city's burgeoning aerospace industry heralded its second growth spurt, which solidified with the 1973 oil crisis. Demand on Texas oil increased, and many people from the northeast moved to Houston to profit from the trade. When the embargo was lifted, the growth mostly stopped. However, Pasadena still has its refineries, and the Port of Houston is among the busiest in the world.
Houston is second to New York City in Fortune 500 headquarters. The city has attempted to build a banking industry, but the companies originally started in Houston have since merged with other companies nationwide. Banking, however, is still vital to the region.
As of the census of 2000, there were 1,953,631 people, 717,945 households, and 457,330 families residing in the city. The population density was 3,371.7 persons per square mile. There were 782,009 housing units at an average density of 1,349.6 housing units per square mile.
The racial makeup of the city was 49.27 percent Caucasian, 25.31 percent African American, 0.44 percent Native American, 5.31 percent Asian, 0.06 percent Pacific Islander, 16.46 percent from other races, and 3.15 percent from two or more races. Almost 38 37.41 percent of the population was Hispanic or Latino of any race.
There were 717,945 households out of which 33.1 percent had children under the age of 18 living with them, 43.2 percent were married couples living together, 15.3 percent had a female householder with no husband present, and 36.3 percent were non-families. 29.6 percent of all households were made up of individuals and 6.2 percent had someone
living alone who was 65 years of age or older. The average household size was 2.67 and the average family size was 3.39.
In the city, the population was spread out with 27.5 percent under the age of 18, 11.2 percent from 18 to 24, 33.8 percent from 25 to 44, 19.1 percent from 45 to 64, and 8.4 percent who were 65 years of age or older. The median age was 31 years. For every 100 females there were 99.7 males. For every 100 females age 18
and over, there were 97.8 males.
35.9%
18.4%0.3%
27.2%
3.9%0.0%2.3%
12.0%
Data ACaucasianAfrican AmericanNative AmericanHispanicAsianPacific IslanderTwo or more racesOther races
Houston Racial Composition
under 1818 to 24
25 to 4445 to 64
65 and older0.00%
10.00%
20.00%
30.00%
40.00%
Houston Age Range

5
The median income for a household in the city was $36,616, and the median income for a family was $40,443. Males had a median income of $32,084 versus $27,371 for females. The per capita income for the city was $20,101. 19.2 percent of the population and 16.0 percent of families were below the poverty line. Out of the total population, 26.1 percent of those under the age of 18 and 14.3 percent of those 65 and older were living below the poverty line.
Houston recorded 336 murders in 2005, in comparison to 272 in 2004. Murders in Houston peaked at 702 back in 1981. Despite the rise in homicides of 23.5 percent, overall crime in the city dropped by two percent in 2005 compared to 2004. Most of the homicides that occurred in the last quarter of 2005 occurred in the city's apartment complexes—primarily in the southwest and north-central areas of Houston.
Houston is currently going through a spike in crime due in part to an influx of refugees from New Orleans into the city following Hurricane Katrina. Since September 1, 2005, when an estimated 200,000 Louisianans resettled in Houston after the hurricane, refugees are believed to have been involved in 26 slayings, or nearly 17 percent of all homicides. The cases, according to Houston police, involved 34 refugees—19 of them victims and 15 of them suspects. Houston's murder rate increased 70 percent in November and December of 2005 compared to 2004's levels. At least 35 percent of the city's December 2005 increase in homicides—five of 14 over last year’s level— have been directly attributed to the presence of Katrina refugees.
Police say that southwest Houston, long recognized as a problem area, is facing another manifestation of the Louisiana exodus—Katrina crime. In late January, investigators in the Houston Police Department's Gang Murder Squad announced the arrests of eight of 11 suspects believed linked to nine homicides in the city's southwest side and two others in nearby Pasadena, which is southeast of Houston. The slayings occurred since November 2005 and all the suspects are displaced New Orleanians who landed in Houston after the hurricane.
In the first 19 days of 2006, a new Neighborhood Enforcement Team Taskforce had responded to calls involving complaints by 110 Katrina refugees. Of the suspects apprehended, 229 were Katrina refugees.
Houston has the lowest cost of living and the lowest median housing costs among 27 major U.S. metropolitan areas with populations of more than 1.7 million.
Houston is a diverse and international city, in part because of its many academic institutions and strong biomedical, energy, manufacturing and aerospace industries. A port city, Houston also has large populations of immigrants from Mexico, China, Indonesia, the Philippines, Taiwan, South Korea, Japan, India, Pakistan, and Vietnam. This influx of immigrants is partially responsible for Houston having a population younger than the national average.

6
Houston has two Chinatowns, as well as the third largest Vietnamese American population in the United States. Recent redevelopment of Midtown from run-down to upscale has increased property values and property taxes, but has also forced some Vietnamese-Americans into other areas of the city. The older downtown Chinatown is also disappearing.
About 90 languages are frequently spoken in the Houston area. Some neighborhoods with high populations of Vietnamese and Chinese residents have Chinese and Vietnamese street signs in addition to English ones. Houston has the second highest South African population in the United States, after Miami, Florida. The city is also noted for its large Nigerian population, counting about 100,000 native Nigerians as residents.
The Hispanic population in Houston is increasing as more illegal immigrants from Latin American countries—primarily from Mexico—look for work in Houston. The city has the third largest Hispanic population in the United States. It is estimated that about half a million are illegally in the city.
Houston, being the largest city in the United States without zoning laws, has grown in an unusual manner. Rather than a single "downtown" as the center of the city's employment, five additional business districts have grown throughout the inner-city. If these business districts were combined, they would form the third largest downtown in the United States. The city also has the third largest skyline in the country (after New York City and Chicago), but because it is spread over a few miles, pictures of the city show, for the most part, the main downtown area.
Texas Medical Center
Houston is the seat of the internationally-renowned Texas Medical Center, which contains the world's largest concentration of research and healthcare institutions.
There are 42 member institutions in the Texas Medical Center—all are not-for-profit, and are dedicated to the highest standards of patient and preventive care, research, education, and local, national, and international community well-being. These institutions include 13 renowned hospitals and two specialty institutions, two medical schools, four nursing schools, and schools of dentistry, public health, pharmacy, and virtually all health-related careers. It is where one of the first, and still the largest, air emergency service was created—a very successful inter-institutional transplant program was developed—and more heart surgeries are performed than anywhere else in the world.
Some of the academic and research health institutions are Baylor College of Medicine, The University of Texas Health Science Center at Houston, and The University of Texas M. D. Anderson Cancer Center. The M. D. Anderson Cancer Center is widely considered

7
one of the world's most productive and highly-regarded academic institutions devoted to cancer patient care, research, education and prevention.
Following the devastating effects of Hurricane Katrina on New Orleans in late August of 2005, Tulane University Medical School temporarily relocated to Baylor College of Medicine for the 2005–2006 school year.
Houston is served by two commercial airports—the largest of which is the George Bush Intercontinental Airport. The airport is the ninth-busiest in the United States for total passengers, and 19th busiest worldwide. Houston is the headquarters of Continental Airlines, Bush Intercontinental is Continental Airline's largest hub, with more than 750 daily departures (more than 250 of which are Continental flights).
Bush Intercontinental currently ranks second in the United States for non-stop domestic and international service (221 destinations), trailing only Atlanta Hartsfield with 250 destinations. The United States Department of Transportation has also recently named George Bush Intercontinental Airport one of the top ten fastest growing airports in the U.S.
The second-largest commercial airport in Houston is the William P. Hobby Airport (named Houston International Airport until 1967). The airport operates primarily small to medium-haul flights and is the only airport in Houston served by Southwest Airlines. Business travelers on shorter routes to Houston from within the United States tend to prefer Hobby over Bush Intercontinental.
The third-largest airport and former U.S. Air Force base, Ellington Field, is primarily used for government and private aircraft. At one point, Continental Express operated flights across the city to Bush Intercontinental primarily for residents of southeast Houston and Galveston County. Passenger flights, however, ended on September 7, 2004.
The Federal Aviation Administration and the state of Texas selected the Houston Airport System as Airport of the Year for 2005, largely because of its multi-year, $3.1 billion airport improvement program for both major airports in Houston.
Houston is home to the prestigious Rice University, a private institution boasting one of the largest financial endowments of any university in the world . Rice was ranked the 17th best university overall in the nation by U.S. News & World Report. The small undergraduate student body is among the nation's most select and has one of the highest percentages of National Merit Scholarship winners. Rice maintains a variety of research facilities and laboratories. Rice is also associated with the Houston Area Research Center, a consortium supported by Rice, the University of Texas at Austin, Texas A&M University, and the University of Houston.
Houston is served by the University of Houston System, the largest urban state system of higher education in the Gulf Coast. The system has four universities, all but one of which are in Houston or are partially in Houston, and two multi-institution teaching centers.
8
Their flagship institution is the University of Houston, which was founded in 1927 and is the only doctoral degree granting extensive research institution in Houston. It is the third most populous university in Texas with an enrollment of more than 35,000. The University of Houston is also home to more than 40 research centers and institutes. Among the most prestigious of the University of Houston's colleges is the University of Houston Law Center (law school). The University of Houston Law Center's Health Law and Policy Institute is ranked number one in the nation while its intellectual property law program is ranked fifth, according to U.S. News & World Report.
Texas Southern University is a historically black university located in the historic Third Ward, is heralded as a pioneer, and distinguishes itself as one of the leading producers of African American scholars that obtain collegiate, professional, and graduate degrees in the state, as well as the nation.
Houston also is home to the University of Saint Thomas, a Catholic liberal arts college following the Basilian tradition, founded by the Basilian fathers of Canada, and located in the Montrose area. Another religious college serving Houston is Houston Baptist University. South Texas College of Law, located in the heart of downtown Houston, boasts one of the nation's finest programs for trial advocacy.
Much of Houston is served by the Houston Community College System, which is one of the largest community college systems in the United States. HCCS serves the HISD portion of Houston and other areas. Parts of northern Houston are served by North Harris Montgomery Community College District. Parts of eastern and southeastern Houston are served by San Jacinto College. Many of Houston's suburbs also have their own community college systems.
Lamar High School
There are many school districts serving the city of Houston, the largest of which, the Houston Independent School District, serves a large majority of the area within the city limits. A portion of west Houston falls under the Spring Branch and Alief independent school districts. Aldine and North Forest independent school districts take up a part of northeast Houston. Parts of Pasadena, Clear Creek, Crosby, Cypress-Fairbanks, Fort Bend, Galena Park,
Huffman, Humble, Katy, New Caney, and Sheldon independent school districts also take students from the city limits of Houston.
Other agencies, such as KIPP and North Houston High School for Business, operate public alternative schools in the Houston area.

9
Houston is served by the Houston Public Library—it has 36 branches throughout the city, plus the Central Library, located Downtown. The portion of Houston within Fort Bend County is served by the Fort Bend County Libraries, in addition to Houston Public Library. The Harris County Public Library has 26 branches, primarily serving areas outside the city limits of Houston.
The Houston area is home to more than 300 private schools and several are well-known. Many of the schools are accredited by an accrediting agency recognized by Texas Private School Accreditation Commission (TEPSAC).
Among the 50 Houston Area Independent Schools are Robert M. Beren Academy, Strake Jesuit College Preparatory, Saint Agnes Academy, St. Thomas High School, Incarnate Word Academy, St. John's School, Saint Catherine's Montessori, Awty International School, The Emery/Weiner School, St. Thomas' Episcopal School, and The Kinkaid School.
In nearby city of Bellaire is the Episcopal High School. Houston-area Catholic schools are operated by the Archdiocese of Galveston-Houston.
Houston is home to the MLB Houston Astros, NFL Houston Texans, NBA Houston Rockets, WNBA Houston Comets, and AHL Houston Aeros,and the new Houston Dynamo all of whom are playing in new state-of-the-art stadiums. Minute Maid Park (home of the Astros) and Toyota Center (home of the Rockets, Comets and Aeros) are located downtown, contributing to an urban renaissance that has transformed Houston's center into a day-and-night destination. Rice Stadium, at Rice University, was the home to Super Bowl VIII, and Super Bowl XXXVIII was played at the Reliant Stadium in February 2004. Other sports facilities in Houston are Hofheinz Pavilion, Reliant Astrodome, and Robertson Stadium.
The Houston Astros advanced to the World Series for the first time in the team's history on October 19, 2005, when the team won game six of the National League Championship series against their traditional rival the St. Louis Cardinals, but the Astros subsequently lost the World Series to the Chicago White Sox, who swept the series four to zero.
Beginning in 2006, the Champ Car auto racing series will return to Houston for a yearly race, held on the streets of the Reliant Park complex. The city had previously been home to a Champ Car round from 1998 to 2001. On April 1, 2001, Houston hosted WWE's WrestleMania X-Seven at the Reliant Astrodome.
Houston is served by The Houston Chronicle, its only major daily newspaper with wide distribution. The Hearst Corporation, which owns and operates the Chronicle, bought the assets of the Houston Post, its long-time rival and main competition, when the Post ceased operations in 1995. The only other major publication to serve the city is the Houston Press, a free, alternative news journal with a weekly circulation of more than 300,000 readers.

10
Houston also is home to several TV stations and radio stations that serve the metropolitan area.
Harris County is located in Texas within the Houston–Sugar Land–Baytown metropolitan area. As of 2000 U.S. Census, the county had a population of 3.4 million (though a 2005 estimate placed the population at almost 3.7 million), making it the largest county in Texas and the third-largest county in the United States. Its county seat is Houston. Harris County is named for John Richardson Harris, an early settler of the area.
According to the U.S. Census Bureau, the county has a total area of 1,778 square miles. 1,729 square miles of it is land and 49 square miles of it (2.75 percent) is water.
Adjacent counties include: • Montgomery County (north) • Liberty County (northeast) • Chambers County (east) • Galveston County (southeast)
• Brazoria County (south) • Fort Bend County (southwest) • Waller County (northwest)
As of the census of 2000, there were 3,400,578 people, 1,205,516 households, and 834,217 families residing in the county. The population density was 1,967 persons per square mile. There were 1,298,130 housing units at an average density of 751 housing units per square mile. The racial makeup of the county was 58.73 percent Caucasian, 18.49 percent African American, 0.45 percent Native American, 5.14 percent Asian, 0.06 percent Pacific Islander, 14.18 percent from other races, and 2.96 percent from two or more races. Almost 33 32.93 percent of the population was Hispanic or Latino of any race.
There were 1,205,516 households out of which 37.70 percent had children under the age of 18 living with them, 50.60 percent were married couples living together, 13.70 percent had a female householder with no husband present, and 30.80 percent were non-
families. 25.10 percent of all households were made up of individuals and 5.30 percent had someone living alone who was 65 years of age or older. The average household size was 2.79 and the average family size was 3.38.
In the county, the population was spread out with 29.00 percent under the age of 18, 10.30 percent from 18 to 24, 33.40 percent from 25 to 44, 19.80 percent from 45 to 64, and 7.40 percent who were 65 years of age or
older. The median age was 31 years. For every 100 females there were 99.20 males. For every 100 females age 18 and over, there were 97.00 males.
44.2%
13.9%0.3%
24.8%
3.9%0.0%2.2%
10.7%
Data ACaucasianAfrican AmericanNative AmericanHispanicAsianPacific IslanderTwo or more racesOther races
Harris County Racial Composition
under 1818 to 24
25 to 4445 to 64
65 and older0.00%
10.00%
20.00%
30.00%
40.00%
Harris County Age Range

11
The median income for a household in the county was $42,598, and the median income for a family was $49,004. Males had a median income of $37,361 versus $28,941 for females. The per capita income for the county was $21,435. There were 12.10 percent of families and 15.00 percent of the population living below the poverty line , including 19.60 percent of under eighteens and 12.20 percent of those over 64.
Texas is located in the South and Southwest regions of the United States. It joined the United States in 1845 as the 28th state, after nearly ten years as the Republic of Texas, an independent country.
The state name derives from a word in a Caddoan language of the Hasinai, táyshaʔ (or tejas, as the Spaniards spelled it), meaning "those who are friends," friends or allies. Spanish explorers mistakenly applied the word to the people and their location. (The Texas Department of Transportation pays homage to the origin of Texas' name in its "Drive Friendly" safe driving campaign.)
With an area of 268,581 square miles and a population of 22.5 million, Texas is the second largest U.S. state in both area and population, and the largest state in the contiguous 48 states in area. (Alaska is the largest U.S. state in area and California is the most populous.) Texas has historically had a "larger than life" reputation, especially in cowboy films.
Texas can claim that "Six Flags" have flown over its soil: the Fleur-de-lis of France, and the national flags of Spain, Mexico, the Republic of Texas, the United States of America and the Confederate States of America.
Native American tribes who once lived inside the boundaries of present-day Texas include Apache, Atakapan, Bidai, Caddo, Comanche, Cherokee, Kiowa, Tonkawa, and Wichita. Currently, there are three federally recognized Native American tribes which reside in Texas: the Alabama-Coushatta Tribe of Texas, the Kickapoo Traditional Tribe of Texas, and the Ysleta Del Sur Pueblo of Texas.
On November 6, 1528, shipwrecked Spanish conquistador Álvar Núñez Cabeza de Vaca became the first known European to set foot on Texas. A member of the Narváez expedition, he was later enslaved by a Native American tribe of the upper Gulf coast, and explored what are now the U.S. state of Texas, New Mexico and Arizona on foot from coastal Louisiana to Sinaloa, Mexico, over a period of roughly six years. He returned to Europe in 1537, where he wrote about his experiences in a work called La relación ("The Tale").
Prior to 1821, Texas was part of the Spanish colony of New Spain. Moses Austin managed to buy land from the Spanish government in Texas. Austin purchased it with the help of Baron Felipe de Bastrop who presented the land scheme to the royal governor of Texas Antonio de Martinez. The governor passed along the favorable idea to his superior Commandant General of the Eastern Interior Province Joaquin de Arredondo. Austin was granted 200,000 acres of land of his choice.

12
After Mexican independence in 1821, Texas became part of Mexico and in 1824 became the northern section of Coahuila y Tejas. On 3 January 1823, Stephen F. Austin began a colony of 300 American families along the Brazos River in present-day Fort Bend County and Brazoria County, centered primarily in the area of what is now Sugar Land. This group became known as the "Old Three Hundred." The "Conventions" of 1832 and 1833 responded to rising unrest at the policies of the ruling Mexican government.
In 1835, Antonio López de Santa Anna, President of Mexico, proclaimed a unified constitution for all Mexican territories, including Texas. North American settlers in Texas announced they intended to secede from Mexico rather than be forced to the new Mexican constitution and instead asked for consideration under the original 1824 Mexican Constitution which allowed: freedom of religion, freedom of thought and the press and also enslavement, which Mexico had abolished under this new Consititution. Other policies that irritated the Texians included the forcible disarmament of Texian settlers, and the expulsion of immigrants and legal land owners originally from the United States of America. The example of the Centralista forces' suppression of dissidents in Zacatecas also inspired fear of the Mexican government.
On March 2, 1836, the Convention of 1836 signed the Texas "Declaration of Independence," declaring Texas an independent nation. On April 21, 1836, the Texans won their independence when they defeated the Mexican forces of Santa Anna at the Battle of San Jacinto. A factor in the defeat of Santa Anna's army at San Jacinto was the time the Texas Army got to gather itself, thanks to a small group of brave men at The Alamo and General Sam Houston's strategy of giving up land until he had properly trained his army. Santa Anna himself passed into captivity, and on May 14, Republic of Texas officials and General Santa Anna signed the treaty of Velasco. However, Santa Anna was not authorized under the Mexican Constitution to make treaties, nor did the Mexican government ratify the Treaties of Velasco.
In 1845, Texas was admitted to the United States as a constituent state of the Union. Annexation was mutually beneficial to Texas and the United States. Texas was in a very susceptible position following independence, with a weak government, little industry, and minimal infrastructure. The U.S. could not allow such a tenuous nation to sit right on its border. Texas also lay partially in the way of the U.S. expansion to the Pacific, and its "Manifest Destiny". The major stumbling block of annexation, besides the potential for war with Mexico, was the fact that Texas was a slave state and potentially would tip the balance between free and slave states due to its huge size. Some southerners were pushing for the ability to divide Texas into multiple states, thereby increasing the number of slave states even more. A compromise was reached in that if Texas were divided, any states north of the Missouri Compromise would be free states.
Some confusion has arisen over the annexation of Texas. Texas was admitted to the Union via a 'Joint Resolution for Annexing Texas to the United States' on March 1, 1845. Prior to the resolution there were several efforts to arrive at a formal annexation treaty. These efforts failed due to the ongoing struggle between 'slave', and 'free' states. Due to the requirement of the U.S. Constitution (Article II, Section 2) that all treaties be

13
approved by two-thirds of the Senate, a formal treaty was thus blocked. President John Tyler suggested that annexation be accomplished by the 'Joint Resolution for Annexing Texas to the United States' as it required only a simple majority of members from each chamber of the U.S. Congress for passage.
During the Civil War, Texas seceded from the Union February 1, 1861, and joined the Confederate States of America March 2, 1861. Texas was most useful for supplying hardy soldiers for Confederate forces (veterans of the Mexican War), and in cavalry. As a whole, Texas was mainly a "supply state" for the Confederate forces. Texans were involved in every major battle in every state throughout the war.
Texas borders New Mexico on the west; Oklahoma on the north (across the Red River); and Louisiana (across the Sabine River); and Arkansas on the east. To the southwest, across the Rio Grande, Texas borders the Mexican states of Chihuahua, Coahuila, Nuevo León, and Tamaulipas. To the southeast of Texas is the Gulf of Mexico.
Texas is so large in its east-west expanse that El Paso, in the western corner of the state, is closer to San Diego, California than to Beaumont, near the Louisiana state line; Beaumont, in turn, is closer to Jacksonville, Florida than it is to El Paso. Also, Texarkana, in the northeastern corner of the state, is closer to Chicago, Illinois than it is to El Paso. The north-south expanse is similarly impressive; Dalhart, in the northwestern corner of the state, is closer to the state capitals of Kansas, Colorado, New Mexico, Oklahoma and Wyoming than it is to Austin, its own state capital.
According to the Texas Almanac, Texas has four major physical regions: the Gulf Coastal Plains, the interior lowlands, the Great Plains, and the basin and range province. Texas is the southernmost part of the Great Plains, which ends in the south against the folded Sierra Madre Oriental of Mexico.
Texas State Capitol Austin is the capital of Texas. The State Capitol resembles the federal Capitol Building in Washington, D.C., but is faced in Texas pink granite and is topped by a statue of the "Goddess of Liberty" holding aloft a five-point Texas star. Like several other southern state capitols, it faces south instead of north. The capitol building was purposely built seven feet taller than the U.S. national capitol, however it is less massive.
The Texas Constitution, adopted in 1876, is the second oldest state constitution still in effect. As with many state constitutions, it explicitly provides for the separation of powers and incorporates its bill of rights directly into the text of the constitution (as Article I). The bill of rights is considerably lengthier and more detailed than the federal Bill of Rights, and includes some provisions unique to Texas.

14
The judicial system of Texas has a reputation as one of the most complex in the United States, with many layers and many overlapping jurisdictions. Texas has two courts of last resort: the Texas Supreme Court, which hears civil cases, and the Texas Court of Criminal Appeals. Except in the case of some municipal benches, partisan elections choose all of the judges at all levels of the judiciary; the governor fills vacancies by appointment.
Texas has a total of 254 counties, by far the most counties of any state. Each county is run by a commissioners court consisting of four elected commissioners (one from each of four precincts drawn based on population) and a county judge elected from all the voters of the county. The county judge does not have authority to veto a decision of the commissioners court; the judge votes along with the commissioners. In smaller counties, the county judge actually does perform judicial duties, but in larger counties the judge's role is limited to serving on the commissioners court. Certain officials, such as the sheriff and tax collector, are elected separately by the voters and state law specifies their salaries, but the commissioners court determines their office budgets. All county elections are partisan.
Counties also have much less legal power than municipalities. For instance, counties in Texas do not have zoning power (except in very rare circumstances). However, counties do have eminent domain power. Unlike other states, Texas does not allow for consolidated city-county governments.
Texas does not have townships; areas within a county are either incorporated or unincorporated. Incorporated areas are part of a city, though the city may contract with the county for needed services. Unincorporated areas are not part of a city; in these areas the county has authority for law enforcement and road maintenance.
Cities are classified as either "general law" or "home rule". A city may elect home rule status (draft an independent city charter) once it exceeds 5,000 population and the voters agree to home rule. Otherwise, it is classified as general law and has very limited powers. One example of the difference in the two structures regards annexation. General law cities cannot annex adjacent unincorporated areas without the property owner's consent; home rule cities may annex without consent but must provide essential services within a specified period of time (generally within three years) or the property owner may file suit to be deannexed.
Larger cities (those exceeding 225,000) have a unique authority: that of "limited annexation", whereby an adjoining area may be annexed for purposes of imposing city ordinances related to safety and building codes. The residents can vote for mayor and council races but cannot vote in bond elections (and, consequently, the city cannot collect city sales tax from businesses or city property tax from owners). The purpose of limited annexation is to allow the city to control development in an area that it eventually will fully annex; it must do so within three years (though it can arrange "non-annexation agreements" with local property owners). During each of the three years, the city must

15
develop a land use plan (zoning, for example), identify needed capital improvements, and identify the financing for such improvements as well as to provide essential services.
Municipal elections in Texas are nonpartisan in the sense that candidates do not appear on the ballot on party lines, and do not run as party tickets. However, a candidate's party affiliation is usually known or can be discerned with minimal effort (as the candidate most likely has supported other candidates on partisan tickets). In some instances, an informal citizen's group will support a slate of candidates that it desires to see elected (often in opposition to an incumbent group with which it disagreed on an issue). However, each candidate must be voted on individually.
In addition to cities and counties, Texas has numerous special districts. The most common is the independent school district, which (with one exception) has a board of trustees that is independent of any other governing authority. School district boundaries are not generally aligned with city or county boundaries; it is common for a school district to cover one or more counties or for a large city to be served by several school districts.
Other special districts include Groundwater Conservation Districts (regulatory agencies), river authorities, water supply districts (for irrigation or municipal supply), public hospitals, road districts and community colleges.
As with municipal elections in Texas, board members or trustees are elected on a nonpartisan basis or may be appointed.
Regardless of party affiliation, Texas politics are dominated by fiscal and social conservatism.
The justice system in Texas has a reputation for strict sentencing. According to the Prison Policy Initiative, of the 21 counties in the United States where more than a fifth of the residents are prison inmates, 10 are in Texas.
Texas leads the nation in executions by far, with 359 executions from 1976 to 2006. The second-highest ranking state is Virginia, with 94. Only capital murder (equivalent to such terms as "murder with malice aforethought" in other states) is eligible for the death penalty. Prior to 2005, the alternate sentence was life with the possibility of parole after 40 calendar years; a 2005 law change changed the alternate sentence to life without parole and eliminated the life with parole option.
A 2002 Houston Chronicle poll of Texans found that when asked "Do you support the death penalty?" about 69.1 percent responded that they did, 21.9 percent did not support and 9.1 percent were not sure or gave no answer.
Texas had a gross state product of $764 billion, the third highest in America after California and New York respectively. Per capita personal income as of 2004 was $30,222. Texas's growth is often attributed to the availability of jobs, the low cost of

16
housing (housing values in the Dallas and Houston areas, while generally rising, have not risen at the astronomical rates of other areas such as San Francisco), the lack of a personal state income tax, low taxation and limited regulation of business, a geographic location in the center of the country, limited government (the Texas Legislature meets only once every two years), and favorable climate in many areas of the state.
Texas remained largely rural until World War II, with cattle ranching, oil, and agriculture as its main industries. Cattle ranching (though important) was never Texas' chief industry – before the oil boom back to the period of the first Anglo settlers, the chief industry was cotton farming (as in most of the South).
In 1926, San Antonio had over 120,000 people, the largest population of any city in Texas. After World War II, Texas became increasingly industrialized. Its economy today relies largely on information technology, oil and natural gas, energy exploration and energy trading, agriculture, and manufacturing. The major segment of the economy depends largely on the region involved – for example, the timber industry is a major portion of the East Texas economy but a non-factor elsewhere, while aerospace and defense manufacturing is primarily centered within the Dallas-Fort Worth Metroplex.
The state has two major economic centers: the Greater Houston area and the Dallas-Fort Worth Metroplex. Houston stands at the center of the petrochemical and biomedical research trades while Dallas functions as the center of the aerospace/defense manufacturing and information technology labor market in Texas. Other major cities include San Antonio, Austin, Brownsville, Lubbock, Amarillo, Abilene, College Station, Beaumont, McAllen, Tyler, Odessa and Midland. Other important cities include Killeen (home to Fort Hood, the largest military post in the U.S.) and the cities of El Paso, Eagle Pass, and Laredo (these have particular significance due to their location on the border with Mexico, making them important trade points).
As of 2006, Texas, for the first time, has more Fortune 500 companies (56) than any other state (California has 55). This has been attributed to both the growth in population in Texas and the rise and oil prices in 2005, which resulted in the growth in revenues of many Texas oil and oil services companies.
Texas is the largest international exporter among the 50 American states, with international merchandise exports totaling $117.2 Billion in 2004 according to USA Today. The Port of Houston is among the top 10 sea ports in the world in terms of commerce; Air Cargo World rated Dallas-Fort Worth International Airport as "the best air cargo airport in the world".
Texas is one of the top filmmaking states in the United States, just after California and New York. In the past 10 years alone (1995-2004), more than $2.89 billion has been spent in Texas for film and television production. The Texas Film Commission was founded for free services to filmmakers, from location research to traveling.

17
Texas Population Density Map
The people of Texas, historically often known as Texians, are now generally referred to as Texans.
As of 2005, the state has an estimated population of 22,859,968, which is an increase of 388,419, or 1.7 percent, from the prior year and an increase of 2,008,176, or 9.6 percent, since the year 2000. In all three subcategories—natural (births less deaths), net immigration, and net migration—Texas has seen an increase in
population. The natural increase since the last census was 1,155,182 people (1,948,398 births minus 793,216 deaths), immigration from outside the United States resulted in a net increase of 663,161 people, and migration within the country produced a net increase of 218,722 people. The state passed New York in the 1990s to become the second-largest U.S. state in population (after California).
As of 2004, the state has 3,450,500 foreign-born residents (15.6 percent of the state population), of which an estimated 1.2 million are illegal aliens (illegal aliens account for more than one-third of the foreign-born population in Texas and 5.4 percent of the total state population).
More than one-third of Texas residents are of Hispanic origin and may be of any racial group. Some are recent arrivals from Mexico, Central America, or South America, while others, known as Tejanos (though interestingly everyone in Texas is known as a Tejano in Spanish), have ancestors who have lived in Texas since before Texan independence, or at least for several generations. Tejanos are the largest ancestral group in southern Duval County. Numerically, Mexican-Texans dominate south, south-central, and west Texas and are a significant part of the work force in the cities of Dallas and Houston.
Other population groups in Texas also exhibit great diversity. Frontier Texas saw settlements of Germans, particularly in Fredericksburg and New Braunfels. In fact, the largest family in Texas today is of German descent. After the European revolutions of 1848, German, Polish, Swedish, Norwegian, Czech and French immigration grew, and continued until World War I. The influence of the diverse immigrants from Europe survives in the names of towns, styles of architecture, genres of music, and varieties of cuisine. Texans of German descent dominate much of central and southeast-central Texas and one county in the area, Lavaca, is predominantly Czech.
In recent years, the Asian population in Texas has grown, especially in Houston and in Dallas. People from mainland China, Vietnam, the Philippines, Thailand, Indonesia, India, South Korea, Japan, Taiwan, Pakistan, and other countries have settled in Texas.

18
In August 2005, it was announced by the United States Census that Texas has become the fourth minority-majority state in the nation (after Hawaii, New Mexico, and California). According to the Texas state Data Center, if current trends continue, Hispanics will become a majority in the state by 2030.
The largest reported ancestry groups in Texas include: Mexican (24.3 percent), African American (11.5 percent), German (9.9 percent), English (7.2 percent), and Irish (7.2 percent).
Much of east, central, and north Texas is inhabited by Texans of White Anglo Saxon Protestant heritage, primarily descended from the British Isles. African Americans, who historically made up one-third of the state population, are concentrated in those parts of East Texas where the ante-bellum cotton plantation culture was most prominent, as well as in the Dallas-Fort Worth and Houston metropolitan areas.
Census data reports 7.8 percent of Texas's population as under five years of age, 28.2 percent under 18, and 9.9 percent over 64 years. Females made up 50.4 percent of the population. The state’s racial breakdown includes: 49.8 percent Caucasian, 34.6 percent
Hispanic, 11.3 percent African American, 3.1 percent Asian, 0.3 percent Native American, and 0.9 two or more races. All data comes from the United States Census state population estimates.
The religious affiliations of the people of Texas are:
• Christian – 87 percent o Protestant – 57 percent
Baptist – 22 percent Methodist – 8 percent Lutheran – 3 percent Pentecostal – 3 percent Presbyterian – 2 percent Church of Christ – 2 percent Other Protestant or general Protestant – 17 percent
o Roman Catholic – 29 percent o Other Christian – 1 percent
• Other Religions – 1 percent • Non-Religious – 12 percent-->
MexicanAfrican American
GermanEnglish
Irish0.0%
5.0%
10.0%
15.0%
20.0%
25.0%
30.0%
Largest Ancestry Groups
50.3%
11.4%0.0%
35.0%
3.1% 0.1%
Data ACaucasianAfrican AmericanNative AmericanHispanicAsianPacific IslanderTwo or more races
Texas Racial Composition

19
Texas has two out of 11 U.S. global cities as Houston and Dallas ranked "Gamma World City" by the Globalization and World Cities Study Group & Network (GaWC).
Ranked by population of cities (incorporated municipalities), the six major cities in Texas are Houston, San Antonio, Dallas, Austin, Fort Worth, and El Paso.
Texas is the only state in the U.S. to have three cities with populations exceeding one million (California has two; no other state has more than one) — Houston, San Antonio, and Dallas, which are also among the 10 largest cities of the United States, and are the three largest cities in the Southern United States. Austin and Fort Worth are in the top 20 largest U.S. cities.
Texas has 25 metropolitan areas (MSAs) defined by the United States Census Bureau. The two largest are ranked among the top 10 United States metropolitan areas.
As of June 2003, there is now an additional classification, that of a “Metropolitan Division”. Texas has two metropolitan divisions within the Dallas–Fort Worth–Arlington MSA. The term metropolitan division is used to refer to a county or group of counties within a metropolitan area that has a population core of at least 2.5 million. While a metropolitan division is a subdivision of a larger metropolitan area, it often functions as a distinct social, economic, and cultural area within the larger region.
State Highway 45, the first of several toll roads in Central Texas, under construction
Texas freeways are heavily traveled and are often under construction to meet the demands of continuing growth. As of 2005, there were 79,535 miles of public highway in Texas (up from 71,000 in 1984). Texas Department of Transportation (TxDOT) planners have sought ways to reduce rush hour congestion, primarily through High-occupancy vehicle (HOV) lanes for vans and carpools. The "Texas T," an innovation originally introduced in Houston, is a ramp design that allows vehicles in the HOV lane, which is usually the leftmost lane, to exit directly to transit centers or to enter the freeway directly into the HOV lane without crossing multiple lanes of traffic. Timed freeway entrances, which regulate the addition of cars to the freeway, are also common. Houston and San Antonio have extensive networks of freeway cameras linked to transit control centers to monitor and study traffic.
One characteristic of Texas's freeways are its frontage roads. Alongside most freeways are two to four lanes in each direction parallel to the freeway permitting easy access to individual city streets. Other states have frontage roads, of course, but in Texas they can be found even in the most remote areas. Frontage roads provide access to the freeway from businesses alongside, such as gas stations and retail stores, and vice versa. New

20
landscaping projects and a longstanding ban on new billboards are ways Houston has tried to control the potential side effects of convenience.
Dallas-Fort Worth International Airport
The Dallas-Fort Worth International Airport, located nearly equidistant from downtown Dallas and downtown Fort Worth, is the largest airport in state, the second largest in the United States, and third largest in the world. In terms of traffic, DFW is the busiest in the state, fourth busiest in the United States, and sixth busiest in the world. The airport serves 135 domestic destinations and 37 international, and is the largest and main hub for American Airlines (900 daily
departures), the world's largest airline, and also the largest hub for American Eagle.
Texas's second-largest air facility is the George Bush Intercontinental Airport (IAH). The airport is the ninth-busiest in the United States for total passengers, and nineteenth busiest worldwide. Houston is the headquarters of Continental Airlines, and the airport is Continental Airline's largest hub, with over 750 daily departures (over 250 operated by Continental Airlines). Because of Houston's proximity to American Airlines's hub at DFW in Dallas-Fort Worth, that airline also maintains a large presence at IAH. A long list of cities within Texas, as well as international destinations are served directly from this airport. With 30 destinations in Mexico, IAH offers service to more Mexican destinations than any other U.S. airports. IAH currently ranks second in the United States among U.S. airports with scheduled non-stop domestic and international service (221 destinations), trailing only Atlanta Hartsfield with 250 destinations.5
The Federal Deposit Insurance Corporation report Texas State Profile – Spring 2006 states employment revisions reveal a more robust Texas economy. Recent revisions by the U.S. Bureau of Labor Statistics have placed 2005 Texas employment growth at 2.5 percent, for a net gain of 237,900 jobs. The new job numbers were significantly higher than previously estimated, depicting a much stronger Texas economy. Indeed, the revisions showed the state growing over a percentage point faster accounting for an additional 100,000 plus net jobs.
Most major sectors of the Texas economy are expanding, except for the information and other services sectors. The information sector, primarily telecommunications, is still troubled by cost restructuring, overcapacity, and weak demand. Meanwhile, the professional and business services and education and health services sectors figure to be major sources of employment for Texans in 2006.
5 Wikipedia, U. S. Census Bureau

21
Current state economic indicators point to continued solid growth for the Texas economy in 2006. For instance, the Texas coincident and leading indicators (see Chart 1) have accelerated over the past year. Moreover, the Texas Business Leaders Confidence Index (BLCI) rebounded strongly in first quarter 2006 after dipping slightly in fourth quarter 2005 because of lingering concerns surrounding the aftereffects of Hurricane Katrina and Rita. Business leaders across the state in a broad range of industries now view the outlook for the Texas economy as strong, with rising sales and profits fueling greater hiring and capital expenditures.
Goods-producing industries should provide a major lift to the state’s economy. The goods-producing sectors of manufacturing, construction, and natural resources and mining experienced severe employment losses during or following the 2001 recession. The manufacturing sector, in particular, has suffered enormously losing 16 percent of its employment base between first quarter 2001 and first quarter 2005 (see Chart 2). However, 2006 may prove to be a turning point for these sectors as the Texas economy gathers momentum and once again exceeds the U.S. economy in output and employment growth.
22
Energy prices are forecast to remain high throughout 2006 supporting employment gains in the state’s important oil and natural gas industry. Drilling rig activity in Texas soared 23 percent between February 2005 and February 2006. A major beneficiary of the strong energy sector will be the Houston economy, which is perhaps the healthiest of the state’s large metropolitan areas.
The state’s construction sector is expected to move countercyclically with regard to the nation’s construction sector in 2006. The U.S. housing market, including home price growth, is forecast to slow this year because of rising mortgage rates and higher home inventories. However, Texas housing activity is expected to strengthen somewhat in 2006, supported by strong demand fundamentals in employment and income growth. Not only are homebuilding and sales activity expected to stay near record highs, but home price appreciation in several of the state’s large metropolitan markets may also be poised to accelerate.
Solid 2005 results suggest institutions have benefited from higher short-term interest rates. Banks and thrifts headquartered in Texas posted a median return on assets of 1.14 percent for calendar year 2005, the highest rate since the 2001 recession and higher than the national average of 1.04 percent.
Improving credit quality has allowed provision expenses to remain at decade-low levels, but there is little room for further declines in this expense category.
The strong positive correlation between short-term interest rates and median net interest margins (NIM) at Texas financial institutions suggests that the state’s institutions have been relatively asset sensitive, and have therefore benefited from recent short-term interest rate hikes. However, the yield curve is flattening and the yield curve spread is at its lowest level since first quarter 2001. Historically, this condition has created challenges for bank earnings and implies increasing pressure on margins going forward.
The median cost of funds for Texas insured institutions was 1.79 for fourth quarter 2005, ranking fourth lowest nationwide. Texas institutions tend to hold higher levels of non-interest bearing deposits and enjoy a relatively high percentage of funding from core sources (seventh highest in the nation). Additionally, more than half of the state’s insured institutions are in rural areas that often have fewer market competitors and provide bankers with greater influence in determining interest rates for both loan and deposit products.
The divide in profitability between large and small financial institutions remains. More than half of all insured institutions in Texas hold less than $100 million in assets, and earnings for these institutions are driven in large part by NIM. Many of these community financial institutions have benefited from the recent increase in short-term interest rates.
The median return on assets ratio for large community institutions (assets between $100 million and $1 billion) was 1.27 percent for the year ending December 2005, compared

23
with 1.05 percent for small community institutions (less than $100 million in assets). This trend has been prevalent for the past decade (see Chart 3).
While small community banks tend to have higher NIMs, large community banks earn more non-interest income and enjoy lower overhead costs due to greater economies of scale.6
6 Federal Deposit Insurance Corporation

24
References
City of Houston, www.houstontx.gov
Federal Deposit Insurance Corporation, Texas State Profile Spring – 2006, www.fdic.gov (6)
Greater Houston Convention and Visitors Bureau, Cost of Living, www.visithousontexas.com (2)
Greater Houston Convention and Visitors Bureau, Business and Economy, www.visithousontexas.com (4)
U. S. Census Bureau, Houston, Harris County, Texas, www.census.gov (1) (3) (5)
Wikipedia, Houston, Harris County, Texas, www.wikipedia.com (1) (3) (5)

International Glossary

INTERNATIONAL GLOSSARY OF BUSINESS VALUATION TERMS
Asset Sales Analysis –
• Seller Keeps cash and receivable but delivers company free of any debt. • Seller keeps corporate entity to later dissolve or use for new endeavor. • Seller pays combination of capital gains tax and ordinary income. • Buyer and seller agree to allocation of purchase price between IRS asset
categories. • Buyer may redepreciate fixed assets based on allocation. • Buyer avoids assuming both known and unknown liabilities. • If price is greater than identifiable, tangible assets, the excess is allocated to one
or more intangible assets (written off over fifteen years for tax purposes and up to forty-two for book purposes).
Business Valuation – The act or process of determining the value of a business enterprise or ownership interest therein. Capitalization – A conversion of a single period of economic benefits into value. Capitalization Factor – Any multiple or divisor used to convert anticipated economic benefits of a single period into value. Capitalization of Earnings Method – A method within the income approach whereby economic benefits for a representative single period are converted to value through division by a capitalization rate. Capitalization Rate – Any divisor (usually expressed as a percentage) used to convert anticipated economic benefits of a single period into value. Cash Flow – Cash that is generated over a period of time by an asset, group of assets, or business enterprise. It may be used in a general sense to encompass various levels of specifically defined cash flows. When the term is used, it should be supplemented by a qualifier (for example, “discretionary” or “operating”) and a specific definition in the given valuation context. Cash and Equivalents – All cash, marketable securities, and other near-cash items. Excludes sinking funds. Cash equivalent (NOW accounts and money market funds) must be available upon demand in order to justify inclusion).

Glossary (continued) Control – The power to direct the management and policies of a business enterprise. Control Premium – An amount or a percentage by which the pro rata value of a controlling interest exceeds the pro rata value of a non-controlling interest in a business enterprise, to reflect the power of control. Cost Approach – A general way of determining a value indication of an individual asset by quantifying the amount of money required to replace the future service capability of that asset. Discount for Lack of Control – An amount or percentage deducted from the pro rata share of value of 100% of an equity interest in a business to reflect the absence of some or all of the powers of control. Discount for Lack of Marketability – An amount or percentage deducted from the value of an ownership interest to reflect the relative absence of marketability. Discretionary Earnings – ([Net Income] + [Taxes] + [Interest Expense] + [Owners Compensation] + [Noncash Charges]). EBITDA - Earnings Before Interest, Taxes, Depreciation and Amortization – One definition of cash flow or operating profit. EBIT – Earnings before Interest and Taxes - One definition of cash flow or operating profit. EBIT / Interest Expense – [Net Income + Taxes + Interest Expense] / [Interest Expense] (also known as Fixed Charge Coverage) EBIT / Sales – [Net Income + Taxes + Interest Expense] / [Sales] (also known as Operating Profit Margin) EBT (Earnings Before Taxes) – Operating Profit minus Interest Expense. Economic Benefits – Inflows such as revenues, net income, net cash flows, etc. Economic Life – The period of time over which property may generate economic benefits. Effective Date – The specific point in time as of which the valuator’s opinion of value applies (also referred to as “Valuation Date” or “Appraisal Date”). Enterprise – A commercial, industrial, service, or investment entity (or a combination thereof) pursuing an economic activity.

Glossary (continued) Equity – The owner’s interest in property after deduction of all liabilities. Equity Price – Reported Selling Price (includes the noncomplete value and excludes any long term liabilities assumed, real estate value and employment/consulting agreement value). Equity Price / Book Value of Equity – [Equity Price] / [Total Assets – Total Liabilities] Equity Price / EBT – [Equity Price] / ([Net Income] + [Taxes]) Equity Price / Gross Cash Flow – [Equity Price] / ([Net Income] + [Noncash Charges]) Equity Price / Net Income – [Equity Price] / [Net Income] Equity Price / Net Sales – [Equity Price] / [Net Sales] Fair Market Value – The price, expressed in terms of cash equivalents, at which property would change hands between a hypothetical willing and able buyer and a hypothetical willing and able seller, acting at arms length in an open and unrestricted markets, when neither is under compulsion to buy or sell and when both have reasonable knowledge of the relevant facts. [Note: In Canada, the term “price” should be replaced with the term “highest price”.] Fixed Assets – All property, plant, leasehold improvements, and equipment, net of accumulated depreciation or depletion. Going Concern – An ongoing operating business enterprise. Going Concern Value – The value of a business enterprise that is expected to continue to operate into the future. The intangible elements of Going Concern Value result from factors such as having a trained work force, an operational plant, and the necessary licenses, systems, and procedures in place. Goodwill – That intangible asset arising as a result of name, reputation, customer loyalty, location, products, and similar factors not separately identified. Goodwill Value – The value attributable to goodwill. Income (Income-Based) Approach – A general way of determining a value indication of a business, business ownership interest, security, or intangible asset using one or more methods that convert anticipated economic benefits into a present single amount.

Glossary (continued) Intangibles – Assets with uncertain or hard-to-measure benefits such as brand names, trademarks, patents or copyrights, a trained workforce, special know-how, and customer or supplier relationships, that make the company viable. Intangible Assets – Non-physical assets such as franchises, trademarks, patents, copyrights, goodwill, equities, mineral rights, securities and contracts (as distinguished from physical assets) that grant rights and privileges, and have value for the owner. Interest Expense – Cost of borrowing expressed as an annual dollar amount. Inventory – Anything constituting inventory for the firm including raw material, work in progress and finished goods. Those items of tangible property which are held for sale in the normal course of business, are in the process of being produced for such purposes, or are to be used in the production of such items. Long-term Debt / Total Assets – [Long-term Liabilities] / [Total Assets] Market (Market-Based) Approach – A general way of determining a value of indication of a business, business ownership interest, security, or intangible asset by using one or more methods that compare the subject to similar businesses, business ownership interests, securities, or intangible assets that have been sold. Market Multiple – The market value of a company’s stock or invested capital divided by a company measure (such as economic benefits, number of customers). Marketability – The ability to quickly convert property to cash at minimal cost. Minority Discount – A discount for lack of control applicable to a minority interest. Minority Interest – An ownership interest less than 50% of the voting interest in a business enterprise. MVIC (Market Value of Invested Capital) - Equity Price + Long Term Liabilities Assumed MVIC / Book Value of Invested Capital – [Equity Price + Long Term Liabilities Assumed] / ([Total Assets – Total Liabilities] + Long-term Liabilities]) MVIC / Discretionary Earnings – MVIC / ([Net Income] + [Taxes] + [Interest Expense] + [Owners Compensation] + [Noncash Charges]) MVIC / EBIT – [Equity Price + Long Term Liabilities Assumed] / ([Net Income] + [Interest Expense] + [Taxes])
Glossary (continued) MVIC / EBITDA – [Equity Price + Long Term Liabilities Assumed] / ([Net Income] + [Interest Expense] + [Taxes] + [Noncash Charges]) MVIC / Net Sales – [Equity Price + Long Term Liabilities Assumed] / [Net Sales] North American Industry Classification System (NAICS) – A new economic classification system adopted by the United States, Canada, and Mexico for defining industries and classifying establishments by industry. It replaces the SIC in the United States. Net Book Value – With respect to a business enterprise, the difference between total assets (net accumulated depreciation, depletion, and amortization) and total liabilities as they appear on the balance sheet (synonymous with Shareholder’s Equity). With respect to a specific asset, the capitalized cost less accumulated amortization or depreciation as it appears on the books of account of the business enterprise. Net Income / Sales – [Net Income] / [Sales] (also known as Net Profit Margin) Non-Operating Assets – Assets not necessary to ongoing operations of the business enterprise. [Note: In Canada, the term is “Redundant Assets.] Other Current Assets – Any other current assets, excluding Cash and Equivalents, Trade Receivables and Inventory. Price/Earnings Multiple – The price of a share of stock divided by its earnings per share. Rate of Return – An amount of income (loss) and/or change in value realized or anticipated on an investment, expressed as a percentage of that investment. Real Estate – Dollar value placed on any real estate associated with the sale of the business. The real estate value is not included in the Equity Price or MVIC. Required Rate of Return – The minimum rate of return acceptable by investors before they will commit money to an investment at a given level of risk. Return on Assets – [Net Income] / [Total Assets] Return on Equity – [Net Income] / [Total Assets – Total Liabilities] Rule of Thumb – A mathematical formula developed from the relationship between price and certain variables based on experience, observation, hearsay, or a combination of these; usually industry specific.

Glossary (continued) Sales / Total Assets – [Sales] / [Total Assets] (also known as Asset Turnover) Sales / Fixed Assets – [Sales] / [Fixed Assets] Seller’s Discretionary Cash Flow (SDCF) – See Cash Flow Standard of Value – The identification of the type of value being used in a specific engagement; e.g. fair market value, fair value, investment value. Standard Industrial Code (SIC) – A classification used by the United States government to identify the industry in which a business operates. Stock Sale Analysis –
• Seller pays primarily capital gains tax rather than higher ordinary income tax rate. • Seller endorses stock certificates over to new owner. • Buyer assumes all assets and liabilities unless specifically excluded. • Buyer takes on risk associated with unknown liabilities. • Buyer inherits tax depreciation schedules as they are (for better or mostly worse). • Buyer may inherit tax loss carry forwards to shield future income. • There is no allocation of purchase prices or goodwill related to transaction.
Tangible Assets – Physical assets (such as cash, accounts receivable, inventory, property, plant and equipment, etc.). Total Current Assets – Cash and Equivalent plus Trade Receivables plus Inventory plus Other Current Assets. Trade Receivables – All accounts from trade, net of allowance for doubtful accounts, that will result in the collection of cash. Valuation – The act or process of determining the value of a business, business ownership interest, security, or intangible asset. Valuation Approach – A general way of determining a value indication of a business, business ownership interest, security, or intangible asset using one or more valuation methods. Valuation Method – Within approaches, a specific way to determine value.


![Reward & Appraisals[1]](https://img.dokumen.tips/doc/110x75/577d214d1a28ab4e1e94eb28/reward-appraisals1.jpg)