Embed Size (px)
Citation preview
Non-Covalent Functionalization of Carbon Nano-Onions
with Pyrene-BODIPY Dyads for Biological Imaging
Juergen Bartelmess,a,§ Marco Frasconi,a,§ Preethi B. Balakrishnan,b Angelo Signorelli,a
Luis Echegoyen,c Teresa Pellegrino,b Silvia Giordani*,a
a Istituto Italiano di Tecnologia (IIT), Nano Carbon Materials, Via Morego 30, 16163 Genova, Italy.
b Istituto Italiano di Tecnologia (IIT), Drug Discovery and Development, Via Morego 30, 16163 Genova,
Italy.
c University of Texas at El Paso, Department of Chemistry, 500 W. University Ave., El Paso, TX 79968,
USA.
§These authors contributed equally to this work.
1
Electronic Supplementary Material (ESI) for RSC Advances.This journal is © The Royal Society of Chemistry 2015

S3-S4 Materials, instrumentation and methods
S4 Table S1
S5 Comparison p-CNO/3 and BODIPY 3 in DMSO – Absorption and Fluorescence
S6 ATR FT-IR spectrum of 3, p-CNO, p-CNO/3, benz-CNO and benz-CNO/3 hybrids
S7 Viability Assay
S8-S12 Cellular Imaging
S13 References
2

Materials, instrumentation and methods.
Absorption spectra were recorded on a Varian Cary 300scan UV-Visible spectrophotometer or
on an Agilent Cary 8454 UV-Vis diode array spectrophotometer. Corresponding fluorescence
spectra were taken on a Varian Cary Eclipse fluorescence spectrophotometer or on a Horiba
Jobin Yvon Fluoromax-4 spectrofluorometer in 1.00 x 1.00 cm quartz glass cells. Fluorescence
quantum yields were determined by the comparative method of Williams et al..1 Toward this, the
integrated fluorescence intensities of a known dye and the tested compound were compared and
fluorescence quantum yields were calculated using the following equation:
x = (st) (Gradx / Gradst) (2x / 2
st)
st and x denotes the standard and test respectively, while is the fluorescence quantum yield.
Grad is the gradient obtained from the plot of integrated fluorescence intensity vs. absorbance of
the dye at the excitation wavelength. represents the refractive index of the used solvents. The
fluorescence quantum yields of 3 was measured relative to meso-phenol BODIPY with
St = 0.64 in toluene at an excitation wavelength of 485 nm.2
For the fluorescence lifetime measurements, a home-built scanning confocal microscope was
used.3 The excitation source was a super-continuum laser producing 50 ps pulses. The 488 nm
excitation beam used for the measurements was obtained by spectrally filtering (Bright Line HC
488/6 nm, AHF analysentechnik) the super-continuum beam. Successively, the beam was
reflected by a dichroic mirror (zt-488-RDC, AHF analysentechnik) and focused by an oil
immersion objective. The fluorescence was collected by the same objective. The histograms of
photon arrival times were accomplished by a time-correlated single photon card (TCSPC) (SPC-
3

830, Becker & Hickl). The fitting to the TCSPC data included a single-exponential decay and a
convolution with the instrument response function.
ATR FT-IR spectroscopy was carried out on a Bruker Vertex 70v FT-IR spectrometer equipped
with a Platinum ATR accessory.
The Accurate Mass measurements (HRMS) were performed on a Waters SYNAPT G2 High
Resolution Mass Spectrometry instrument equipped with an Electrospray Ionization interface
and coupled to a Waters ACQUITY UPLC. Electrospray ionization in positive mode was applied
in the mass scan range 50-1200 Da. The analysis were performed on a Waters ACQUITY UPLC
BEH C18 column 100 x 2.1 mm ID (particle size 1.7 µm) with an in-line filter. The mobile phase
was 0.1% formic acid in H2O and 0.1% formic acid in acetonitrile.
NMR spectroscopy was performed on a Bruker Avance III 400 MHz system (400.13 MHz for 1H
and 100.62 MHz for 13C) in CDCl3, purchased from Sigma-Aldrich.
Table S1. Spectroscopic data of 3 in toluene and DMSO.
Solvent Abs max
[nm]
[M-1 cm-
1]
Em max
[nm]
F* Stokes Shift
[nm]
F [ns]
toluene 503 94.7 515 0.72 12 3.35 +/- 0.02
DMSO 501 87.0 513 0.71 12 3.75 +/- 0.05
* measured relative to 4,4-difluoro-8-(4-(hydroxy)phenyl)-1,3,5,7-tetramethyl-4-bora-3a,4a-
diaza-s-indacene, which is reported with a fluorescence quantum of 0.64 in toluene.2 Excitation
at 485 nm.
4
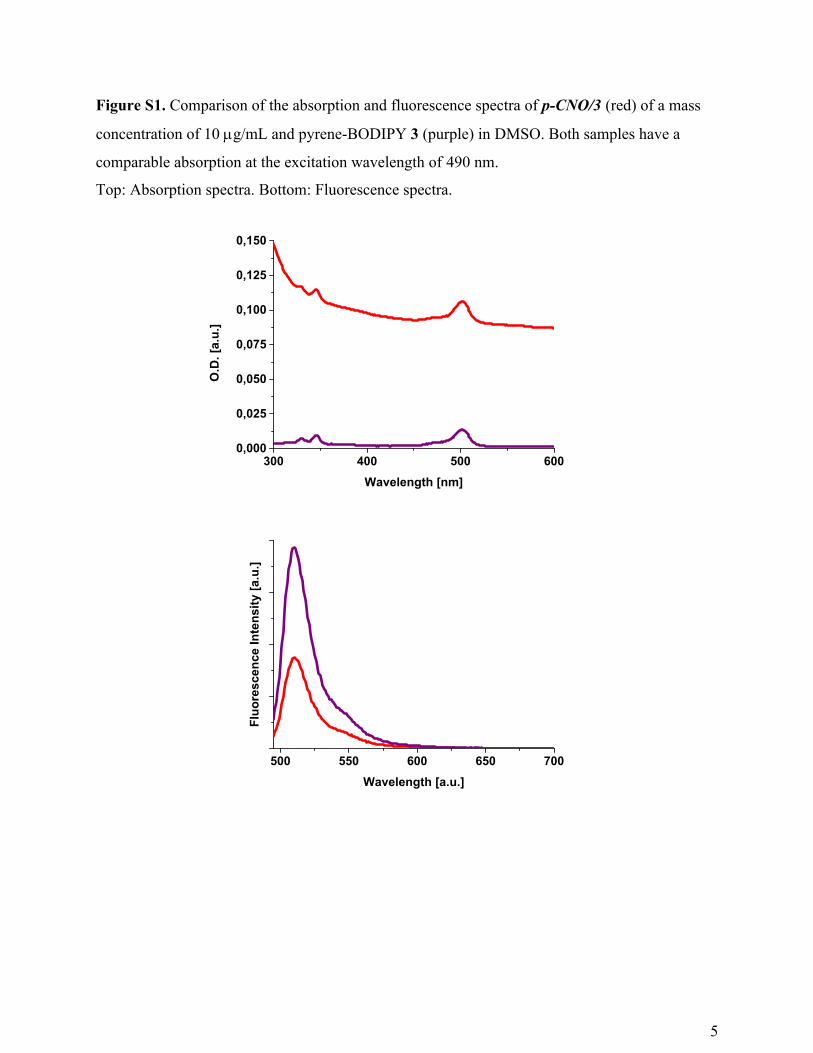
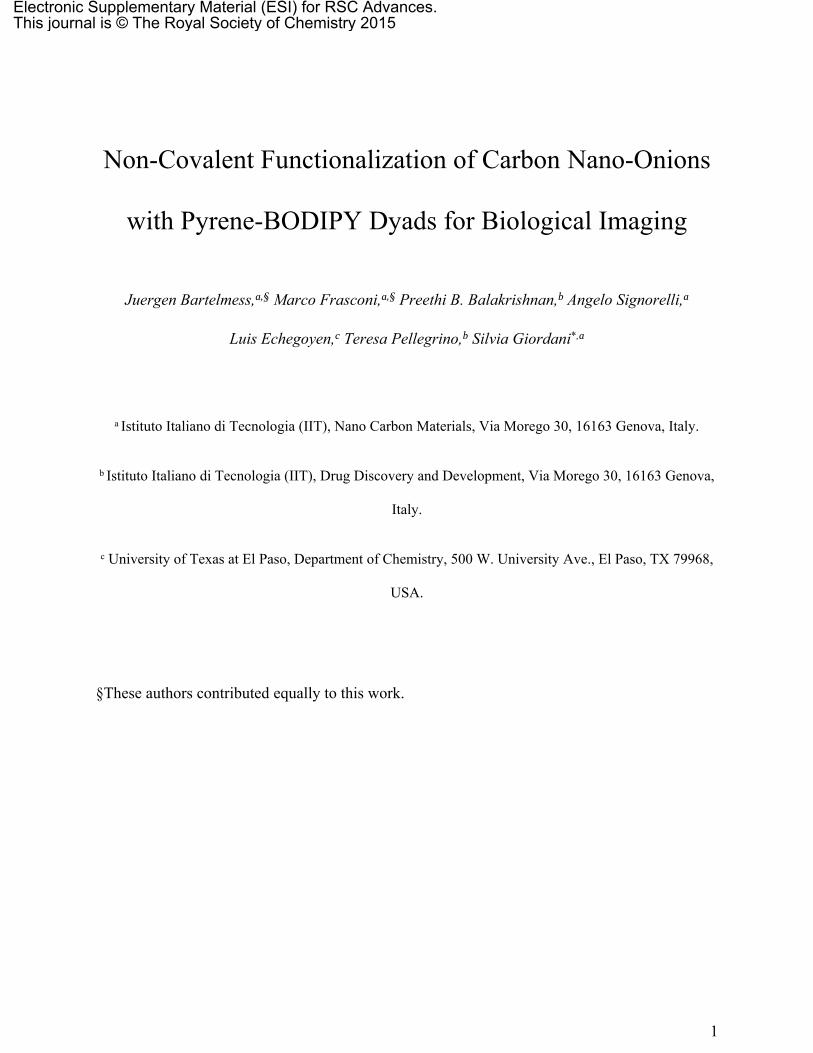
Figure S1. Comparison of the absorption and fluorescence spectra of p-CNO/3 (red) of a mass
concentration of 10 g/mL and pyrene-BODIPY 3 (purple) in DMSO. Both samples have a
comparable absorption at the excitation wavelength of 490 nm.
Top: Absorption spectra. Bottom: Fluorescence spectra.
300 400 500 6000,000
0,025
0,050
0,075
0,100
0,125
0,150
O.D
. [a.
u.]
Wavelength [nm]
500 550 600 650 700
Fluo
resc
ence
Inte
nsity
[a.u
.]
Wavelength [a.u.]
5
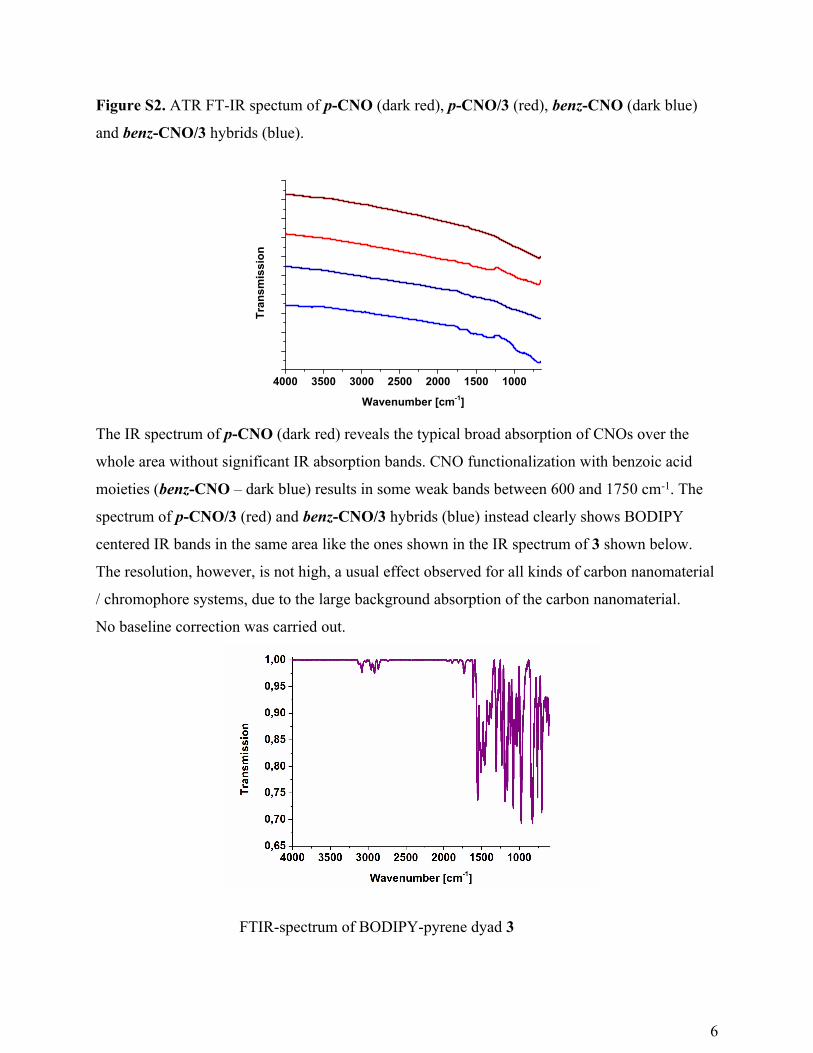
Figure S2. ATR FT-IR spectum of p-CNO (dark red), p-CNO/3 (red), benz-CNO (dark blue)
and benz-CNO/3 hybrids (blue).
4000 3500 3000 2500 2000 1500 1000
Tran
smis
sion
Wavenumber [cm-1]
The IR spectrum of p-CNO (dark red) reveals the typical broad absorption of CNOs over the
whole area without significant IR absorption bands. CNO functionalization with benzoic acid
moieties (benz-CNO – dark blue) results in some weak bands between 600 and 1750 cm-1. The
spectrum of p-CNO/3 (red) and benz-CNO/3 hybrids (blue) instead clearly shows BODIPY
centered IR bands in the same area like the ones shown in the IR spectrum of 3 shown below.
The resolution, however, is not high, a usual effect observed for all kinds of carbon nanomaterial
/ chromophore systems, due to the large background absorption of the carbon nanomaterial.
No baseline correction was carried out.
FTIR-spectrum of BODIPY-pyrene dyad 3
6

Viability Assay
Figure S3. Cellular viability of HeLa wt cells after exposure to different concentrations (2, 5, 10,
20 g/ml) of p-CNO (A) and benz-CNO (B) after 12 (yellow), 24 (green), 48 (red) and 72
(black) hours of incubation at 37 oC.
7

Mechanism of Cellular Uptake
HeLa cells, grown in the 24 well chamber plates, were treated with 500 L of medium with p-
CNO/3 at concentration of 2 and 10 g/ml. The cells were incubated for 30 min at 4 oC or 37 oC.
The cells were then washed thoroughly with PBS, tagged with DAPI dye for nuclear staining and
fixed using 4% paraformaldehyde. The coverslips containing the fixed cells were than retrieved
and glued over a glass-slide for confocal microscopy imaging.
Cellular Localization
The cells were incubated for 30 min with 2, 5 and 10 g/ml of p-CNO/3 in medium. After the
treatment, all the wells containing cells were washed carefully with PBS to remove the adsorbed
CNO samples. One set of cells were incubated for an extra 2 hours with fresh cell media. Then
all of them were stained with LysoTracker Red DND-99, a dye that tags endosomes and
lysosomes and Hoechst 33342 for live nuclear staining. The samples were then fixed following
the same procedure described in previous section.
8

Figure S4. Confocal images of fixed HeLa cells incubated for 30 min with 2 g/ml (A,B), 5
g/ml (C,D), 10 g/ml (E,F) of p-CNO/3 at 37 oC. After washing the cells from the excess of p-
CNO/3, the cells were stained and fixed.. Blue: Hoechst 33342; Red: LysoTracker Red DND-99
and Green: p-CNO/3. Merged image with the colocalization (yellow) of p-CNO/3 within the
lysosomes. Scale bar 25µm.
9

Figure S5. Confocal images of fixed HeLa cells incubated for 30 min with 2 g/ml (A,B), 5
g/ml (C,D), 10 g/ml (E,F) of p-CNO/3 at 37 oC. After washing the cells from the excess of p-
CNO/3, allowed to stand in DMEM media for an additional 2h, washed, stained and fixed. Blue:
Hoechst 33342; Red: LysoTracker Red DND-99 and Green: p-CNO/3. Merged image with the
colocalization (yellow) of p-CNO/3 within the lysosomes. Scale bar 25µm.
10
Figure S6. Confocal images of fixed HeLa cells incubated for 30 min with 2 g/ml of p-CNO/3
at 4 oC (A,B) and 37 oC (C,D). Cells were stained with Hoechst (blue). Scale bar 25 m.
11
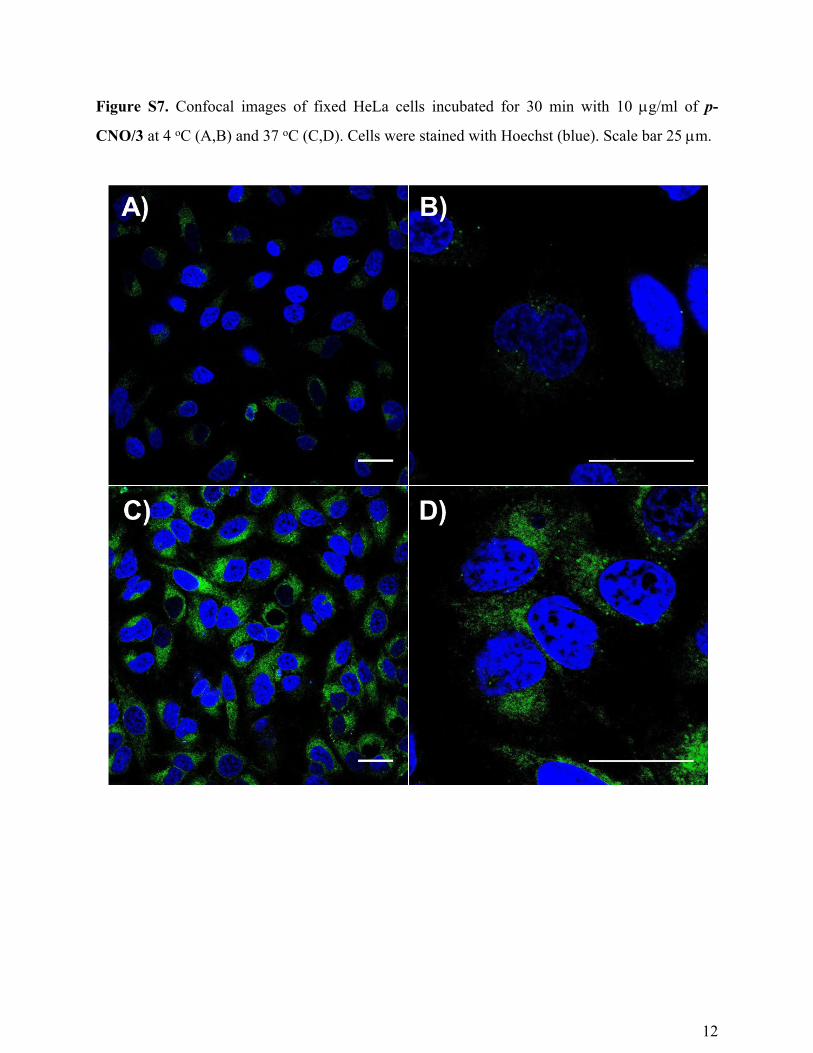
Figure S7. Confocal images of fixed HeLa cells incubated for 30 min with 10 g/ml of p-
CNO/3 at 4 oC (A,B) and 37 oC (C,D). Cells were stained with Hoechst (blue). Scale bar 25 m.
12
References
1 A. T. R. Williams, S. A. Winfield, J. N. Miller, Analyst 1983, 108, 1067.
2 Lazarides, T.; Kuhri, S.; Charalambidis, G.; Panda, M. K.; Guldi, D. M.; Coutsolelos, A. G.
Inorg. Chem. 2012, 51, 4193.
3 Vicidomini, G.; Coto Hernandez, I.; d’Amora, M.; Cella Zanacchi, F.; Bianchini, P.; Diaspro, A. Methods 2014, 66, 124.
13


![Benzo[a]pyrene in River Sediment](https://img.dokumen.tips/doc/110x75/613d64f9736caf36b75cd07b/benzoapyrene-in-river-sediment.jpg)