Embed Size (px)
Citation preview

1/8/2015
1
EMS Finance FundamentalsEMS Finance
Fundamentals
Jerry Overton
ChairBoard of Accreditation
International Academies of Emergency Dispatch
Jerry Overton
ChairBoard of Accreditation
International Academies of Emergency Dispatch
Conflict of Interest Disclosure
NONE
A conflict of interest exists when an individual is in a position to profit directly or indirectly through application of authority, influence, or knowledge in relation to the affairs of ABC. A conflict of interest also exists if a relative benefits or when the organization is adversely affected in any way.

1/8/2015
2
Or . . .
The Old Axiom
“Nothing in life is free!”
EMS Finance
“Is this the best we can do with the financial resources
available?”

1/8/2015
3
EMS Finance Misconceptions
• Price (Rates) = Costs• Component Costs = System Costs
• More Local Tax Support = Better Service
• Volunteers = Free Service
Total Cost of Providing Service
Emergency Medical Services Costs –
Definitions
Cost Definitions
• Direct Costs• Indirect Costs• Fixed Costs• Marginal Costs

1/8/2015
4
Cost Definitions
• Direct Costs – A cost that can be traced specifically to a particular service of product• Paramedic Labor• Fuel• Medical Supplies
Cost Definitions
• Indirect Costs – A cost that cannot be traced to a particular service
• Administrative Overhead • Information Technology• Marketing • Billing Service• Legal and Accounting• Insurance
Cost Definitions• Fixed Cost – A cost that does not
change in total for a given time or activity• Vehicles• Communication Infrastructure

1/8/2015
5
Cost Definitions
• Marginal Cost – A cost that fluctuates in total in direct proportion to changes in activity• The addition of additional staffing (Unit Hours) to a schedule
Total Cost of Providing Service
Emergency Medical Services Costs –
General Principles
The Cost of Producing Service

1/8/2015
6
General Principles
• Cost of Readiness• Productivity• Revenues
“Without data, data will be made up.”
General Principles
General Principles
• Before Proceeding• All Cost Centers Identified• All Costs Accurately Reported

1/8/2015
7
General Principles
• Cost of Readiness
Cost of Readiness• Strategically Deployed
Distribution Network• Production Capacity Must Exceed
Supply and Demand• Time Dependent Service Delivery
Cost of Readiness• Fixed Costs• NOT Volume Driven Unless
Excess Capacity Exceeded• Length of Trip has Little Effect

1/8/2015
8
Special Considerations
• Urban • Suburban• Rural
General Principles• Cost of Readiness
• Productivity
ProductivityKey Concepts
• Total System Cost per Capita• Cost per Unit Hour• Unit Hour Utilization Ratio• Cost per Transport

1/8/2015
9
Total System Cost per Capita
Total System CostPopulation Served = Cost per Capita
$0.00
$10.00
$20.00
$30.00
$40.00
$50.00
$60.00
Fort W
ayne,
IN
Fort W
orth, T
X
Kansas C
ity, M
O
Oklahom
a City
, OK
Pinellas C
ounty, F
L
Reno, NV
Richmond
, VA
Tulsa,
OK
Clark Coun
ty, W
A
Davenpo
rt, IA
Little R
ock,
AR
Mecklen
burg, N
C
Montere
y Cou
nty, C
A
Solano Coun
ty, C
AMean
Median
Total System Cost Per CapitaUnited States
Productivity
• Total System Cost per Capita• Cost per Unit Hour• Unit Hour Utilization Ratio• Cost per Transport

1/8/2015
10
Cost per Unit Hour
Basic Terminology
Unit Hour - A fully equipped and staffed ambulance on a response or waiting for a response for one hour.
Unit Hour Costs
EMS does not manufacture accidents and illness.
EMS only manufactures Unit Hours and . . . then waits.

1/8/2015
11
Unit Hour Costs
• Ranges from $75-$150 Cost per Unit Hour
• Direct Labor Costs Comprise Over 70% - 80% of the Total Average Unit Hour
• Marginal Unit Hour Costs are 60 - 75% of total Unit Hour Costs
Cost per Unit Hour
Total CostsTotal Number of Unit
Hours= Total Unit Hour
Costs
$0.00
$50.00
$100.00
$150.00
$200.00
$250.00
$300.00
$350.00
$400.00
Fort W
ayne,
IN
Fort W
orth, T
X
Kansas C
ity, M
O
Oklahom
a City
, OK
Pinellas C
ounty, F
L
Reno, NV
Richmond
, VA
Tulsa,
OK
Clark C
ounty,
WA
Davenpo
rt, IA
Little R
ock,
AR
Meck
lenburg
, NC
Monte
rey C
ounty,
CA
Solano Coun
ty, C
AM
ean
Media
n
Cost Per Unit HourUnited States

1/8/2015
12
Unit Hour Costs
• Unit Hour Costs are Powerfully Affected by Economies of Scale
• Far Less Money is Wasted in the Production of Unit Hours than is Wasted from Squandered Unit Hours
Unit Hour Costs
• Unit Hour Cost is:• A Poor Predictor of Cost per Transport
• A Poor Predictor of Clinical Quality
Productivity• Total System Cost per Capita• Cost per Unit Hour• Unit Hour Utilization Ratio• Cost per Transport

1/8/2015
13
Unit Hour Utilization
Basic Terminology
Utilization -How frequently the unit hour is used
Productivity
• Unit Hour Utilization• Responses• Transports• Patients Treated (Treat and Release)
• Work Load • Post to Post Moves• Equalization
Unit Hour Utilization Ratio
Basic TerminologyUnit Hour Utilization - A measurement of the productivity of the system calculated by dividing the number of transportsby the number of unit hours produced for a given period.

1/8/2015
14
Unit Hour Utilization Ratio
The U/UH Ratio
U (Utilization)UH (Unit Hours)
Patients Transported During PeriodUnit Hours Produced During Same
Period
Unit Hour Utilization Ratio
4 Transports12 Unit Hours
600 Transports1800 Unit
Hours
= .33 U/UH
= .33 U/UH
Unit Hour Utilization Ratio

1/8/2015
15
Productivity
• Total System Cost per Capita• Cost per Unit Hour• Unit Hour Utilization Ratio• Cost per Transport
Cost per Transport
Cost per Unit HourProductivity (U/UH) = Cost per
Transport
Cost per TransportExample:
8,000 Patients16,000 Unit Hours
$100.50
$100.51
= .50
= $200 per Transport
= $196 per Transport
1/8/2015
16
Cost per Transport
$ 4 X 8,000 Patients/Year = $32,000/Year
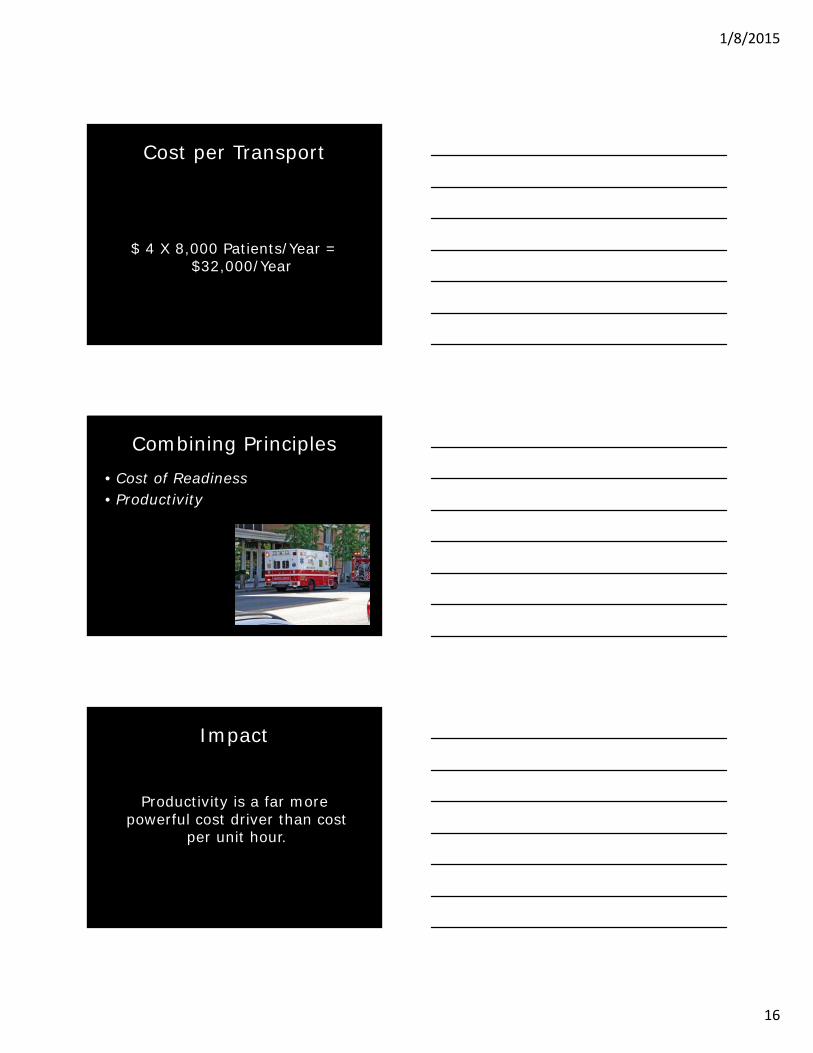
Combining Principles• Cost of Readiness• Productivity
Impact
Productivity is a far more powerful cost driver than cost
per unit hour.
1/8/2015
17
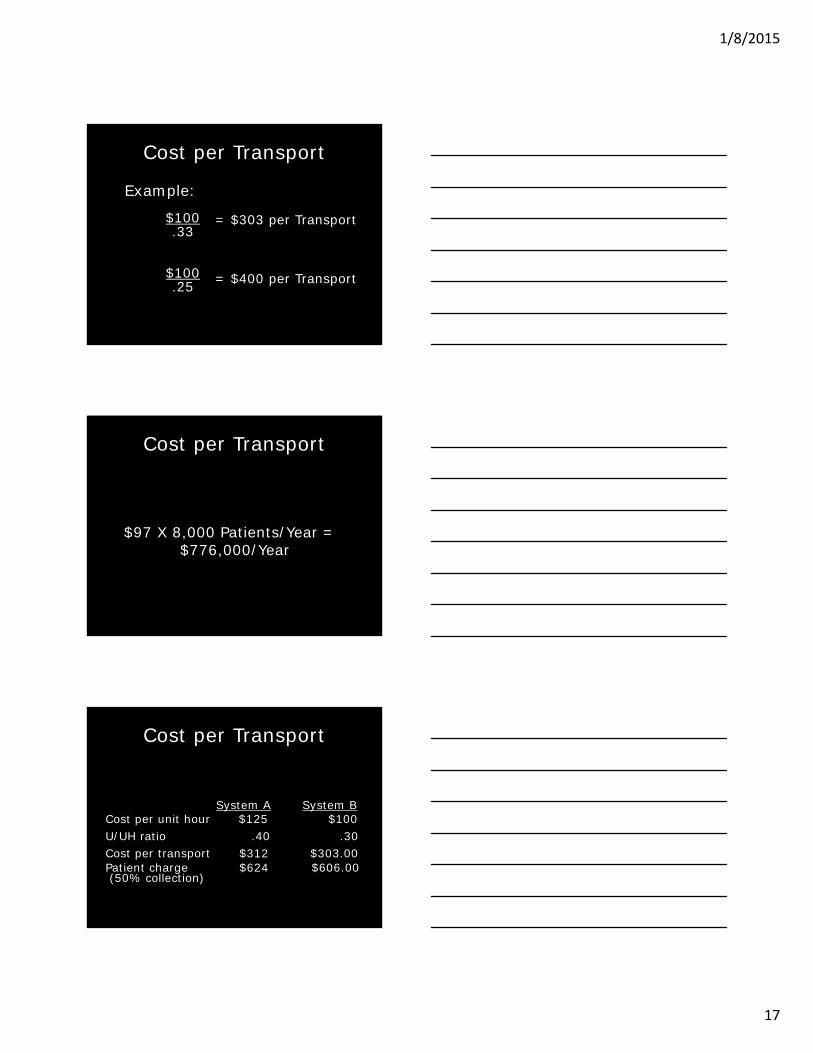
Cost per Transport
Example:
$100.33
$100.25
= $303 per Transport
= $400 per Transport
Cost per Transport
$97 X 8,000 Patients/Year = $776,000/Year
Cost per Transport
System A System BCost per unit hour $125 $100U/UH ratio .40 .30Cost per transport $312 $303.00Patient charge $624 $606.00(50% collection)

1/8/2015
18
Cost per Transport
ExclusiveNon-Exclusive
(Subsidy Constant)
Non-Exclusive (Total Bill Constant)
Unit Hour Cost $99.75 $99.75 $99.75Unit Hour Utilization 0.47 0.42 0.42Transport Frequency (hour) 2.13 2.37 2.37Cost Per Patient Transport $212.23 $237.50 $237.50Less: Subsidy Per Transport $58.14 $58.14 $83.41Sub-Total $154.09 $179.36 $154.09Collection Percentage 40% 40% 40%Total Bill $385.24 $448.40 $385.23
$0.00
$100.00
$200.00
$300.00
$400.00
$500.00
$600.00
$700.00
$800.00
Fort W
ayne,
IN
Fort W
orth, T
X
Kansas C
ity, M
O
Oklahom
a City
, OK
Pinellas C
ounty, F
L
Reno, NV
Richmond
, VA
Tulsa,
OK
Clark Coun
ty, W
A
Davenpo
rt, IA
Little R
ock,
AR
Mecklen
burg, N
C
Montere
y Cou
nty, C
A
Solano Coun
ty, C
AMean
Median
Cost Per TransportUnited States
Factors Affecting Productivity
• Population Density• Road Systems and Barriers• Seasons• Location of Health Care Facilities• Hospital Diversions
1/8/2015
19
General Principles• Revenues
• Local Tax Support• Reimbursement
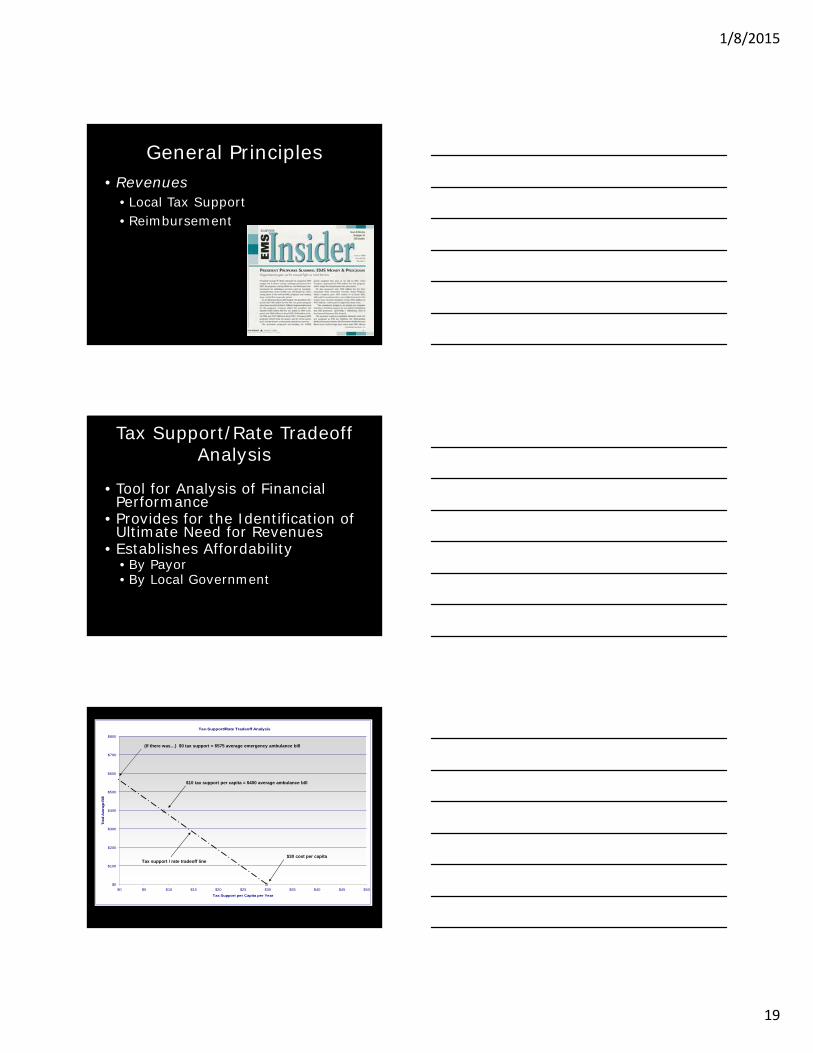
Tax Support/Rate Tradeoff Analysis
• Tool for Analysis of Financial Performance
• Provides for the Identification of Ultimate Need for Revenues
• Establishes Affordability• By Payor• By Local Government
Tax-Support/Rate Tradeoff Analysis
$0
$100
$200
$300
$400
$500
$600
$700
$800
$0 $5 $10 $15 $20 $25 $30 $35 $40 $45 $50
Tax Support per Capita per Year
Tota
l Ave
rage
Bill
$30 cost per capita
$10 tax support per capita = $400 average ambulance bill
(If there was…) $0 tax support = $575 average emergency ambulance bill
Tax support / rate tradeoff line

1/8/2015
20
Reimbursement
• Collection Percentage Variables• Payor Mix
• Medicare• Medicaid
• Billing System• Management of A/R
BillingsTypical Payor Mix
39%
20%
26%
15%
Medicare Medicaid
Private Pay Commercial Insurance/HMO

1/8/2015
21
Reimbursement
• Medicare• Medicaid• Private Paying Patients • Commercial Insurance
• HMO Contracts • Other Contracts
Medicare
• Federal Authorization• Federal Regulation• Federal Funding• Carrier Administered• Approximately 40% - 45% of patients
The Medicare Fee Schedule
• Components of the Base Rate• National Relative Values
• BLS = 1.00• BLS-E = 1.60• ALS1 = 1.20• ALS1-E = 1.90• ALS2 = 2.75

1/8/2015
22
The Medicare Fee Schedule
Ambulance Inflation Factor
• 2003 1.1 • 2004 2.1 • 2005 3.3 • 2006 2.5 • 2007 4.3• 2008 2.7
• 2009 5.0 • 2010 0.0• 2011 -0.1• 2012 2.4• 2013 0.8• 2014 1.0• 2015 1.4
The Medicare Fee Schedule
Ambulance Conversion Factor•2008 $194 •2010 $210 •2011 $208•2012 $213•2015 $229
The Medicare Fee Schedule
National Conversion Factor x RVU• BLS= $229• BLS-E= $366• ALS-1= $275• ALS-1E=$435• ALS-2= $629

1/8/2015
23
The Impact - 2015Reimbursement vs. Cost
Reimbursement Level:
• BLS-E= $366
• ALS-1E=$435
Cost per Transport: (Assumes $125 per UH)
•.33 U/UH=$378
•.25 U/UH=$500
The Outlook
• Growing Federal Budget Deficit
• Legislative Proposals Complex• Not “High Visibility”• Post Election Year
Medicaid
• Federal Authorization• Indigent/Special Cases• Federal/State Cost Sharing
• Rates Determined by the State• Assignment
• 20% – 30% of Patients

1/8/2015
24
Medicaid
• “Transportation” Emphasis• Traditionally Low Reimbursement Rates
• Low Priority - Lack of Constituency
• State Budget Issues• Deficits Faced by 36 States
• Post Election Year – Federal AND State
Private Paying Patient
Insurance

1/8/2015
25
Special Topics
Non Emergency Transports
• Increase in Economic Efficiency• Increase in Gross Revenues• Clinical Oversight Needed
Non Emergency Transports
• Revenues• Impact on Net Revenues Must be Assessed• Medical Necessity• Payors

1/8/2015
26
Rural Costs Structures• Fewer Transports to Spread Fixed
Costs• Greater Geographic Coverage• “Centralized” Transports
Capital Purchases
Useful Lifevs.
One Time Expense
Cost and Useful Life
Vehicle Cost = $100,000Useful Life = 5 YearsAnnual Depreciation = $ 20,000

1/8/2015
27
Cost and Useful Life
Defining Useful Life• Predetermined Replacement Schedule
• Local Factors• Safe Driving
Safe Driving
EHS Collision Claim HistoryCost per claim per 100,000 Kms
$1,725
$1,049
$751
$416
$229$0.00
$200.00
$400.00
$600.00
$800.00
$1,000.00
$1,200.00
$1,400.00
$1,600.00
$1,800.00
2000/2001 2001/2002 2002/2003 2003/2004 2004/2005

1/8/2015
28
Cost and Useful Life
$100,0005 years
$100,0007 years
= $20,000 per Year
= $14,285 per Year$5715 per Year
Raising Rates and The Impact
• Payor Mix Must be Understood• Collection percentage for each
payor required• Important: $100 increase
does not equal $100 additional revenue

1/8/2015
29
The Issue of Assignment
Medicare – 40% to 50%Medicaid – 20% to 25%Total - 60% to 75%
Typical Payor Mix with Corresponding Increased Revenue
Projected $100 Increase
Medicare - 40% x $100 x 0 = $0.00 Medicaid - 20% x $100 x 0 = $0.00Com Ins - 20% x $100 x .75 = $15.00Private Pay - 20% x $100 x .10 = $2.00
Total 100% = $17.00
Typical Payor Mix with Corresponding Increased Revenue
Projected $100 Increase
$17.00 x 40,000 patients = $680,000
“The medical equipment now surpasses the vehicle in nearly all ambulance purchases.”
Dr. Jeff Goodloe

1/8/2015
30
BUT . . .
Ongoing Expenses Continue!!!
Annual Salary Increases
Health, Vehicle Insurance
Fuel
Vehicle and Equipment Replacement
And . . .
The Risk . . .POLITICAL
FALLOUT

1/8/2015
31
The Potential of Enhanced Governmental Support
• Additional Tax Subsidization• Federal - Health Care Reform• State - Budget Crisis• Local - Tax Limitations
Service Alternatives
• Increasing Emergency Response Times
• Deferral of Capital Purchases
• System Design Changes
The Impact of the Economy
“The Long View:How the financial downturn will change health care” January 2009

1/8/2015
32
“After the CrisisDifferential Strategies”
• Focus on Care Integration• Focus on Quality and IT• New Importance for Lowering Costs
of Service• Focus on Economies of Scale
Economic Efficiency
The ability to produce more service of higher quality from
available dollars.
EMS is Protocol Driven
Resource Reallocation
Dispatch
Treatment and
Transport

1/8/2015
33
Load of Work Variance• Time of Day• Day of Week
Prospective Evidence of A Circadian Rhythm for Out-of-Hospital
Cardiac ArrestsLevine et al. JAMA 1992; 267:2935-2937
Prospective Evidence of A Circadian Rhythm for Out-of-Hospital
Cardiac ArrestsLevine et al. JAMA 1992; 267:2935-2937
0
10
20
30
40
50
60
70
80
Ca
rdia
c A
rre
st
Vic
tim
s,
No
.
1 2 3 4 5 6 7 8 9 10 11 12 13 14 15 16 17 18 19 20 21 22 23 24
Hour of the Day
System Status Management
The art and science of matching the production capacity of an EMS system to the changing patterns of demand placed on that system.

1/8/2015
34
Improved Efficiencies
Example:
$100.25
$100.27
= $400 per Transport
=$370 per Transport
Improved Efficiencies
$30 X 40,000 Patients/Year = $1,200,000/Year
Levels of Efficiency• High quality with above-average
cost;• Low quality with below-average
cost;• Low quality with above-average
cost; and,• Performance Based EMS--
above-average service at below-average cost.

1/8/2015
35
The Future. . .
THE OPPORTUNITY -Integration INTO the Health Care Community
THE OPPORTUNITY -Integration INTO the Health Care Community
The IOM –EMS is Health Care
• Continuum of Care
• Health Care Professionals
• Provision of Clinical Care
• Integrating with the Community
1/8/2015
36
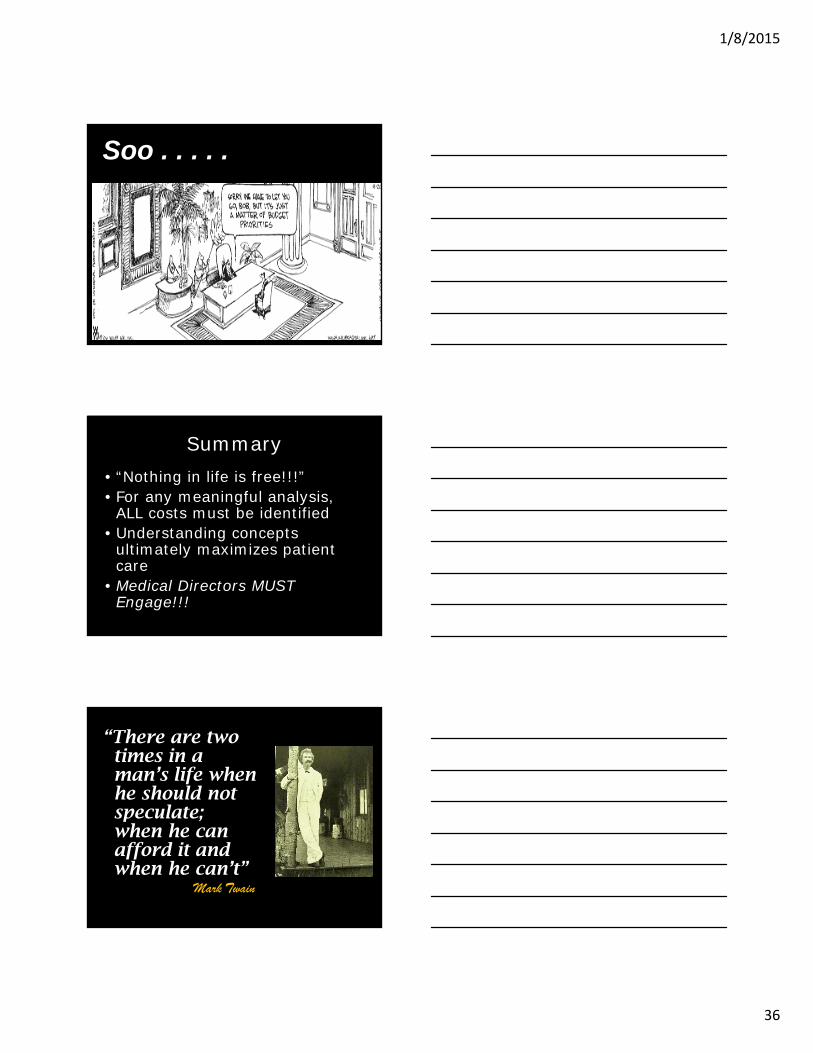
Soo . . . . .
Summary• “Nothing in life is free!!!”• For any meaningful analysis,
ALL costs must be identified• Understanding concepts
ultimately maximizes patient care
• Medical Directors MUST Engage!!!
“There are two times in a man’s life when he should not speculate; when he can afford it and when he can’t”
Mark Twain


![Fundamentals of Finance [Bostaph]](https://img.dokumen.tips/doc/110x75/5447e60bb1af9f65618b46c4/fundamentals-of-finance-bostaph.jpg)