Embed Size (px)
Citation preview

09/15/05 William Wu / MS meeting 1
Measurement error and measurement model
with an example in dietary data

09/15/05 William Wu / MS meeting 2
Why the established association was not found in my study, or
why the findings on the association from similar studies were inconsistent?
When we say established association, it means it was well studied, generally acknowledged, and widely cited.
Examples:
Physical activity and the occurrence of CVDs.
NSAID intake and colon cancer
Dietary fiber
09/15/05 William Wu / MS meeting 3
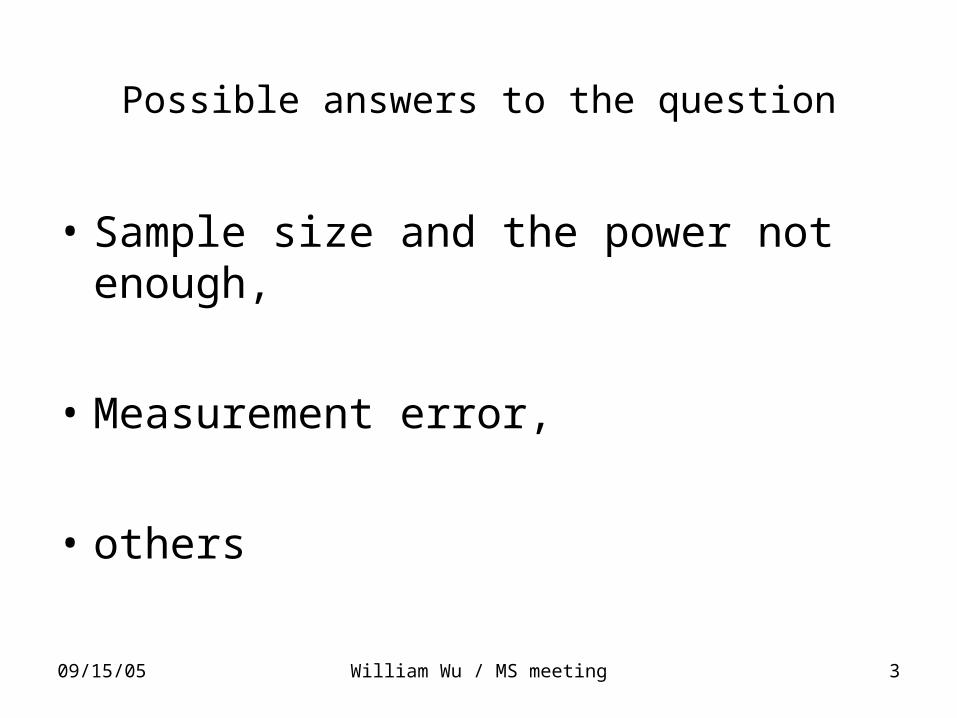
Possible answers to the question
• Sample size and the power not enough,
• Measurement error,
• others

09/15/05 William Wu / MS meeting 4
Measurement Error
• The error that arises when a recorded value is not exactly the same as the true value due to a flaw in the measurement process.

09/15/05 William Wu / MS meeting 5
Two distinguished variation
• Biological or natural variation (not measurement error),
• Variation in measurement process (systematic error and random error)

09/15/05 William Wu / MS meeting 6
Potential causes of measurement error
• Misuse of tools,• Poor choice of measurement tool• Lack of training• Carelessness• Not possible to measure exactly
09/15/05 William Wu / MS meeting 7
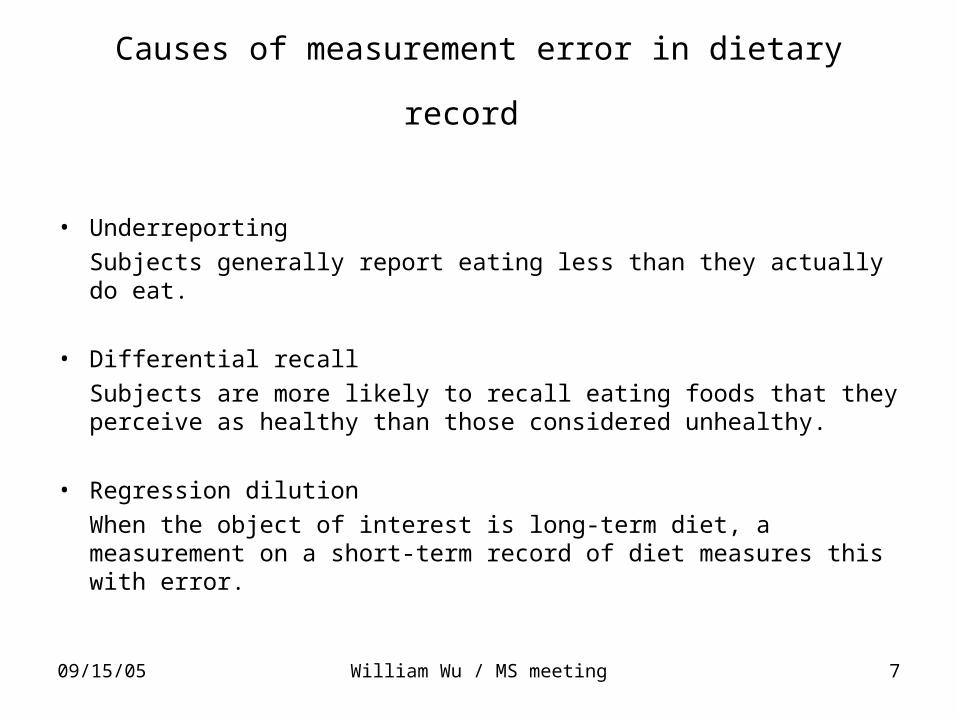
Causes of measurement error in dietary record
• Underreporting
Subjects generally report eating less than they actually do eat.
• Differential recall
Subjects are more likely to recall eating foods that they perceive as healthy than those considered unhealthy.
• Regression dilution
When the object of interest is long-term diet, a measurement on a short-term record of diet measures this with error.

09/15/05 William Wu / MS meeting 8
Two other often seen terms
• Selection biassubjects recruited not representative of the target population
e.g.
• Information biasArising from errors in measuring exposure or disease
e.g. exaggerate risk estimate for case subjects.

09/15/05 William Wu / MS meeting 9
Consequences of measurement error
• Effect size attenuatedmeasurement error dilutes the effects
(referred to as ‘regression dilution bias’)
• Significance biasedmeasurement error favors the null
hypothesis

09/15/05 William Wu / MS meeting 10
Approaches to reducing measurement error
• Study design stage
Conduct pilot study
improve Instrument
re-design the questionnaire
validate the equipment
standardize measurement protocols
reproducibility
reliability
train study personnel,
Analytical stage
statistical approaches
average the repeated measurements
measurement model
others

09/15/05 William Wu / MS meeting 11
Measurement model with two indicators
Our general question:
Y= a + bX* + e
where X* is the true score.
In reality the X* is not available, instead, we have two rough measurements of X*, say, X1 and X2.

09/15/05 William Wu / MS meeting 12
Solutions to the regression
There are three ways to address this question:
Y = a + bX1 + e Y = a + bX2 + e
Y = a + b[(X1+X2)/2] + e
Y = a + b1X1 + b2X2 + e
09/15/05 William Wu / MS meeting 13
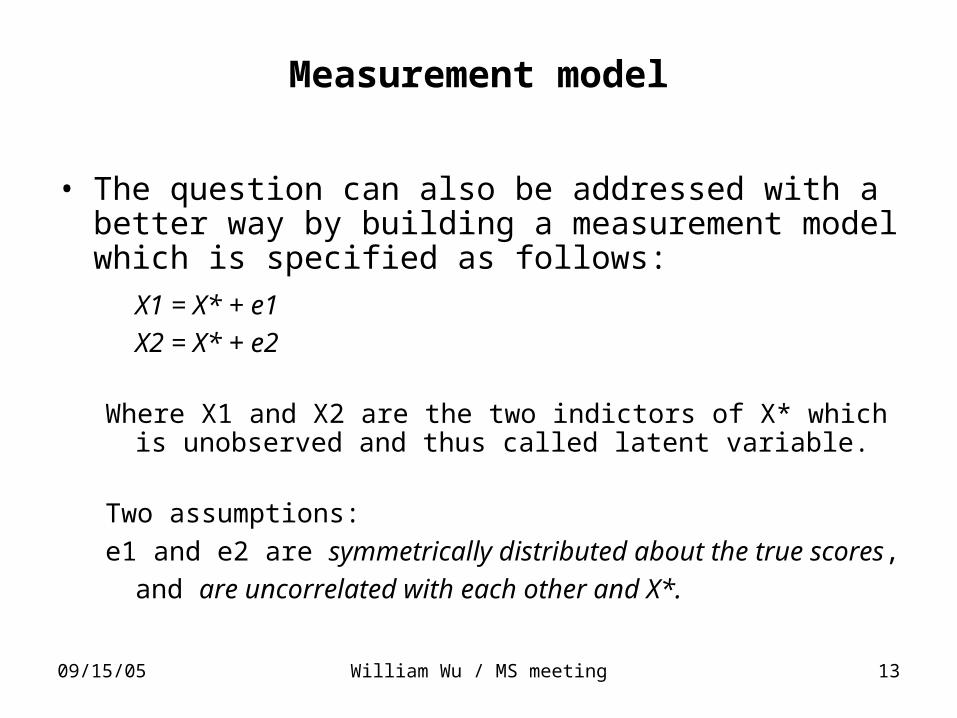
Measurement model
• The question can also be addressed with a better way by building a measurement model which is specified as follows:
X1 = X* + e1
X2 = X* + e2
Where X1 and X2 are the two indictors of X* which is unobserved and thus called latent variable.
Two assumptions:
e1 and e2 are symmetrically distributed about the true scores, and
are uncorrelated with each other and X*.

09/15/05 William Wu / MS meeting 14
• Parallelism of the two indicators is specified when repeated measurements with the same method is involved. It is the most restrictive constrain to a measurement model.
Parallel of two indicators
09/15/05 William Wu / MS meeting 15
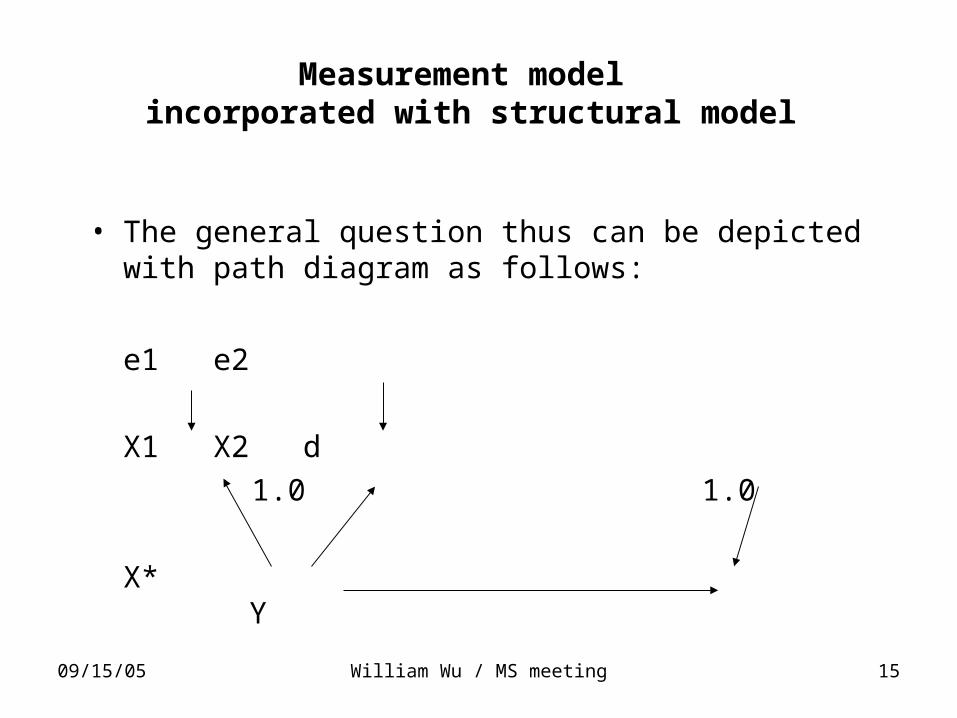
Measurement model incorporated with structural model
• The general question thus can be depicted with path diagram as follows:
e1 e2
X1 X2 d
1.0 1.0
X* Y

09/15/05 William Wu / MS meeting 16
Packages for the implementation of the equation
• SAS
proc calis
• AMOS
structural equation model

09/15/05 William Wu / MS meeting 17
Study Setting
• Project: The Los Angeles Atherosclerosis Study
• Study design:Cohort study
• Study question:Association between dietary fiber intake and atherosclerosis progression.
• Study population:700 middle-aged man and women in a company.
• Outcome:Atherosclerosis progression =
yearly enlargement rate of common carotid intima-media thickness (IMT), which was derived from a baseline measurement, and two follow-up measurements with 1.5 years apart.

09/15/05 William Wu / MS meeting 18
Measurement of dietary intake
• Dietary data interested:Daily intake of viscous dietary fiber (also classified as water-soluble fiber) and its major component, pectin.
• Data collection instrument:three days 24-hours recall
• Measurements:Two measurements, one in baseline and one in 1.5 years follow-up.

09/15/05 William Wu / MS meeting 19
In this study, we try to
• estimates the slope of the dependent variable (IMT progression) regressed on the long-term average intake of viscous dietary fiber or pectin which was unobserved,
• assume that the errors of measurement at each examination were random.

09/15/05 William Wu / MS meeting 20
Building Measurement model
long-term fiber
fiber1
0
e1
fiber2
0
e211
1 1

09/15/05 William Wu / MS meeting 21
Structural model
long-term fiber
fiber1
0
e1
fiber2
0
e211
1 1
IMT prgression
aIMT
0
e3
cIMT
0
e4
eIMT
0
e5
31
e5
1.5
v_e4v_e3
0
d1
1

09/15/05 William Wu / MS meeting 22
Model of the example
AN057_d
CN057_d
0,
e41
0,
e51
0,
Pectin_F3
0
IMTg_F2aimta_1000
cimta_1000
eimta_1000
0, v_e1
e1
1
0, v_e2
e2
0, v_e3
e3
0,
d1
0
Initial_F1
0,
d2
1
1
1
1
1
3
1
1.5
age sex aC_SMOKE
01
1
1

09/15/05 William Wu / MS meeting 23
RESULT: Influence of measurement error on the estimates of regression slope relating IMT progression to dietary fiber. The LAAS (1995-1999)
Model Regression slope* P value
Viscous fiber
Baseline -1.330.60 0.03
follow-up -0.900.62 0.15
Average of baseline and follow-up -1.570.62 0.03
Measurement error corrected -2.521.11 0.02
Pectin
Baseline -2.731.26 0.03
follow-up -1.951.31 0.12
Average of baseline and follow-up -2.221.05 0.04
Measurement error corrected -5.872.34 0.01
* Regression slope is the regression coefficient in the structural model.

09/15/05 William Wu / MS meeting 24
Questions and Discussion