Embed Size (px)
Citation preview
www.dbsvickers.com
ed-TH / sa- DL
1H15 results preview: positive surprise unlikely Telecom operators: positive surprise in 1H15 unlikely
due to VAT reform
Tower sales the key focus during management update
Telecom infrastructure providers benefitting from 4G capex, but mixed results expected due to company-specific challenges
We like China Mobile and ZTE Telecom operators: positive surprise unlikely. Telecom operators continued to suffer from the negative impact of VAT reform in 1H15 (policy implemented on 1 June 2014). This should be partially offset by the initiative of cutting marketing expenses which is positive to profitability. But this could result in lower ARPU after lowering handset subsidies. We expect 2Q15’s y-o-y momentum to be similar to that of 1Q15 with a slight pick-up.
Watching out for updates on tower sales. The market will also focus on tower asset sales in the coming analyst briefing. Investors have been expecting tower asset injection from telecom operators into the state-owned Towerco in 3Q15. China Unicom (762 HK) was expected to record a large one-off gain relative to its market capitalisation. The consideration is likely to be paid partially by equity (a stake in the Towerco).
CM’s 3G/4G sub growth outperformed in 1H15. We like China Mobile (CM, 941 HK) for its continuous market share gain following the launch of its TD-LTE service. CM has a leading 76% market share in terms of 3G/4G net adds in 1H15. The company has a first-mover advantage with a large market share in the 2G segment where users can directly upgrade to 4G (without changing their mobile numbers, in the absence of mobile number portability). The continuous market share gain will benefit earnings gradually in the next few years.
Telecom infrastructure providers: mixed results. Telecom operators’ investments into 4G network generally benefitted infrastructure providers in 1H15. ZTE issued its preliminary results with a 43% earnings growth y-o-y. We prefer ZTE in this segment due to its leading market position. Other players faced company-specific challenges. For example, Trigiant (1300 HK) suffered from copper price decline; which negatively affected ASP and revenue.
HSI: 24,552
ANALYST Tsz Wang TAM CFA +852 2971 1772 [email protected]
Recommendation & valuation
Upside/ F Y 16F(dow nside) PE
HK $ HK $ % x US$m
T elec om operat o rsChina Mobile(941 HK)
100.9 129.0 28 Buy 14.1 266.4
China Telecom(728 HK)
4.27 5.0 17 Buy 13.0 44.6
China Unicom(762 HK)
10.68 10.6 (1) Hold 15.1 33.0
T elec om equ ipment s and in f rast ruc t u re serv ic e p rov idersZTE 'H'(763 HK)
16.64 24.0 44 Buy 14.1 10.5
ZTE 'A'(000063 CH)
20.65 24.0 16 Hold 21.8 16.5
Comba(2342 HK)
1.84 1.9 3 Hold 9.5 0.4
CCS(552 HK)
3.27 4.5 38 Buy 7.2 2.9
Trigiant(1300 HK)
1.87 2.9 55 Buy 5.2 0.4
M k tCapCompany Pric e
T argetPric e Rec om
Source: Thomson Reuters, DBS Vickers
DBS Group Research . Equity 10 August 2015
China / Hong Kong Industry Focus
China Telecom Sector Refer to important disclosures at the end of this report

Industry Focus
China Telecom Sector
Page 2
Telecom operators: positive surprise unlikely
Chinese telecom operators will announce their respectively interim results in the week of 17 Aug 2015. Overall, we still anticipate a sluggish performance in 1H15, with 2Q15 y-o-y performance better than that of 1Q15.
China Mobile (CM, 941 HK), China Telecom (CT, 728 HK) and China Unicom (CU, 762 HK) continued to suffer from the negative impact of VAT reform in 1H15 (policy implemented on 1 June 2014). On the other hand, operators were “encouraged” to cut marketing expenses by 20% per year in 2-3 years (starting from 2H14). This is positive to profitability and will partially offset the negative impact from VAT reform. But the initiative could result in lower ARPU, after lowering handset subsidies.
Note that CM and CT reported earnings declines of 5% and 10% y-o-y respectively in 1Q15, while CU registered a 1% growth. There should be more cost items that qualify for tax credits. We expect 2Q15 y-o-y momentum to have a slight pick-up compared with that of 1Q15.
EBITDA growth in 1Q15
0
1
2
3
4
5
6
7
China Mobile China Telecom China Unicom
%
Source: Companies
Earnings growth in 1Q15
(10)
(8)
(6)
(4)
(2)
0
2
China Mobile China Telecom China Unicom
%
Source: Companies
Watching out for tower asset sales updates
The market has been expecting tower asset injections from telecom operators into the state-owned Towerco in 3Q15. We expect operators to provide more details during their analyst briefings. Below are the key things to watch out for:
- The tower asset. Towerco management previously estimated that the asset size should be c.Rmb300bn.The number of towers at CM, CT and CU is estimated to be c.1m. But recent market rumours seem to suggest that the asset will also include roof top towers and poles.
- The valuation. The market previously expected the consideration to be based on the towers’ replacement costs. In our view, the pricing should also be linked to the future leasing fees. Our case study earlier suggests that the one-off gain as a % of market cap should be the highest for CU at c.36%, followed by CM’s 10% and CT’s 11%. Therefore, investors are more excited about the potential one-off benefit to CU.
- The consideration. The Towerco plans to acquire most tower assets at one go, which would allow it to evaluate the entire tower portfolio and avoid selective disposal by operators. In view of the initial funding requirements, the market now believes that the consideration will be paid primarily by equity, i.e. a stake (or shares) in the Towerco. But CM’s, CT’s and CU’s relative stakes of 40.0%, 29.9% and 30.1% have to be maintained. Our earlier case study suggests that CM, CT and

Industry Focus
China Telecom Sector
Page 3
CU will be paid c.75%, 0% and c.60% by cash (and c.25%, 100% and c.40% by equity).
CM’s 3G/4G sub growth outperformed in 1H15
Aggregated mobile sub growth in China was slow in 1H15, with only 6.6m net adds (compared with 32m in 1H14). The market is more saturated and operators are focusing more on customer quality and customer upgrade. CM and CT gained 10.6m and 5.8m mobile subs respectively, while CU recorded a 9.8m sub loss. We believe that CU had cut more aggressively in marketing expenses (which partly explains the good profitability in 1Q15 amid revenue decline). The shrinking sub base actually poses risks the long-term growth potential if the trend continues.
Aggregated 3G/4G sub net adds was 90m in 1H15 (vs. 83m in 1H14). CM, CT, and CU had 76%, 14% and 10% market share respectively in terms of 3G/4G net adds. Our channel check suggests that the pricing (on per unit data usage) is quite similar among operators, at Rmb58 per month for 500Mb data usage for CM, Rmb59 per month for 500Mb for CT, and Rmb58 for 400Mb for CU. Network quality for CM and CT are perceived to be better than CU. But CM has a first-mover advantage with a large market share in the 2G segment where users can directly upgrade to 4G (without changing their mobile numbers, in the absence of mobile number portability).
Market share in terms of 3G/4G net adds in 1H15
China Mobile76%
China Telecom
14%
China Unicom10%
Source: Companies
Premier Li’s call for tariff cuts
Background: Premier Li Keqiang earlier called for mobile and fixed-line broadband tariff cuts as well as speed upgrades. The regulator later set a completion deadline at Oct 2015.
CT expects mobile data unit (per Mb) and broadband unit pricing (per Mbps) to be reduced by one-third, in response to the demand for tariff cuts. We expect operators to continue to upsell data usage and bandwidth (from 3G to 4G for mobile broadband) in order to maintain overall ARPU.
We believe that telecom operators have been under pricing pressure due to market competition. Unit pricing has been declining due to technology advancement as well. Strategy execution is key to maintaining overall ARPU and profitability. We expect mid single digit rate of decline in FY15.
Telecom infrastructure providers: mixed performance
Telecom operators’ investments into 4G network should continue to benefit infrastructure providers in 1H15. ZTE issued its preliminary results with a 43% earnings growth y-o-y. Comba also issued a positive profit alert, anticipating 40%+ net profit growth in 1H15. The satisfactory performance was attributable to (i) strong 4G investment, and (ii) margin recovery.
On the other hand, some players faced company-specific challenges. For example, Trigiant (1300 HK) suffered from copper price decline (average price in 1H15 declining by 12% y-o-y, compared with 1H14), which negatively affected ASP and revenue. CCS faced pricing pressure as well as uncertain demand from the newly set up Towerco.
We like China Mobile and ZTE
We like CM for its continuous market share gain after the launch of its TD-LTE service. We rate the company a BUY with a new TP of HK$129, based on 18x FY16 PE. The target multiple represents an upcycle PE and is around 2SD above its historical average. This is also justified by CM’s regaining its dominant position in China’s mobile market. We believe that CT and CU deserve to trade at a discount to CM, due to more challenging outlook. We accordingly set the target PE for CT and CU at 15x. We rate CT a BUY with a TP of HK$5.0, or 15x
Industry Focus
China Telecom Sector
Page 4
FY16 PE, and rate CU a HOLD with a TP of HK$10.7, or 15x FY16 PE. We use PE multiples to value telecom operators (instead of discounted cash flow method), in view of smaller earnings volatility from high capex (and therefore high depreciation) as in the past few years.
As for telecom infrastructure players, we prefer larger players with a global presence such as ZTE, in the near term. We
currently have a BUY rating on the counter with a TP of HK$24.0, or 20x FY16 PE. We maintain our BUY ratings for CCS and Trigiant due to positive medium term outlook at undemanding valuation, despite that we are cautious on their near-term performance. We rate HOLD on Comba as we believe that the potential recovery has been priced in.
Peers valuation
Target Mkt PE PE Yield Y ield P/Bk P/Bk EV /EBITDA ROE ROE
Price Price Recom Cap F iscal 15F 16F 15F 16F 15F 16F 15F 16F 15F 16FCompany Name Code HK$ HK$ US$m Yr x x % % x x x x % %
Telecom operators
China Mobile 941 HK 100.9 129.00 Buy 266.4 Dec 14.8 14.1 2.9 3.1 1.8 1.7 4.8 4.5 12.5 12.3
China Telecom 'H' 728 HK 4.27 5.00 Buy 44.6 Dec 14.6 13.0 2.2 2.2 0.9 0.9 3.9 3.9 6.4 6.9
China Unicom 762 HK 10.68 10.60 Hold 33.0 Dec 16.4 15.1 2.3 2.3 0.9 0.8 3.4 3.1 5.4 5.7
Telecom equipment and inf rast ructure serv ice prov iders
ZTE 'H' 763 HK 16.64 24.00 Buy 10.5 Dec 16.0 14.1 1.6 1.8 2.0 1.8 9.4 8.5 13.1 13.4ZTE 'A'@ 000063 CH 20.65 24.00 Hold 16.5 Dec 24.8 21.8 1.0 1.1 3.1 2.8 14.4 12.9 13.1 13.4
Comba Telecom 2342 HK 1.84 1.90 Hold 0.4 Dec 11.0 9.5 2.3 2.6 0.9 0.8 5.8 5.3 8.2 9.0
China Comservice 'H' 552 HK 3.27 4.50 Buy 2.9 Dec 8.1 7.2 3.7 4.1 0.7 0.7 3.1 3.0 9.4 9.8Trigiant 1300 HK 1.87 2.90 Buy 0.4 Dec 5.6 5.2 6.3 6.3 0.9 0.8 4.3 3.9 18.1 16.0Yangtze Optic F ibre* 6869 HK 8.96 n.a. NR 0.7 Dec 8.7 7.5 3.1 3.6 1.7 1.4 n.a. n.a. 21.7 n.a.
@ RMB for price & target price
* Consensus
Source: Thomson Reuters, DBS Vickers

Page 5 www.dbsvickers.com ed-TH / sa- DL
BUY
Last Traded Price: HK$100.90 (HSI : 24,552) Price Target: HK$ 129.00 (28% upside) (Prev HK$120) Potential Catalyst: Strong 4G sub growth and ARPU uplift Where We Differ: We are optimistic on CM’s continuous market gain in the next few years Analyst Tsz Wang TAM CFA, +852 2971 1772 [email protected] Price Relative
77
97
117
137
157
177
197
217
58.1
68.1
78.1
88.1
98.1
108.1
118.1
Aug-11 Aug-12 Aug-13 Aug-14 Aug-15
Relative IndexHK$
China Mobile (LHS) Relative HSI INDEX (RHS)
Forecasts and Valuation FY Dec (RMB m) 2013A 2014A 2015F 2016FTurnover 630,177 641,448 664,070 686,588 EBITDA 248,820 243,442 257,673 271,054 Pre-tax Profit 158,579 142,592 145,715 153,477 Net Profit 121,692 109,279 111,360 117,293 Net Pft (Pre Ex) 121,692 109,279 111,360 117,293 EPS (RMB) 6.05 5.38 5.45 5.74 EPS (HK$) 7.56 6.72 6.80 7.16 EPS Gth (%) (5.9) (11.1) 1.2 5.3 Diluted EPS (HK$) 7.47 6.68 6.79 7.15 DPS (HK$) 3.27 2.88 2.92 3.08 BV Per Share (HK$) 48.98 52.32 56.30 60.46 PE (X) 13.4 15.0 14.8 14.1 P/Cash Flow (X) 7.2 7.8 7.3 7.0 P/Free CF (X) 19.1 41.8 62.9 35.5 EV/EBITDA (X) 4.9 5.0 4.8 4.5 Net Div Yield (%) 3.2 2.9 2.9 3.1 P/Book Value (X) 2.1 1.9 1.8 1.7 Net Debt/Equity (X) CASH CASH CASH CASH ROAE (%) 16.1 13.3 12.5 12.3 Earnings Rev (%): 3 3 Consensus EPS (RMB) 5.40 5.69
Other Broker Recs: B: 18 S: 4 H: 8
ICB Industry: Telecommunications ICB Sector: Mobile Telecommunications Principal Business: The largest mobile operator in Mainland
China. Source of all data: Company, DBSV, Thomson Reuters, HKEX
Expect steady profitability recovery
Stable network quality and the absence of MNP supporting strong 4G sub growth
Expect 2Q15 profitability to improve, with less impact from tax reform
Earnings to resume growth in 2H15
Maintain BUY with a new TP of HK$129.0
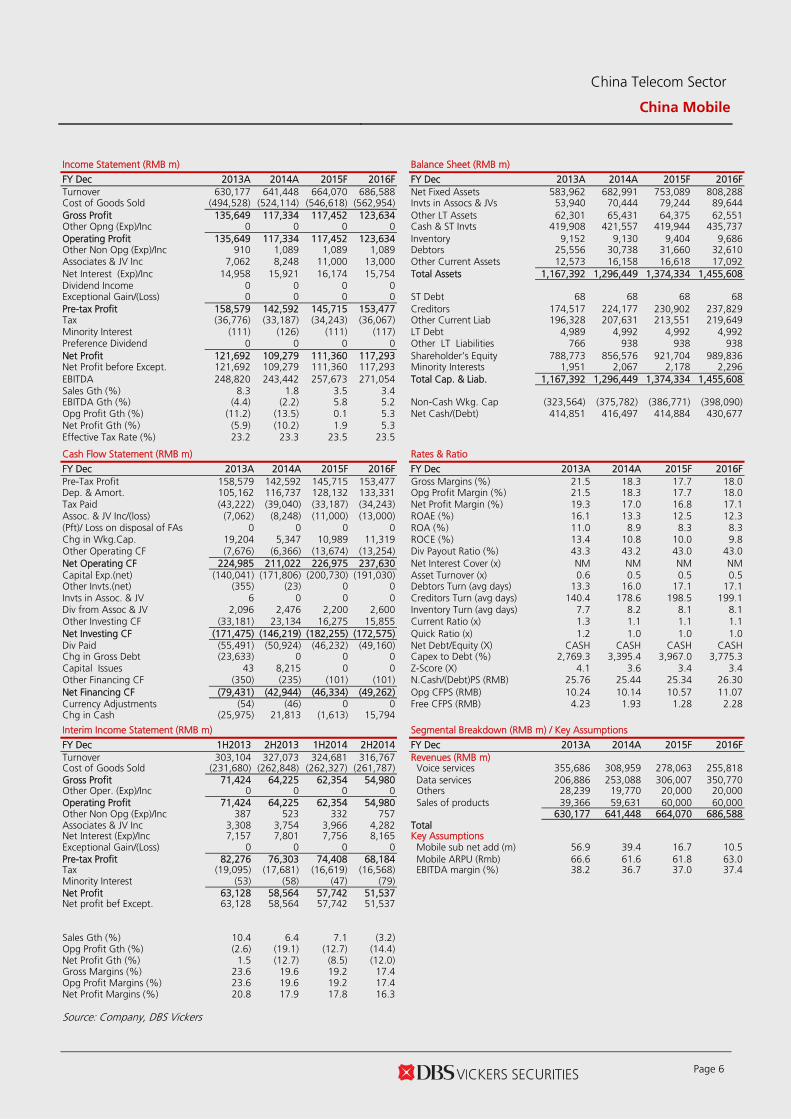
4G network quality well received by the market. Our channel check suggests that consumers like CM’s 3G/4G network quality. The pricing among operators are similar. We believe that CM has a first-mover advantage with a large market share in the 2G market where subs can directly upgrade to 4G without changing their mobile numbers, in the absence of mobile number portability. CM has added c.100m 4G subs y-t-d, bringing the total number to 190m. Full-year target of 250m looks achievable.
Expect 2Q15 profitability to improve. We anticipate a low single-digit earnings decline y-o-y for 1H15, with slight improvement in 2Q, vs. 1Q (in terms of y-o-y performance), due to less impact from tax reform and continuous cost control. In 1Q15, mobile service revenue was stable, while ARPU declined to Rmb59, from 1Q14’s Rmb62, which should be partly attributable to the negative impact from tax reform. EBITDA increased by 3% y-o-y, thanks to the initiative in cutting marketing costs. Net profit decreased by 6% y-o-y, which showed stabilisation from the 12% y-o-y decline in 2H14.
Maintain BUY with a new TP of HK$129. We revised up our earnings slightly by 3% for both FY15 and FY16 on higher margin assumption. We expect earnings growth to resume in 2H15, after the negative impact from VAT. We like CM for its market share gain after entering the 4G era, and are positive on CM’s medium-term outlook. Maintain BUY, with a new TP set at HK$129, or 18x FY16 PE, an upcycle PE or around 2SD above its historical average.
At A Glance Issued Capital (m shrs) 20,475 Mkt. Cap (HK$m/US$m) 2,065,877 / 266,486
Major Shareholders China Mobile (HK) Group (%) 73.0
Free Float (%) 27.0 3m Avg. Daily Val. (US$m) 209.0
China Telecom Sector
China Mobile
Bloomberg: 941 HK EQUITY | Reuters: 0941.HK Refer to important disclosures at the end of this report
China Telecom Sector
China Mobile
Page 6
Income Statement (RMB m) Balance Sheet (RMB m)
FY Dec 2013A 2014A 2015F 2016F FY Dec 2013A 2014A 2015F 2016F Turnover 630,177 641,448 664,070 686,588 Net Fixed Assets 583,962 682,991 753,089 808,288 Cost of Goods Sold (494,528) (524,114) (546,618) (562,954) Invts in Assocs & JVs 53,940 70,444 79,244 89,644 Gross Profit 135,649 117,334 117,452 123,634 Other LT Assets 62,301 65,431 64,375 62,551 Other Opng (Exp)/Inc 0 0 0 0 Cash & ST Invts 419,908 421,557 419,944 435,737 Operating Profit 135,649 117,334 117,452 123,634 Inventory 9,152 9,130 9,404 9,686 Other Non Opg (Exp)/Inc 910 1,089 1,089 1,089 Debtors 25,556 30,738 31,660 32,610 Associates & JV Inc 7,062 8,248 11,000 13,000 Other Current Assets 12,573 16,158 16,618 17,092 Net Interest (Exp)/Inc 14,958 15,921 16,174 15,754 Total Assets 1,167,392 1,296,449 1,374,334 1,455,608 Dividend Income 0 0 0 0 Exceptional Gain/(Loss) 0 0 0 0 ST Debt 68 68 68 68 Pre-tax Profit 158,579 142,592 145,715 153,477 Creditors 174,517 224,177 230,902 237,829 Tax (36,776) (33,187) (34,243) (36,067) Other Current Liab 196,328 207,631 213,551 219,649 Minority Interest (111) (126) (111) (117) LT Debt 4,989 4,992 4,992 4,992 Preference Dividend 0 0 0 0 Other LT Liabilities 766 938 938 938 Net Profit 121,692 109,279 111,360 117,293 Shareholder’s Equity 788,773 856,576 921,704 989,836 Net Profit before Except. 121,692 109,279 111,360 117,293 Minority Interests 1,951 2,067 2,178 2,296 EBITDA 248,820 243,442 257,673 271,054 Total Cap. & Liab. 1,167,392 1,296,449 1,374,334 1,455,608 Sales Gth (%) 8.3 1.8 3.5 3.4 EBITDA Gth (%) (4.4) (2.2) 5.8 5.2 Non-Cash Wkg. Cap (323,564) (375,782) (386,771) (398,090) Opg Profit Gth (%) (11.2) (13.5) 0.1 5.3 Net Cash/(Debt) 414,851 416,497 414,884 430,677 Net Profit Gth (%) (5.9) (10.2) 1.9 5.3 Effective Tax Rate (%) 23.2 23.3 23.5 23.5 Cash Flow Statement (RMB m) Rates & Ratio
FY Dec 2013A 2014A 2015F 2016F FY Dec 2013A 2014A 2015F 2016F Pre-Tax Profit 158,579 142,592 145,715 153,477 Gross Margins (%) 21.5 18.3 17.7 18.0 Dep. & Amort. 105,162 116,737 128,132 133,331 Opg Profit Margin (%) 21.5 18.3 17.7 18.0 Tax Paid (43,222) (39,040) (33,187) (34,243) Net Profit Margin (%) 19.3 17.0 16.8 17.1 Assoc. & JV Inc/(loss) (7,062) (8,248) (11,000) (13,000) ROAE (%) 16.1 13.3 12.5 12.3 (Pft)/ Loss on disposal of FAs 0 0 0 0 ROA (%) 11.0 8.9 8.3 8.3 Chg in Wkg.Cap. 19,204 5,347 10,989 11,319 ROCE (%) 13.4 10.8 10.0 9.8 Other Operating CF (7,676) (6,366) (13,674) (13,254) Div Payout Ratio (%) 43.3 43.2 43.0 43.0 Net Operating CF 224,985 211,022 226,975 237,630 Net Interest Cover (x) NM NM NM NM Capital Exp.(net) (140,041) (171,806) (200,730) (191,030) Asset Turnover (x) 0.6 0.5 0.5 0.5 Other Invts.(net) (355) (23) 0 0 Debtors Turn (avg days) 13.3 16.0 17.1 17.1 Invts in Assoc. & JV 6 0 0 0 Creditors Turn (avg days) 140.4 178.6 198.5 199.1 Div from Assoc & JV 2,096 2,476 2,200 2,600 Inventory Turn (avg days) 7.7 8.2 8.1 8.1 Other Investing CF (33,181) 23,134 16,275 15,855 Current Ratio (x) 1.3 1.1 1.1 1.1 Net Investing CF (171,475) (146,219) (182,255) (172,575) Quick Ratio (x) 1.2 1.0 1.0 1.0 Div Paid (55,491) (50,924) (46,232) (49,160) Net Debt/Equity (X) CASH CASH CASH CASH Chg in Gross Debt (23,633) 0 0 0 Capex to Debt (%) 2,769.3 3,395.4 3,967.0 3,775.3 Capital Issues 43 8,215 0 0 Z-Score (X) 4.1 3.6 3.4 3.4 Other Financing CF (350) (235) (101) (101) N.Cash/(Debt)PS (RMB) 25.76 25.44 25.34 26.30 Net Financing CF (79,431) (42,944) (46,334) (49,262) Opg CFPS (RMB) 10.24 10.14 10.57 11.07 Currency Adjustments (54) (46) 0 0 Free CFPS (RMB) 4.23 1.93 1.28 2.28 Chg in Cash (25,975) 21,813 (1,613) 15,794
Interim Income Statement (RMB m) Segmental Breakdown (RMB m) / Key Assumptions
FY Dec 1H2013 2H2013 1H2014 2H2014 FY Dec 2013A 2014A 2015F 2016F Turnover 303,104 327,073 324,681 316,767 Revenues (RMB m) Cost of Goods Sold (231,680) (262,848) (262,327) (261,787) Voice services 355,686 308,959 278,063 255,818 Gross Profit 71,424 64,225 62,354 54,980 Data services 206,886 253,088 306,007 350,770 Other Oper. (Exp)/Inc 0 0 0 0 Others 28,239 19,770 20,000 20,000 Operating Profit 71,424 64,225 62,354 54,980 Sales of products 39,366 59,631 60,000 60,000 Other Non Opg (Exp)/Inc 387 523 332 757 630,177 641,448 664,070 686,588 Associates & JV Inc 3,308 3,754 3,966 4,282 Total Net Interest (Exp)/Inc 7,157 7,801 7,756 8,165 Key Assumptions Exceptional Gain/(Loss) 0 0 0 0 Mobile sub net add (m) 56.9 39.4 16.7 10.5 Pre-tax Profit 82,276 76,303 74,408 68,184 Mobile ARPU (Rmb) 66.6 61.6 61.8 63.0 Tax (19,095) (17,681) (16,619) (16,568) EBITDA margin (%) 38.2 36.7 37.0 37.4 Minority Interest (53) (58) (47) (79) Net Profit 63,128 58,564 57,742 51,537 Net profit bef Except. 63,128 58,564 57,742 51,537 Sales Gth (%) 10.4 6.4 7.1 (3.2) Opg Profit Gth (%) (2.6) (19.1) (12.7) (14.4) Net Profit Gth (%) 1.5 (12.7) (8.5) (12.0) Gross Margins (%) 23.6 19.6 19.2 17.4 Opg Profit Margins (%) 23.6 19.6 19.2 17.4 Net Profit Margins (%) 20.8 17.9 17.8 16.3 Source: Company, DBS Vickers

Page 7 www.dbsvickers.com ed-TH / sa- DL
BUY
Last Traded Price: HK$4.27 (HSI : 24,552) Price Target : HK$ 5.00 (17% upside) (Prev HK$5.60) Potential Catalyst: Strong mobile sub growth Where We Differ: We expect CT to deliver steady results with its strong execution capability Analyst Tsz Wang TAM CFA, +852 2971 1772 [email protected] Price Relative
58
78
98
118
138
158
178
198
218
2.8
3.3
3.8
4.3
4.8
5.3
5.8
6.3
Aug-11 Aug-12 Aug-13 Aug-14 Aug-15
Relative IndexHK$
China Telecom (LHS) Relative HSI INDEX (RHS)
Forecasts and Valuation FY Dec (RMB m) 2013A 2014A 2015F 2016FTurnover 321,584 324,394 324,800 332,393 EBITDA 97,324 94,893 96,607 100,179 Pre-tax Profit 23,091 23,202 25,267 28,403 Net Profit 17,548 17,625 19,011 21,370 Net Pft (Pre Ex) 17,548 17,625 19,011 21,370 EPS (RMB) 0.22 0.22 0.23 0.26 EPS (HK$) 0.27 0.27 0.29 0.33 EPS Gth (%) 17.4 0.4 7.9 12.4 Diluted EPS (HK$) 0.27 0.27 0.29 0.33 DPS (HK$) 0.09 0.09 0.09 0.09 BV Per Share (HK$) 4.28 4.46 4.66 4.90 PE (X) 15.8 15.7 14.6 13.0 P/Cash Flow (X) 3.1 2.9 2.8 2.8 P/Free CF (X) 16.0 17.4 nm nm EV/EBITDA (X) 3.8 3.8 3.9 3.9 Net Div Yield (%) 2.2 2.2 2.2 2.2 P/Book Value (X) 1.0 1.0 0.9 0.9 Net Debt/Equity (X) 0.3 0.3 0.3 0.3 ROAE (%) 6.5 6.2 6.4 6.9 Earnings Rev (%): (3) (1) Consensus EPS (RMB)
0.25 0.27
Other Broker Recs: B: 16 S: 4 H: 9
ICB Industry: Telecommunications ICB Sector: Fixed Line Telecommunications Principal Business: An integrated telecom service provider in
Mainland China, with fixed-line coverage in 20 southern
provinces. Source of all data: Company, DBSV, Thomson Reuters, HKEX
4G a key growth driver into 2H15
Expect 2Q15 profitability to improve, with less impact from tax reform
Management targets 60m 4G sub growth, which looks achievable in our view
Strong execution capability supports steady growth from 2H15 onwards
Maintain BUY with a new TP of HK$5.0
Expect 2Q15 profitability to improve. In 1Q15, service revenue was stable, due to the negative impact from tax reform. EBITDA and earnings fell accordingly by 2% and 9% respectively. We expect a mid single-digit earnings decline in 1H15, with improving profitability partly due to less impact from tax reform as well as continuous cuts in market cost.
4G sub growth target aggressive, but achievable. CT added 12m 3G/4G subs in 1H15 (vs. 5.6m in 1H14), thanks to the launch of its FD-LTE service, which supports growth this year. Overall mobile sub also increased by 5.8m (vs. a 5.3m drop in 1H14). CT aims to have 4G coverage in 120 cities as well as net adds of 60m (vs. 10m in 1Q15) in FY15, which looks achievable. Our channel check suggests that CT is now mainly offering 4G service in the market, which naturally results in more conversions from 3G to 4G. But ARPU uplift will hinge on CT’s ability of upselling more data usage.
Maintain BUY on strong execution capability. We adjusted down our earnings slightly by 3% and 1% on more conservative margin assumptions. We like CT for its strong strategy execution capability, and believe that it can continue to deliver steady performance. All in all, we forecast 8% and 12% net profit growth for the coming two years. Maintain BUY, with a new TP set at HK$5.0, or 15x FY16 PE.
At A Glance Issued Capital - H shares (m shs) 13,877 - Non H shrs (m shs) 67,055 H shs as a % of Total 17 Total Mkt. Cap (HK$m/US$m) 345,581 / 44,578 Major Shareholders
China Tel Corp (%) 85.6 GD Rising Asset Mgt (%) 8.4
Major H Shareholders (%) JPMorgan Chase & Co. (%) 12.0 BlackRock, Inc (%) 8.0 Commonwealth Bank of Australia (%) 6.9
H Shares-Free Float (%) 73.1 3m Avg. Daily Val. (US$m) 46.0
China Telecom Sector
China Telecom
Bloomberg: 728 HK EQUITY | Reuters: 728.HK Refer to important disclosures at the end of this report

China Telecom Sector
China Telecom
Page 8
Income Statement (RMB m) Balance Sheet (RMB m)
FY Dec 2013A 2014A 2015F 2016F FY Dec 2013A 2014A 2015F 2016F Turnover 321,584 324,394 324,800 332,393 Net Fixed Assets 443,505 450,467 492,021 525,804 Cost of Goods Sold (294,116) (295,886) (294,002) (297,700) Invts in Assocs & JVs 1,106 4,106 4,140 4,174 Gross Profit 27,468 28,508 30,798 34,693 Other LT Assets 45,845 47,158 43,098 38,851 Other Opng (Exp)/Inc 0 0 0 0 Cash & ST Invts 18,357 21,815 11,559 4,781 Operating Profit 27,468 28,508 30,798 34,693 Inventory 6,523 4,225 4,225 4,225 Other Non Opg (Exp)/Inc 670 6 6 6 Debtors 20,022 21,562 22,640 23,772 Associates & JV Inc 103 34 34 34 Other Current Assets 7,881 11,941 12,470 13,026 Net Interest (Exp)/Inc (5,150) (5,346) (5,572) (6,330) Total Assets 543,239 561,274 590,154 614,632 Dividend Income 0 0 0 0 Exceptional Gain/(Loss) 0 0 0 0 ST Debt 47,760 44,058 44,058 44,058 Pre-tax Profit 23,091 23,202 25,267 28,403 Creditors 81,132 88,458 91,112 93,845 Tax (5,422) (5,498) (6,064) (6,817) Other Current Liab 71,206 73,809 80,380 86,951 Minority Interest (121) (79) (192) (216) LT Debt 62,617 62,918 69,918 69,918 Preference Dividend 0 0 0 0 Other LT Liabilities 1,860 1,923 1,923 1,923 Net Profit 17,548 17,625 19,011 21,370 Shareholder’s Equity 277,741 289,183 302,109 317,394 Net Profit before Except. 17,548 17,625 19,011 21,370 Minority Interests 923 925 655 543 EBITDA 97,324 94,893 96,607 100,179 Total Cap. & Liab. 543,239 561,274 590,154 614,632 Sales Gth (%) 13.6 0.9 0.1 2.3 EBITDA Gth (%) 37.0 (2.5) 1.8 3.7 Non-Cash Wkg. Cap (117,912) (124,539) (132,157) (139,773) Opg Profit Gth (%) 29.5 3.8 8.0 12.6 Net Cash/(Debt) (92,020) (85,161) (102,417) (109,195) Net Profit Gth (%) 17.4 0.4 7.9 12.4 Effective Tax Rate (%) 23.5 23.7 24.0 24.0 Cash Flow Statement (RMB m) Rates & Ratio
FY Dec 2013A 2014A 2015F 2016F FY Dec 2013A 2014A 2015F 2016F Pre-Tax Profit 23,088 23,257 25,267 28,403 Gross Margins (%) 8.5 8.8 9.5 10.4 Dep. & Amort. 69,083 66,345 65,769 65,446 Opg Profit Margin (%) 8.5 8.8 9.5 10.4 Tax Paid (4,539) (6,407) (5,498) (6,064) Net Profit Margin (%) 5.5 5.4 5.9 6.4 Assoc. & JV Inc/(loss) (103) (34) (34) (34) ROAE (%) 6.5 6.2 6.4 6.9 (Pft)/ Loss on disposal of FAs 0 0 0 0 ROA (%) 3.2 3.2 3.3 3.5 Chg in Wkg.Cap. 450 8,796 7,618 7,617 ROCE (%) 5.5 5.5 5.7 6.2 Other Operating CF 372 4,448 4,170 4,266 Div Payout Ratio (%) 34.8 34.5 32.0 28.5 Net Operating CF 88,351 96,405 97,292 99,634 Net Interest Cover (x) 5.3 5.3 5.5 5.5 Capital Exp.(net) (71,032) (80,457) (108,000) (100,000) Asset Turnover (x) 0.6 0.6 0.6 0.6 Other Invts.(net) (14,269) (2,990) 0 0 Debtors Turn (avg days) 22.0 23.4 24.8 25.5 Invts in Assoc. & JV 0 0 0 0 Creditors Turn (avg days) 121.7 134.8 143.6 145.3 Div from Assoc & JV 0 0 0 0 Inventory Turn (avg days) 10.1 8.5 6.8 6.6 Other Investing CF (22,647) 1,739 0 0 Current Ratio (x) 0.3 0.3 0.2 0.2 Net Investing CF (107,948) (81,708) (108,000) (100,000) Quick Ratio (x) 0.2 0.2 0.2 0.1 Div Paid (5,433) (6,198) (6,085) (6,085) Net Debt/Equity (X) 0.3 0.3 0.3 0.3 Chg in Gross Debt 10,928 (3,798) 7,000 0 Capex to Debt (%) 64.4 75.2 94.8 87.7 Capital Issues 0 0 0 0 Z-Score (X) 1.5 1.5 1.5 1.5 Other Financing CF 142 (331) (463) (327) N.Cash/(Debt)PS (RMB) (1.42) (1.31) (1.58) (1.68) Net Financing CF 5,637 (10,327) 453 (6,412) Opg CFPS (RMB) 1.09 1.08 1.11 1.14 Currency Adjustments (69) (4) 0 0 Free CFPS (RMB) 0.21 0.20 (0.13) 0.00 Chg in Cash (14,029) 4,366 (10,256) (6,779)
Interim Income Statement (RMB m) Segmental Breakdown (RMB m) / Key Assumptions
FY Dec 1H2013 2H2013 1H2014 2H2014 FY Dec 2013A 2014A 2015F 2016F Turnover 157,559 164,025 165,973 158,421 Revenues (RMB m) Cost of Goods Sold (142,122) (151,994) (148,211) (147,675) Mobile 151,186 151,611 151,616 157,403 Gross Profit 15,437 12,031 17,762 10,746 Internet 71,432 74,622 75,069 76,827 Other Oper. (Exp)/Inc 0 0 0 0 Traditional voice 38,633 33,587 29,894 27,554 Operating Profit 15,437 12,031 17,762 10,746 Others 55,035 58,902 62,265 64,534 Other Non Opg (Exp)/Inc 673 (3) 2 4 Total 316,286 318,722 318,844 326,318 Associates & JV Inc 27 76 7 27 Net Interest (Exp)/Inc (2,642) (2,508) (2,703) (2,643) Key Assumptions Exceptional Gain/(Loss) 0 0 0 0 Mobile sub net add (m) 25.0 0.0 9.6 8.4 Pre-tax Profit 13,495 9,596 15,068 8,134 Mobile ARPU (Rmb) 54.8 54.0 53.2 53.3 Tax (3,225) (2,197) (3,561) (1,937) EBITDA margin (%) 30.0 29.2 29.7 30.1 Minority Interest (68) (53) (38) (41) Broadband sub net add (m) 10.0 6.9 6.4 5.9 Net Profit 10,202 7,346 11,469 6,156 Fixed-line sub net add (m) (7.2) (9.5) (7.9) (3.5) Net profit bef Except. 10,202 7,346 11,469 6,156 Sales Gth (%) 14.2 13.0 5.3 (3.4) Opg Profit Gth (%) 24.0 37.4 15.1 (10.7) Net Profit Gth (%) 16.0 19.3 12.4 (16.2) Gross Margins (%) 9.8 7.3 10.7 6.8 Opg Profit Margins (%) 9.8 7.3 10.7 6.8 Net Profit Margins (%) 6.5 4.5 6.9 3.9 Source: Company, DBS Vickers

Page 9 www.dbsvickers.com ed-TH / sa- DL
HOLD
Last Traded Price: HK$10.68 (HSI : 24,552) Price Target : HK$ 10.60 (1% downside) (Prev HK$11.2) Potential Catalyst: Strong mobile sub growth and tower asset sales Where We Differ: Our FY15 earnings are lower than consensus Analyst Tsz Wang TAM CFA, +852 2971 1772 [email protected] Price Relative
54
74
94
114
134
154
174
194
214
8.3
10.3
12.3
14.3
16.3
18.3
Aug-11 Aug-12 Aug-13 Aug-14 Aug-15
Relative IndexHK$
China Unicom (LHS) Relative HSI INDEX (RHS)
Forecasts and Valuation FY Dec (RMB m) 2013A 2014A 2015F 2016FTurnover 295,038 284,681 270,556 265,392 EBITDA 84,850 94,133 97,464 101,334 Pre-tax Profit 13,714 15,931 16,393 17,896 Net Profit 10,408 12,055 12,459 13,601 Net Pft (Pre Ex) 10,408 12,055 12,459 13,601 EPS (RMB) 0.44 0.51 0.52 0.57 EPS (HK$) 0.55 0.63 0.65 0.71 EPS Gth (%) 46.1 14.9 2.9 9.2 Diluted EPS (HK$) 0.53 0.61 0.65 0.71 DPS (HK$) 0.20 0.25 0.25 0.25 BV Per Share (HK$) 11.49 11.86 12.26 12.72 PE (X) 19.4 16.9 16.4 15.1 P/Cash Flow (X) 2.6 2.3 2.2 2.1 P/Free CF (X) 35.4 11.0 nm 12.5 EV/EBITDA (X) 3.8 3.3 3.4 3.1 Net Div Yield (%) 1.9 2.3 2.3 2.3 P/Book Value (X) 0.9 0.9 0.9 0.8 Net Debt/Equity (X) 0.6 0.5 0.5 0.5 ROAE (%) 4.9 5.4 5.4 5.7 Earnings Rev (%): (8) (5) Consensus EPS (RMB) 0.55 0.61
Other Broker Recs: B: 16 S: 4 H: 10
ICB Industry: Telecommunications ICB Sector: Mobile Telecommunications Principal Business: An integrated telecom service provider in Mainland China, with fixed-line coverage in 10 northern provinces. Source of all data: Company, DBSV, Thomson Reuters, HKEX
Sub loss puts long-term growth at risk
2Q profitability recovery is uncertain if cut in marketing cost overdone in 1Q
Long-term growth at risk with shrinking sub base
Market position threatened by CM
Maintain HOLD on cautious long-term outlook 2Q profitability is uncertain. In 1Q15, service revenue fell by 6% y-o-y to Rmb60bn. Mobile service revenue actually decreased by 10% to 37bn, mainly due to the negative impact from VAT. Fixed-line service revenue grew by 1% to Rmb23bn. EBITDA and net profit grew by 6% and 1% respectively. But CU might step up its handset subsidies or marketing expenses again, in view of sub loss in the past few months. Therefore, 2Q profitability is uncertain.
Long-term growth at risk with shrinking sub base. We believe that CU had cut more aggressively in marketing expenses, which explains the good profitability in 1Q15 amid revenue decline. The quarterly results look to outperform the other two operators. However, we also notice mobile sub loss of 9.8m in 1H15. This poses risks on long-term growth potential if the trend continues. CU’s market position in 3G/4G segment has been threatened by CM since the market entered the 4G era. CU’s strategy of rural expansion is also risky as the investment on network may not be efficient due to potentially low utilisation.
Maintain HOLD on cautious outlook. We revised down our earnings by 8% and 5% for FY15 and FY16 respectively, on lower service revenue. While short-term earnings could hold up well, we are cautious on CU’s long-term outlook, after entering the 4G era, with sub loss and ARPU pressure. Maintain HOLD, with a new TP set at HK$10.6, or 15x FY16 PE. Our upside risk would be the speculation on the one-off gain from tower sales in 3Q15, which is positive to short-term stock sentiment.
At A Glance Issued Capital (m shrs) 23,947 Mkt. Cap (HK$m/US$m) 255,753 / 32,991
Major Shareholders China United Network Comm. (%) 75.9 Telefonica S.A. (%) 5.0
Free Float (%) 19.0 3m Avg. Daily Val. (US$m) 58.8
China Telecom Sector
China Unicom
Bloomberg: 762 HK EQUITY | Reuters: 0762.HK Refer to important disclosures at the end of this report

China Telecom Sector
China Unicom
Page 10
Income Statement (RMB m) Balance Sheet (RMB m)
FY Dec 2013A 2014A 2015F 2016F FY Dec 2013A 2014A 2015F 2016F Turnover 295,038 284,681 270,556 265,392 Net Fixed Assets 439,663 447,532 471,660 473,423 Cost of Goods Sold (279,271) (265,778) (250,773) (243,983) Invts in Assocs & JVs 0 3,037 3,037 3,037 Gross Profit 15,767 18,903 19,783 21,409 Other LT Assets 37,298 37,929 34,871 31,510 Other Opng (Exp)/Inc 0 0 0 0 Cash & ST Invts 21,560 25,364 13,072 24,691 Operating Profit 15,767 18,903 19,783 21,409 Inventory 5,536 4,378 4,378 4,378 Other Non Opg (Exp)/Inc 887 1,362 1,000 1,000 Debtors 14,842 14,671 14,671 14,671 Associates & JV Inc 0 0 0 0 Other Current Assets 10,272 12,161 12,161 12,161 Net Interest (Exp)/Inc (2,940) (4,334) (4,390) (4,513) Total Assets 529,171 545,072 553,849 563,871 Dividend Income 0 0 0 0 Exceptional Gain/(Loss) 0 0 0 0 ST Debt 129,470 112,694 112,694 112,694 Pre-tax Profit 13,714 15,931 16,393 17,896 Creditors 102,212 120,371 120,371 120,371 Tax (3,306) (3,876) (3,934) (4,295) Other Current Liab 63,557 58,855 60,262 61,711 Minority Interest 0 0 0 0 LT Debt 13,483 23,880 23,880 23,880 Preference Dividend 0 0 0 0 Other LT Liabilities 1,550 1,731 1,432 1,192 Net Profit 10,408 12,055 12,459 13,601 Shareholder’s Equity 218,899 227,541 235,211 244,023 Net Profit before Except. 10,408 12,055 12,459 13,601 Minority Interests 0 0 0 0 EBITDA 84,850 94,133 97,464 101,334 Total Cap. & Liab. 529,171 545,072 553,849 563,871 Sales Gth (%) 18.5 (3.5) (5.0) (1.9) EBITDA Gth (%) 14.7 10.9 3.5 4.0 Non-Cash Wkg. Cap (135,119) (148,016) (149,423) (150,872) Opg Profit Gth (%) 35.9 19.9 4.7 8.2 Net Cash/(Debt) (121,393) (111,210) (123,502) (111,883) Net Profit Gth (%) 46.7 15.8 3.4 9.2 Effective Tax Rate (%) 24.1 24.3 24.0 24.0 Cash Flow Statement (RMB m) Rates & Ratio
FY Dec 2013A 2014A 2015F 2016F FY Dec 2013A 2014A 2015F 2016F Pre-Tax Profit 13,714 15,931 16,393 17,896 Gross Margins (%) 5.3 6.6 7.3 8.1 Dep. & Amort. 68,196 73,868 76,680 78,925 Opg Profit Margin (%) 5.3 6.6 7.3 8.1 Tax Paid (3,219) (4,620) (3,876) (3,934) Net Profit Margin (%) 3.5 4.2 4.6 5.1 Assoc. & JV Inc/(loss) 0 0 0 0 ROAE (%) 4.9 5.4 5.4 5.7 (Pft)/ Loss on disposal of FAs 0 0 0 0 ROA (%) 2.0 2.2 2.3 2.4 Chg in Wkg.Cap. (2,263) (1,329) 1,107 1,209 ROCE (%) 3.3 3.9 4.1 4.3 Other Operating CF 2,054 4,244 2,192 2,312 Div Payout Ratio (%) 36.6 39.7 38.4 35.2 Net Operating CF 78,482 88,094 92,497 96,409 Net Interest Cover (x) 5.4 4.4 4.5 4.7 Capital Exp.(net) (72,758) (69,586) (100,000) (80,000) Asset Turnover (x) 0.6 0.5 0.5 0.5 Other Invts.(net) (6,050) (3,807) 0 0 Debtors Turn (avg days) 17.7 18.9 19.8 20.2 Invts in Assoc. & JV 0 (3,075) 0 0 Creditors Turn (avg days) 182.2 211.7 252.4 266.2 Div from Assoc & JV 0 0 0 0 Inventory Turn (avg days) 9.8 9.4 9.2 9.7 Other Investing CF 1,698 1,149 0 0 Current Ratio (x) 0.2 0.2 0.2 0.2 Net Investing CF (77,110) (75,319) (100,000) (80,000) Quick Ratio (x) 0.1 0.1 0.1 0.1 Div Paid (2,686) (3,677) (4,789) (4,789) Net Debt/Equity (X) 0.6 0.5 0.5 0.5 Chg in Gross Debt 2,166 (6,640) 0 0 Capex to Debt (%) 50.9 51.0 73.2 58.6 Capital Issues 1,102 871 0 0 Z-Score (X) 0.6 0.6 0.6 0.7 Other Financing CF 1,344 473 0 0 N.Cash/(Debt)PS (RMB) (6.37) (5.80) (6.44) (5.83) Net Financing CF 1,926 (8,973) (4,789) (4,789) Opg CFPS (RMB) 3.41 3.75 3.82 3.98 Currency Adjustments 0 0 0 0 Free CFPS (RMB) 0.24 0.78 (0.31) 0.69 Chg in Cash 3,298 3,802 (12,292) 11,619
Interim Income Statement (RMB m) Segmental Breakdown (RMB m) / Key Assumptions
FY Dec 1H2013 2H2013 1H2014 2H2014 FY Dec 2013A 2014A 2015F 2016F Turnover 144,307 150,731 149,569 135,112 Revenues (RMB m) Cost of Goods Sold (136,036) (143,235) (138,762) (127,016) Fixed-line 86,566 88,481 90,323 92,948 Gross Profit 8,271 7,496 10,807 8,096 Mobile 207,526 194,898 179,333 171,545 Other Oper. (Exp)/Inc 0 0 0 0 Others 946 1,302 900 900 Operating Profit 8,271 7,496 10,807 8,096 Total 295,038 284,681 270,556 265,392 Other Non Opg (Exp)/Inc 215 672 604 758 Associates & JV Inc 0 0 0 0 Net Interest (Exp)/Inc (1,394) (1,546) (2,574) (1,760) Key Assumptions Exceptional Gain/(Loss) 0 0 0 0 Mobile sub net add (m) 41.5 18.1 (17.9) (16.2) Pre-tax Profit 7,092 6,622 8,837 7,094 Mobile ARPU (Rmb) 48.2 44.1 42.5 43.3 Tax (1,775) (1,531) (2,148) (1,728) EBITDA margin (%) 28.5 32.6 35.7 37.8 Minority Interest 0 0 0 0 Broadband sub net add (m) 6.1 4.1 3.9 3.6 Net Profit 5,317 5,091 6,689 5,366 Fixed-line sub net add (m) (4.3) (5.6) (2.5) (0.5) Net profit bef Except. 5,317 5,091 6,689 5,366 Sales Gth (%) 18.6 18.5 3.6 (10.4) Opg Profit Gth (%) 41.0 30.7 30.7 8.0 Net Profit Gth (%) 55.0 38.9 25.8 5.4 Gross Margins (%) 5.7 5.0 7.2 6.0 Opg Profit Margins (%) 5.7 5.0 7.2 6.0 Net Profit Margins (%) 3.7 3.4 4.5 4.0 Source: Company, DBS Vickers

Page 11 www.dbsvickers.com ed-TH / sa- DL
H: BUY
Last Traded Price (H): HK$16.64 (HSI : 24,552) Price Target (H): HK$ 24.00 (44% upside) (Prev HK$23.0)
A: HOLD (initiate coverage)
Last Traded Price (A): RMB20.65 (CSI300 Index : 3,907) Price Target (A): RMB 24.00 (16% upside) Potential Catalyst: Capex hike and margin expansion Where We Differ: Our FY15 earnings are slighly higher than concensus Analyst Tsz Wang TAM CFA, +852 2971 1772 [email protected] Price Relative
43
63
83
103
123
143
163
183
203
7.0
12.0
17.0
22.0
27.0
Aug-11 Aug-12 Aug-13 Aug-14 Aug-15
Relative IndexHK$
ZTE (LHS) Relative HSI INDEX (RHS)
46
66
86
106
126
146
166
186
206
6.9
8.9
10.9
12.9
14.9
16.9
18.9
20.9
22.9
24.9
Aug-11 Aug-12 Aug-13 Aug-14 Aug-15
Relative IndexRMB
ZTE-A (LHS) Relative SHSZ300 Index (RHS)
Forecasts and Valuation (H-share) FY Dec (RMB m) 2013A 2014A 2015F 2016FTurnover 75,234 81,471 92,511 101,216 EBITDA 4,846 6,469 7,629 8,642 Pre-tax Profit 1,828 3,538 4,568 5,188 Net Profit 1,358 2,634 3,435 3,901 Net Pft (Pre Ex) 1,358 2,634 3,435 3,901 EPS (RMB) 0.33 0.64 0.83 0.95 EPS (HK$) 0.41 0.80 1.04 1.18 EPS Gth (%) N/A 94.0 30.4 13.6 Diluted EPS (HK$) 0.41 0.80 1.04 1.18 DPS (HK$) 0.03 0.21 0.26 0.30 BV Per Share (HK$) 6.82 7.53 8.36 9.28 PE (X) 40.5 20.9 16.0 14.1 P/Cash Flow (X) 123.0 49.9 30.5 27.2 P/Free CF (X) nm 1044.3 216.5 116.7 EV/EBITDA (X) 13.9 10.8 9.4 8.5 Net Div Yield (%) 0.2 1.3 1.6 1.8 P/Book Value (X) 2.4 2.2 2.0 1.8 Net Debt/Equity (X) 0.5 0.5 0.5 0.5 ROAE (%) 6.2 11.1 13.1 13.4 Earnings Rev (%): 20 21 Consensus EPS (RMB) 0.82 0.93 Other Broker Recs: B: 16 S: 1 H: 3
ICB Industry: Technology ICB Sector: Technology Hardware & Equipment Principal Business: ZTE is a leading telecom equipment vendor in China. Source of all data: Company, DBSV, Thomson Reuters, HKEX
A key beneficiary of 4G capex cycle
Strong 1H15 results, thanks to domestic 4G capex
Expanding into government and enterprise segments
Expecting 30% and 14% earnings growth for the coming two years
Maintain BUY on ZTE (H-share); adding ZTE (A-share) coverage with HOLD rating on valuation grounds
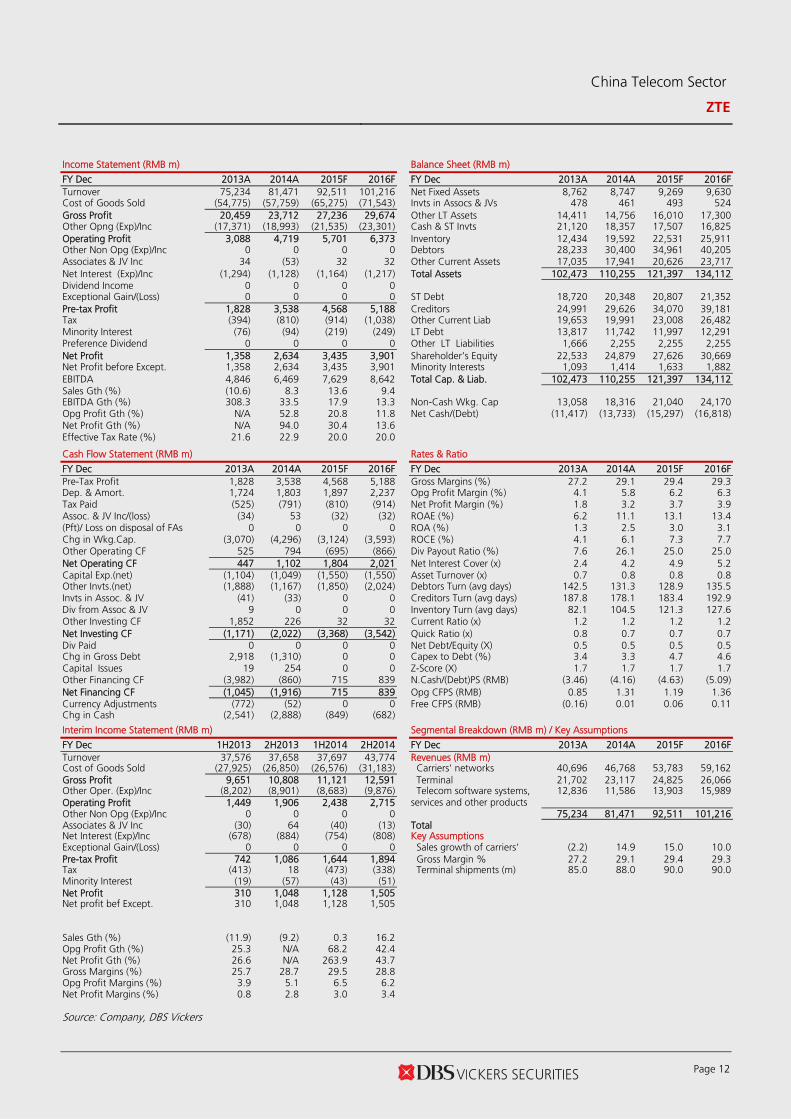
Earnings grew by 43% y-o-y in 1H15. ZTE has released its preliminary interim results on 21 July 2015. Revenue grew by 22% y-o-y to Rmb46bn, thanks to faster progress of domestic 4G investments, and market share gain. Earnings increased by 43% y-o-y to Rmb1.6bn. Overall performance is satisfactory. We expect earnings growth of 30% and 14% for the coming two years.
Expanding into government and enterprise segments. ZTE is expanding its customer base from telecom operators to government and enterprise segments (with estimated revenue of Rmb8bn in FY14). This involves smart city projects and IT system projects, etc. The company has also entered the wireless charging business for electric vehicles, which is still at an early development stage with minimal revenue contribution. We believe that expansion in business scope and customer base is positive for long-term growth.
Maintain BUY on ZTE (H-share). We revised up our earnings by 20% and 21% for FY15 and FY16 respectively, to incorporate stronger revenue growth from carriers’ network segment. Maintain BUY on ZTE (H-share) at HK$24, or 20x FY16 PE, representing 1SD above its historical average, justified by its strong earnings recovery in the next two years. We also add coverage to ZTE (A-share) (000063 CH) with a TP of Rmb24, or 25x FY16 PE, also 1SD above its historical average. The A-H premium of 25% is in line with historical pattern. We rate ZTE (A-share) a HOLD on limited upside.
At A Glance Issued Capital - H shares (m shs) 756 - Non H shrs (m shs) 4,125 H shs as a % of Total 15 Total Mkt. Cap (HK$m/US$m) 81,212 / 10,477 Major Shareholders
Zhongxingxin (%) 30.8 Major H Shareholders (%)
BlackRock, Inc. (%) 5.58 JPMorgan Chase & Co. (%) 5.26
H Shares-Free Float (%) 100.0 3m Avg. Daily Val. (US$m) 21.6
China Telecom Sector
ZTE
Bloomberg: 763 HK EQUITY | 000063 CH EQUITY | Reuters: 0763.HK | 000063.SZ
Refer to important disclosures at the end of this report
China Telecom Sector
ZTE
Page 12
Income Statement (RMB m) Balance Sheet (RMB m)
FY Dec 2013A 2014A 2015F 2016F FY Dec 2013A 2014A 2015F 2016F Turnover 75,234 81,471 92,511 101,216 Net Fixed Assets 8,762 8,747 9,269 9,630 Cost of Goods Sold (54,775) (57,759) (65,275) (71,543) Invts in Assocs & JVs 478 461 493 524 Gross Profit 20,459 23,712 27,236 29,674 Other LT Assets 14,411 14,756 16,010 17,300 Other Opng (Exp)/Inc (17,371) (18,993) (21,535) (23,301) Cash & ST Invts 21,120 18,357 17,507 16,825 Operating Profit 3,088 4,719 5,701 6,373 Inventory 12,434 19,592 22,531 25,911 Other Non Opg (Exp)/Inc 0 0 0 0 Debtors 28,233 30,400 34,961 40,205 Associates & JV Inc 34 (53) 32 32 Other Current Assets 17,035 17,941 20,626 23,717 Net Interest (Exp)/Inc (1,294) (1,128) (1,164) (1,217) Total Assets 102,473 110,255 121,397 134,112 Dividend Income 0 0 0 0 Exceptional Gain/(Loss) 0 0 0 0 ST Debt 18,720 20,348 20,807 21,352 Pre-tax Profit 1,828 3,538 4,568 5,188 Creditors 24,991 29,626 34,070 39,181 Tax (394) (810) (914) (1,038) Other Current Liab 19,653 19,991 23,008 26,482 Minority Interest (76) (94) (219) (249) LT Debt 13,817 11,742 11,997 12,291 Preference Dividend 0 0 0 0 Other LT Liabilities 1,666 2,255 2,255 2,255 Net Profit 1,358 2,634 3,435 3,901 Shareholder’s Equity 22,533 24,879 27,626 30,669 Net Profit before Except. 1,358 2,634 3,435 3,901 Minority Interests 1,093 1,414 1,633 1,882 EBITDA 4,846 6,469 7,629 8,642 Total Cap. & Liab. 102,473 110,255 121,397 134,112 Sales Gth (%) (10.6) 8.3 13.6 9.4 EBITDA Gth (%) 308.3 33.5 17.9 13.3 Non-Cash Wkg. Cap 13,058 18,316 21,040 24,170 Opg Profit Gth (%) N/A 52.8 20.8 11.8 Net Cash/(Debt) (11,417) (13,733) (15,297) (16,818) Net Profit Gth (%) N/A 94.0 30.4 13.6 Effective Tax Rate (%) 21.6 22.9 20.0 20.0 Cash Flow Statement (RMB m) Rates & Ratio
FY Dec 2013A 2014A 2015F 2016F FY Dec 2013A 2014A 2015F 2016F Pre-Tax Profit 1,828 3,538 4,568 5,188 Gross Margins (%) 27.2 29.1 29.4 29.3 Dep. & Amort. 1,724 1,803 1,897 2,237 Opg Profit Margin (%) 4.1 5.8 6.2 6.3 Tax Paid (525) (791) (810) (914) Net Profit Margin (%) 1.8 3.2 3.7 3.9 Assoc. & JV Inc/(loss) (34) 53 (32) (32) ROAE (%) 6.2 11.1 13.1 13.4 (Pft)/ Loss on disposal of FAs 0 0 0 0 ROA (%) 1.3 2.5 3.0 3.1 Chg in Wkg.Cap. (3,070) (4,296) (3,124) (3,593) ROCE (%) 4.1 6.1 7.3 7.7 Other Operating CF 525 794 (695) (866) Div Payout Ratio (%) 7.6 26.1 25.0 25.0 Net Operating CF 447 1,102 1,804 2,021 Net Interest Cover (x) 2.4 4.2 4.9 5.2 Capital Exp.(net) (1,104) (1,049) (1,550) (1,550) Asset Turnover (x) 0.7 0.8 0.8 0.8 Other Invts.(net) (1,888) (1,167) (1,850) (2,024) Debtors Turn (avg days) 142.5 131.3 128.9 135.5 Invts in Assoc. & JV (41) (33) 0 0 Creditors Turn (avg days) 187.8 178.1 183.4 192.9 Div from Assoc & JV 9 0 0 0 Inventory Turn (avg days) 82.1 104.5 121.3 127.6 Other Investing CF 1,852 226 32 32 Current Ratio (x) 1.2 1.2 1.2 1.2 Net Investing CF (1,171) (2,022) (3,368) (3,542) Quick Ratio (x) 0.8 0.7 0.7 0.7 Div Paid 0 0 0 0 Net Debt/Equity (X) 0.5 0.5 0.5 0.5 Chg in Gross Debt 2,918 (1,310) 0 0 Capex to Debt (%) 3.4 3.3 4.7 4.6 Capital Issues 19 254 0 0 Z-Score (X) 1.7 1.7 1.7 1.7 Other Financing CF (3,982) (860) 715 839 N.Cash/(Debt)PS (RMB) (3.46) (4.16) (4.63) (5.09) Net Financing CF (1,045) (1,916) 715 839 Opg CFPS (RMB) 0.85 1.31 1.19 1.36 Currency Adjustments (772) (52) 0 0 Free CFPS (RMB) (0.16) 0.01 0.06 0.11 Chg in Cash (2,541) (2,888) (849) (682)
Interim Income Statement (RMB m) Segmental Breakdown (RMB m) / Key Assumptions
FY Dec 1H2013 2H2013 1H2014 2H2014 FY Dec 2013A 2014A 2015F 2016F Turnover 37,576 37,658 37,697 43,774 Revenues (RMB m) Cost of Goods Sold (27,925) (26,850) (26,576) (31,183) Carriers' networks 40,696 46,768 53,783 59,162 Gross Profit 9,651 10,808 11,121 12,591 Terminal 21,702 23,117 24,825 26,066 Other Oper. (Exp)/Inc (8,202) (8,901) (8,683) (9,876) Telecom software systems,
services and other products 12,836 11,586 13,903 15,989
Operating Profit 1,449 1,906 2,438 2,715 Other Non Opg (Exp)/Inc 0 0 0 0 75,234 81,471 92,511 101,216 Associates & JV Inc (30) 64 (40) (13) Total Net Interest (Exp)/Inc (678) (884) (754) (808) Key Assumptions Exceptional Gain/(Loss) 0 0 0 0 Sales growth of carriers' (2.2) 14.9 15.0 10.0 Pre-tax Profit 742 1,086 1,644 1,894 Gross Margin % 27.2 29.1 29.4 29.3 Tax (413) 18 (473) (338) Terminal shipments (m) 85.0 88.0 90.0 90.0 Minority Interest (19) (57) (43) (51) Net Profit 310 1,048 1,128 1,505 Net profit bef Except. 310 1,048 1,128 1,505 Sales Gth (%) (11.9) (9.2) 0.3 16.2 Opg Profit Gth (%) 25.3 N/A 68.2 42.4 Net Profit Gth (%) 26.6 N/A 263.9 43.7 Gross Margins (%) 25.7 28.7 29.5 28.8 Opg Profit Margins (%) 3.9 5.1 6.5 6.2 Net Profit Margins (%) 0.8 2.8 3.0 3.4 Source: Company, DBS Vickers

Page 13 www.dbsvickers.com ed-TH / sa- DL
HOLD
Last Traded Price: HK$1.84 (HSI : 24,552) Price Target: HK$ 1.90 (3% upside) (Prev HK$3.50) Potential Catalyst: Capex hike and adoption of femto cell by operators Where We Differ: Our FY15 earnings are higher than concensus Analyst Tsz Wang TAM CFA, +852 2971 1772 [email protected] Price Relative
23
43
63
83
103
123
143
163
183
203
1.2
2.2
3.2
4.2
5.2
6.2
Aug-11 Aug-12 Aug-13 Aug-14 Aug-15
Relative IndexHK$
Comba (LHS) Relative HSI INDEX (RHS)
Forecasts and Valuation FY Dec (HK$ m) 2013A 2014A 2015F 2016FTurnover 5,721 6,733 7,831 8,553 EBITDA 43 417 629 711 Pre-tax Profit (160) 202 377 444 Net Profit (241) 151 313 369 Net Pft (Pre Ex) (241) 151 313 369 EPS (HK$) (0.14) 0.08 0.17 0.19 EPS Gth (%) (18.5) N/A 104.1 15.9 Diluted EPS (HK$) (0.14) 0.08 0.17 0.19 DPS (HK$) 0.00 0.02 0.04 0.05 BV Per Share (HK$) 2.19 2.01 2.10 2.23 PE (X) nm 22.4 11.0 9.5 P/Cash Flow (X) 10.2 23.9 18.3 12.1 P/Free CF (X) 13.5 42.0 39.3 18.6 EV/EBITDA (X) 70.2 8.3 5.8 5.3 Net Div Yield (%) 0.0 1.2 2.3 2.6 P/Book Value (X) 0.8 0.9 0.9 0.8 Net Debt/Equity (X) CASH 0.0 0.0 0.1 ROAE (%) (6.4) 4.1 8.2 9.0 Earnings Rev (%): (37) (38) Consensus EPS (HK$) 0.23 0.27 Other Broker Recs: B: 2 S: 1 H: 2
ICB Industry: Technology ICB Sector: Technology Hardware & Equipment Principal Business: Comba is engaged in manufacturing and sales
of wireless enhancement equipment, antennas and subsystems
to Chinese telecom operators. Source of all data: Company, DBSV, Thomson Reuters, HKEX
Femto cell a potential driver, but insignificant contribution in 1H15
Positive profit alert of 40%+ earnings growth in 1H15 partly anticipated
Expect stable antenna business with wireless enhancement picking up
Investors will be looking for management’s update on Femto cell
Potential recovery priced-in; maintain HOLD Positive profit alert partially anticipated. Comba issued a positive profit alert on 24 July 2015. The company expects earnings to increase by 40%+ y-o-y (from 1H14’s HK$72m), which was ascribed to (i) strong revenue from China market due to 4G investment, and (ii) gross margin recovery. The announcement also highlighted an exchange loss during the period. The overall strong performance should be partially anticipated, in our view, due to a low base in 1H14. Note that the market is expecting c.100% earnings recovery for the full year.
Limited contribution from Femto cell. We expect Comba's antenna business to remain stable, as FY14 set a high base. Note that base station net adds and therefore outdoor antenna demand this year should be similar to that in FY14, based on operators’ target. On the other hand, wireless enhancement project should pick up after the initial 4G network build-out phase in China. Management expects femto cell to be a key product for CM’s 4G coverage solution. We believe that contribution remained limited in1H15, but it is a potential revenue driver from 2H15 onwards.
Potential recovery priced-in; maintain HOLD. We were overly optimistic on earnings recovery previously; and we have revised down our earnings by 37% and 38% for FY15 and FY16 respectively on lower gross margin assumptions. Note that the company made an inventory and receivable write-off of HK$124m as well as an exchange loss of HK$59m in FY14. While we still expect more write-offs this year, our full-year forecast of HK$313m (vs. HK$151m in FY14) looks achievable. We have revised down our TP to HK$1.9, or 10x FY16 PE. We rate the stock a HOLD on valuation grounds.
At A Glance Issued Capital (m shrs) 1,679 Mkt. Cap (HK$m/US$m) 3,089 / 398
Major Shareholders Fok Tung Ling (%) 33.0 Zhang Yue Jun (%) 10.1
Free Float (%) 56.9 3m Avg. Daily Val. (US$m) 3.0
China Telecom Sector
Comba
Bloomberg: 2342 HK EQUITY | Reuters: 2342.HK Refer to important disclosures at the end of this report

China Telecom Sector
Comba
Page 14
Income Statement (HK$ m) Balance Sheet (HK$ m)
FY Dec 2013A 2014A 2015F 2016F FY Dec 2013A 2014A 2015F 2016F Turnover 5,721 6,733 7,831 8,553 Net Fixed Assets 813 735 717 696 Cost of Goods Sold (4,355) (4,973) (5,715) (6,232) Invts in Assocs & JVs 0 0 0 0 Gross Profit 1,366 1,760 2,116 2,321 Other LT Assets 392 394 422 440 Other Opng (Exp)/Inc (1,480) (1,513) (1,661) (1,801) Cash & ST Invts 1,636 1,619 1,484 1,413 Operating Profit (114) 247 455 520 Inventory 2,240 2,235 2,570 2,878 Other Non Opg (Exp)/Inc 0 0 0 0 Debtors 4,530 4,382 5,039 5,644 Associates & JV Inc 0 0 0 0 Other Current Assets 707 773 866 952 Net Interest (Exp)/Inc (45) (45) (77) (76) Total Assets 10,318 10,137 11,098 12,023 Dividend Income 0 0 0 0 Exceptional Gain/(Loss) 0 0 0 0 ST Debt 1,232 973 973 973 Pre-tax Profit (160) 202 377 444 Creditors 3,839 3,423 3,936 4,409 Tax (85) (48) (60) (71) Other Current Liab 1,176 1,281 1,458 1,620 Minority Interest 4 (3) (4) (4) LT Debt 326 678 678 678 Preference Dividend 0 0 0 0 Other LT Liabilities 17 16 16 16 Net Profit (241) 151 313 369 Shareholder’s Equity 3,674 3,710 3,978 4,264 Net Profit before Except. (241) 151 313 369 Minority Interests 54 56 60 63 EBITDA 43 417 629 711 Total Cap. & Liab. 10,318 10,137 11,098 12,023 Sales Gth (%) (9.7) 17.7 16.3 9.2 EBITDA Gth (%) 101.1 862.9 50.9 13.0 Non-Cash Wkg. Cap 2,462 2,685 3,081 3,445 Opg Profit Gth (%) (1.1) N/A 83.9 14.3 Net Cash/(Debt) 78 (32) (167) (238) Net Profit Gth (%) (19.0) N/A 107.5 17.8 Effective Tax Rate (%) N/A 23.5 16.0 16.0 Cash Flow Statement (HK$ m) Rates & Ratio
FY Dec 2013A 2014A 2015F 2016F FY Dec 2013A 2014A 2015F 2016F Pre-Tax Profit (160) 202 377 444 Gross Margins (%) 23.9 26.1 27.0 27.1 Dep. & Amort. 158 170 174 191 Opg Profit Margin (%) (2.0) 3.7 5.8 6.1 Tax Paid (127) (77) (48) (60) Net Profit Margin (%) (4.2) 2.2 4.0 4.3 Assoc. & JV Inc/(loss) 0 0 0 0 ROAE (%) (6.4) 4.1 8.2 9.0 (Pft)/ Loss on disposal of FAs 0 0 0 0 ROA (%) (2.4) 1.5 3.0 3.2 Chg in Wkg.Cap. 352 (213) (396) (364) ROCE (%) (2.1) 3.5 6.9 7.5 Other Operating CF 78 59 79 78 Div Payout Ratio (%) N/A 26.6 25.0 25.0 Net Operating CF 301 141 188 288 Net Interest Cover (x) (2.5) 5.5 5.9 6.8 Capital Exp.(net) (74) (61) (100) (100) Asset Turnover (x) 0.6 0.7 0.7 0.7 Other Invts.(net) (129) (121) (100) (100) Debtors Turn (avg days) 286.6 241.6 219.5 227.9 Invts in Assoc. & JV 0 0 0 0 Creditors Turn (avg days) 309.6 275.9 242.4 252.1 Div from Assoc & JV 0 0 0 0 Inventory Turn (avg days) 194.9 170.0 158.3 164.6 Other Investing CF (330) 38 (15) (13) Current Ratio (x) 1.5 1.6 1.6 1.6 Net Investing CF (533) (143) (215) (213) Quick Ratio (x) 1.0 1.1 1.0 1.0 Div Paid 0 (18) (45) (83) Net Debt/Equity (X) CASH 0.0 0.0 0.1 Chg in Gross Debt (1) 93 0 0 Capex to Debt (%) 4.7 3.7 6.1 6.1 Capital Issues 0 0 0 0 Z-Score (X) 1.5 1.7 1.8 1.8 Other Financing CF (55) (61) (63) (63) N.Cash/(Debt)PS (HK$) 0.05 (0.02) (0.09) (0.12) Net Financing CF (56) 13 (108) (145) Opg CFPS (HK$) (0.03) 0.19 0.31 0.34 Currency Adjustments 42 (27) 0 0 Free CFPS (HK$) 0.14 0.04 0.05 0.10 Chg in Cash (246) (16) (135) (71)
Interim Income Statement (HK$ m) Segmental Breakdown (HK$ m) / Key Assumptions
FY Dec 1H2013 2H2013 1H2014 2H2014 FY Dec 2013A 2014A 2015F 2016F Turnover 2,162 3,558 3,024 3,710 Revenues (HK$ m) Cost of Goods Sold (1,611) (2,744) (2,172) (2,801) Wireless enhancement and
services 3,433 3,780 4,346 4,868
Gross Profit 552 814 852 908 Other Oper. (Exp)/Inc (667) (813) (723) (790) Antennas and subsystems 1,866 2,616 2,747 2,747 Operating Profit (116) 1 129 119 Wireless Access 421 337 737 937 Other Non Opg (Exp)/Inc 0 0 0 0 Total 5,721 6,733 7,831 8,553 Associates & JV Inc 0 0 0 0 Net Interest (Exp)/Inc (21) (24) (18) (27) Key Assumptions Exceptional Gain/(Loss) 0 0 0 0 Revenue growth % (9.7) 17.7 16.3 9.2 Pre-tax Profit (137) (23) 111 91 Gross Margin % 23.9 26.1 27.0 27.1 Tax (18) (67) (37) (11) Minority Interest 4 0 (1) (2) Net Profit (151) (90) 72 79 Net profit bef Except. (151) (90) 72 79 Sales Gth (%) (16.6) (4.9) 39.8 4.3 Opg Profit Gth (%) 17.5 (95.9) N/A 10,669.3 Net Profit Gth (%) 6.4 (117.5) N/A N/A Gross Margins (%) 25.5 22.9 28.2 24.5 Opg Profit Margins (%) (5.3) 0.0 4.3 3.2 Net Profit Margins (%) (7.0) (2.5) 2.4 2.1 Source: Company, DBS Vickers

Page 15 www.dbsvickers.com ed-TH / sa- DL
BUY
Last Traded Price: HK$3.27 (HSI : 24,552) Price Target : HK$ 4.50 (38% upside) (Prev HK$4.20) Potential Catalyst: Capex hike Where We Differ: Our FY15 earnings are lower than consensus Analyst Tsz Wang TAM CFA, +852 2971 1772 [email protected] Price Relative
66
86
106
126
146
166
186
206
2.6
3.1
3.6
4.1
4.6
5.1
5.6
6.1
Aug-11 Aug-12 Aug-13 Aug-14 Aug-15
Relative IndexHK$
China Communications Services (LHS)
Relative HSI INDEX (RHS)
Forecasts and Valuation FY Dec (RMB m) 2013A 2014A 2015F 2016FTurnover 68,459 73,176 79,044 84,232 EBITDA 3,498 3,397 3,509 3,819 Pre-tax Profit 2,779 2,631 2,774 3,083 Net Profit 2,238 2,150 2,252 2,503 Net Pft (Pre Ex) 2,238 2,150 2,252 2,503 EPS (RMB) 0.32 0.31 0.33 0.36 EPS (HK$) 0.40 0.39 0.41 0.45 EPS Gth (%) (8.4) (3.9) 4.7 11.1 Diluted EPS (HK$) 0.40 0.39 0.41 0.45 DPS (HK$) 0.16 0.12 0.12 0.14 BV Per Share (HK$) 3.92 4.15 4.44 4.77 PE (X) 8.1 8.4 8.1 7.2 P/Cash Flow (X) 56.5 11.3 9.3 8.7 P/Free CF (X) nm 21.9 15.7 14.7 EV/EBITDA (X) 3.2 3.1 3.1 3.0 Net Div Yield (%) 4.9 3.6 3.7 4.1 P/Book Value (X) 0.8 0.8 0.7 0.7 Net Debt/Equity (X) CASH CASH CASH CASH ROAE (%) 10.6 9.6 9.4 9.8 Earnings Rev (%): (4) (2) Consensus EPS (RMB) 0.35 0.39 Other Broker Recs: B: 12 S: 0 H: 3
ICB Industry: Technology ICB Sector: Technology Hardware & Equipment Principal Business: CCS provides telecoms infrastructure services including design, construction and project supervision of wireless, broadband networks and support systems. Source of all data: Company, DBSV, Thomson Reuters, HKEX
Expect stable 1H15, recovery in 2H15
Expect minimal profitability recovery in 1H15
Margin expansion challenging amid slow revenue
More long-term benefit from Towerco establishment
We like CCS's stable performance; maintain BUY
Expect slight profitability recovery in 1H15. Management previously targeted a high single-digit revenue growth for FY15. We expect a back-end loaded pattern this year, with more capex and revenue recognition towards year-end. The slow revenue growth in 1H15 has made margin recovery more challenging. The general cost inflation may also result in higher opex-to-revenue ratio. We expect stable earnings for 1H15, but a more meaningful recovery in 2H15.
More long-term benefit from Towerco establishment. We believe that operator customers’ initiative of cutting down their operating expenses has resulted in pricing pressure for CCS; or the company will simply avoid low-margin projects, which may lead to slower sales growth. On a positive note, the establishment of towerco should be positive to CCS in the long term with new opportunities created such as value-added services on facilities. However, short-term revenue contribution is uncertain as the Towerco is viewed as a new customer.
Maintain BUY on steady performance. We revised down our earnings slightly by 4% and 2% for FY15 and FY16 respectively on slower revenue growth. We now forecast a 5% earnings growth for the full year. We like CCS’s stable performance and positive medium-term outlook. The stock also offers a 3.6% dividend yield. Maintain BUY with a TP of HK$4.5, or 10x FY16 PE (from previously 10x FY15 PE).
At A Glance Issued Capital - H shares (m shs) 2,391 - Non H shrs (m shs) 4,535 H shs as a % of Total 35 Total Mkt. Cap (HK$m/US$m) 22,648 / 2,921 Major Shareholders
China Telecom Group (%) 51.4 China Mobile (%) 8.8
Major H Shareholders (%) Blackrock, Inc. (%) 6.8 JPMorgan Chase & Co. (%) 6.0 The Bank of New York Mellon Corporation (%) 5.5 Citigroup Inc. (%) 5.3
H Shares-Free Float (%) 100.0 3m Avg. Daily Val. (US$m) 6.3
China Telecom Sector
China Communications Services
Bloomberg: 552 HK EQUITY | Reuters: 0552.HK Refer to important disclosures at the end of this report

China Telecom Sector
China Communications Services
Page 16
Income Statement (RMB m) Balance Sheet (RMB m)
FY Dec 2013A 2014A 2015F 2016F FY Dec 2013A 2014A 2015F 2016F Turnover 68,459 73,176 79,044 84,232 Net Fixed Assets 5,792 5,646 5,644 5,698 Cost of Goods Sold (58,081) (62,495) (67,455) (71,820) Invts in Assocs & JVs 72 67 92 117 Gross Profit 10,378 10,682 11,589 12,412 Other LT Assets 2,232 2,840 3,775 4,709 Other Opng (Exp)/Inc (7,693) (8,151) (8,931) (9,439) Cash & ST Invts 7,472 8,513 8,087 7,710 Operating Profit 2,685 2,531 2,659 2,973 Inventory 2,228 2,421 2,711 3,037 Other Non Opg (Exp)/Inc 0 0 0 0 Debtors 30,455 33,274 37,267 41,739 Associates & JV Inc 14 26 25 25 Other Current Assets 0 0 0 0 Net Interest (Exp)/Inc 79 74 91 85 Total Assets 48,251 52,761 57,576 63,011 Dividend Income 0 0 0 0 Exceptional Gain/(Loss) 0 0 0 0 ST Debt 54 247 247 247 Pre-tax Profit 2,779 2,631 2,774 3,083 Creditors 24,207 26,241 29,389 32,916 Tax (493) (463) (499) (555) Other Current Liab 1,479 1,891 1,927 1,983 Minority Interest (47) (18) (23) (25) LT Debt 52 39 39 39 Preference Dividend 0 0 0 0 Other LT Liabilities 171 801 801 801 Net Profit 2,238 2,150 2,252 2,503 Shareholder’s Equity 21,773 23,030 24,637 26,464 Net Profit before Except. 2,238 2,150 2,252 2,503 Minority Interests 515 513 536 561 EBITDA 3,498 3,397 3,509 3,819 Total Cap. & Liab. 48,251 52,761 57,576 63,011 Sales Gth (%) 11.3 6.9 8.0 6.6 EBITDA Gth (%) (5.8) (2.9) 3.3 8.8 Non-Cash Wkg. Cap 6,997 7,564 8,662 9,877 Opg Profit Gth (%) (8.9) (5.7) 5.0 11.8 Net Cash/(Debt) 7,367 8,227 7,801 7,425 Net Profit Gth (%) (7.0) (3.9) 4.7 11.1 Effective Tax Rate (%) 17.7 17.6 18.0 18.0 Cash Flow Statement (RMB m) Rates & Ratio
FY Dec 2013A 2014A 2015F 2016F FY Dec 2013A 2014A 2015F 2016F Pre-Tax Profit 2,779 2,631 2,774 3,083 Gross Margins (%) 15.2 14.6 14.7 14.7 Dep. & Amort. 799 841 826 822 Opg Profit Margin (%) 3.9 3.5 3.4 3.5 Tax Paid (582) (524) (463) (499) Net Profit Margin (%) 3.3 2.9 2.8 3.0 Assoc. & JV Inc/(loss) (14) (26) (25) (25) ROAE (%) 10.6 9.6 9.4 9.8 (Pft)/ Loss on disposal of FAs 0 0 0 0 ROA (%) 4.8 4.3 4.1 4.2 Chg in Wkg.Cap. (2,702) (1,519) (1,135) (1,271) ROCE (%) 10.0 8.8 8.6 9.0 Other Operating CF 42 206 (31) (31) Div Payout Ratio (%) 40.0 30.0 30.0 30.0 Net Operating CF 321 1,609 1,946 2,078 Net Interest Cover (x) NM NM NM NM Capital Exp.(net) (740) (781) (790) (842) Asset Turnover (x) 1.5 1.4 1.4 1.4 Other Invts.(net) 64 (109) (1,000) (1,000) Debtors Turn (avg days) 150.8 158.9 162.9 171.2 Invts in Assoc. & JV 0 0 0 0 Creditors Turn (avg days) 146.0 149.3 152.4 160.2 Div from Assoc & JV 62 78 63 63 Inventory Turn (avg days) 13.1 13.8 14.1 14.8 Other Investing CF (395) (65) 0 0 Current Ratio (x) 1.6 1.6 1.5 1.5 Net Investing CF (1,009) (877) (1,727) (1,779) Quick Ratio (x) 1.5 1.5 1.4 1.4 Div Paid (1,007) (942) (645) (676) Net Debt/Equity (X) CASH CASH CASH CASH Chg in Gross Debt (391) 786 0 0 Capex to Debt (%) 701.5 273.5 276.8 295.0 Capital Issues 0 0 0 0 Z-Score (X) 2.7 2.6 2.6 2.6 Other Financing CF 0 0 0 0 N.Cash/(Debt)PS (RMB) 1.33 1.48 1.41 1.34 Net Financing CF (1,398) (156) (645) (676) Opg CFPS (RMB) 0.44 0.45 0.44 0.48 Currency Adjustments (33) (23) 0 0 Free CFPS (RMB) (0.06) 0.12 0.17 0.18 Chg in Cash (2,119) 553 (426) (376)
Interim Income Statement (RMB m) Segmental Breakdown (RMB m) / Key Assumptions
FY Dec 1H2013 2H2013 1H2014 2H2014 FY Dec 2013A 2014A 2015F 2016F Turnover 32,361 36,098 33,743 39,433 Revenues (RMB m) Cost of Goods Sold (27,390) (30,691) (28,920) (33,575) TIS 32,036 34,008 37,128 39,730 Gross Profit 4,971 5,407 4,823 5,858 BPO 29,012 31,215 33,451 35,516 Other Oper. (Exp)/Inc (3,492) (4,201) (3,397) (4,754) ACO 7,411 7,953 8,465 8,985 Operating Profit 1,479 1,206 1,426 1,105 Total 68,459 73,176 79,044 84,232 Other Non Opg (Exp)/Inc 0 0 0 0 Associates & JV Inc 0 14 11 14 Net Interest (Exp)/Inc 40 39 43 31 Key Assumptions Exceptional Gain/(Loss) 0 0 0 0 Domestic operator rev gth 9.0 8.7 9.0 7.0 Pre-tax Profit 1,519 1,259 1,481 1,150 Overseas rev gth % 11.8 (0.6) 10.0 10.0 Tax (261) (232) (238) (225) Gross Margin % 15.2 14.6 14.7 14.7 Minority Interest (15) (32) (5) (12) Net Profit 1,242 996 1,238 913 Net profit bef Except. 1,242 996 1,238 913 Sales Gth (%) 9.6 12.9 4.3 9.2 Opg Profit Gth (%) (1.3) (16.7) (3.5) (8.4) Net Profit Gth (%) 1.7 (16.0) (0.4) (8.4) Gross Margins (%) 15.4 15.0 14.3 14.9 Opg Profit Margins (%) 4.6 3.3 4.2 2.8 Net Profit Margins (%) 3.8 2.8 3.7 2.3 Source: Company, DBS Vickers
Page 17 www.dbsvickers.com ed-TH / sa- DL
BUY
Last Traded Price: HK$1.87 (HSI : 24,552) Price Target: HK$ 2.90 (55% upside) (Prev HK$3.30) Potential Catalyst: Capex hike and copper price rebound Where We Differ: The market has excessively discounted the stock Analyst Tsz Wang TAM CFA, +852 2971 1772 [email protected] Price Relative
78
128
178
228
278
0.8
1.3
1.8
2.3
2.8
3.3
3.8
Mar-12 Mar-13 Mar-14 Mar-15
Relative IndexHK$
Trigiant Group (LHS) Relative HSI INDEX (RHS)
Forecasts and Valuation FY Dec (RMB m) 2013A 2014A 2015F 2016FTurnover 2,458 2,658 3,218 3,444 EBITDA 449 494 613 657 Pre-tax Profit 380 442 540 584 Net Profit 314 369 416 447 Net Pft (Pre Ex) 314 364 416 447 EPS (RMB) 0.31 0.33 0.27 0.29 EPS (HK$) 0.38 0.41 0.33 0.36 EPS Gth (%) 21.4 8.0 (19.6) 7.4 Diluted EPS (HK$) 0.38 0.41 0.33 0.36 DPS (HK$) 0.13 0.13 0.12 0.12 BV Per Share (HK$) 1.68 1.86 2.11 2.35 PE (X) 4.9 4.5 5.6 5.2 P/Cash Flow (X) 148.2 nm 11.2 7.5 P/Free CF (X) nm nm 14.8 9.0 EV/EBITDA (X) 4.0 4.7 4.3 3.9 Net Div Yield (%) 7.1 6.8 6.3 6.3 P/Book Value (X) 1.1 1.0 0.9 0.8 Net Debt/Equity (X) 0.2 0.3 0.0 0.0 ROAE (%) 25.0 21.3 18.1 16.0 Earnings Rev (%): NIl NIl Consensus EPS (RMB) 0.32 0.36 Other Broker Recs: B: 3 S: 0 H: 0
ICB Industry: Industrials ICB Sector: Electronic & Electrical Equipment Principal Business: Trigiant is the largest manufacturer of RF coaxial cable in China. Source of all data: Company, DBSV, Thomson Reuters, HKEX
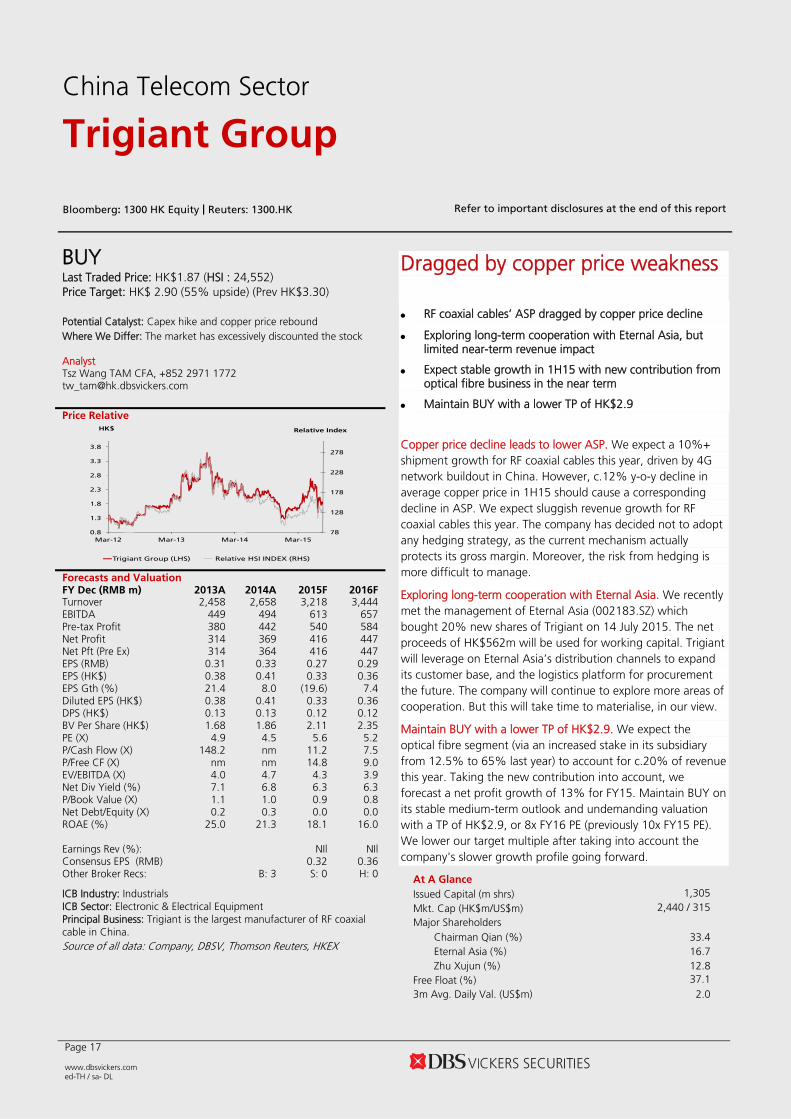
Dragged by copper price weakness RF coaxial cables’ ASP dragged by copper price decline
Exploring long-term cooperation with Eternal Asia, but limited near-term revenue impact
Expect stable growth in 1H15 with new contribution from optical fibre business in the near term
Maintain BUY with a lower TP of HK$2.9
Copper price decline leads to lower ASP. We expect a 10%+ shipment growth for RF coaxial cables this year, driven by 4G network buildout in China. However, c.12% y-o-y decline in average copper price in 1H15 should cause a corresponding decline in ASP. We expect sluggish revenue growth for RF coaxial cables this year. The company has decided not to adopt any hedging strategy, as the current mechanism actually protects its gross margin. Moreover, the risk from hedging is more difficult to manage.
Exploring long-term cooperation with Eternal Asia. We recently met the management of Eternal Asia (002183.SZ) which bought 20% new shares of Trigiant on 14 July 2015. The net proceeds of HK$562m will be used for working capital. Trigiant will leverage on Eternal Asia’s distribution channels to expand its customer base, and the logistics platform for procurement the future. The company will continue to explore more areas of cooperation. But this will take time to materialise, in our view.
Maintain BUY with a lower TP of HK$2.9. We expect the optical fibre segment (via an increased stake in its subsidiary from 12.5% to 65% last year) to account for c.20% of revenue this year. Taking the new contribution into account, we forecast a net profit growth of 13% for FY15. Maintain BUY on its stable medium-term outlook and undemanding valuation with a TP of HK$2.9, or 8x FY16 PE (previously 10x FY15 PE). We lower our target multiple after taking into account the company's slower growth profile going forward.
At A Glance Issued Capital (m shrs) 1,305 Mkt. Cap (HK$m/US$m) 2,440 / 315
Major Shareholders Chairman Qian (%) 33.4 Eternal Asia (%) 16.7 Zhu Xujun (%) 12.8
Free Float (%) 37.1 3m Avg. Daily Val. (US$m) 2.0
China Telecom Sector
Trigiant Group
Bloomberg: 1300 HK Equity | Reuters: 1300.HK Refer to important disclosures at the end of this report

China Telecom Sector
Trigiant Group
Page 18
Income Statement (RMB m) Balance Sheet (RMB m)
FY Dec 2013A 2014A 2015F 2016F FY Dec 2013A 2014A 2015F 2016F Turnover 2,458 2,658 3,218 3,444 Net Fixed Assets 255 340 359 373 Cost of Goods Sold (1,893) (2,065) (2,490) (2,668) Invts in Assocs & JVs 0 0 0 0 Gross Profit 565 593 728 776 Other LT Assets 54 176 176 176 Other Opng (Exp)/Inc (134) (120) (144) (153) Cash & ST Invts 570 842 1,236 1,312 Operating Profit 431 473 584 623 Inventory 123 155 178 196 Other Non Opg (Exp)/Inc 0 0 0 0 Debtors 1,633 2,431 2,796 3,076 Associates & JV Inc 0 0 0 0 Other Current Assets 0 0 0 0 Net Interest (Exp)/Inc (51) (37) (44) (39) Total Assets 2,634 3,944 4,746 5,133 Dividend Income 0 0 0 0 Exceptional Gain/(Loss) 0 5 0 0 ST Debt 736 1,373 1,373 1,373 Pre-tax Profit 380 442 540 584 Creditors 273 366 421 463 Tax (67) (73) (92) (99) Other Current Liab 16 74 74 74 Minority Interest 0 0 (32) (38) LT Debt 80 0 0 0 Preference Dividend 0 0 0 0 Other LT Liabilities 25 70 89 97 Net Profit 314 369 416 447 Shareholder’s Equity 1,504 1,956 2,652 2,952 Net Profit before Except. 314 364 416 447 Minority Interests 0 106 137 175 EBITDA 449 494 613 657 Total Cap. & Liab. 2,634 3,944 4,746 5,133 Sales Gth (%) 10.2 8.1 21.1 7.0 EBITDA Gth (%) 14.4 10.1 24.0 7.3 Non-Cash Wkg. Cap 1,466 2,146 2,479 2,735 Opg Profit Gth (%) 14.9 9.7 23.4 6.8 Net Cash/(Debt) (246) (531) (136) (60) Net Profit Gth (%) 24.3 17.7 12.8 7.4 Effective Tax Rate (%) 17.5 16.4 17.0 17.0 Cash Flow Statement (RMB m) Rates & Ratio
FY Dec 2013A 2014A 2015F 2016F FY Dec 2013A 2014A 2015F 2016F Pre-Tax Profit 380 442 540 584 Gross Margins (%) 23.0 22.3 22.6 22.5 Dep. & Amort. 18 21 29 34 Opg Profit Margin (%) 17.5 17.8 18.1 18.1 Tax Paid (58) (60) (73) (92) Net Profit Margin (%) 12.8 13.9 12.9 13.0 Assoc. & JV Inc/(loss) 0 0 0 0 ROAE (%) 25.0 21.3 18.1 16.0 (Pft)/ Loss on disposal of FAs 0 0 0 0 ROA (%) 12.7 11.2 9.6 9.1 Chg in Wkg.Cap. (374) (533) (333) (255) ROCE (%) 16.4 13.5 12.5 11.7 Other Operating CF 45 37 45 40 Div Payout Ratio (%) 37.6 36.5 35.4 32.9 Net Operating CF 10 (93) 209 312 Net Interest Cover (x) 8.4 12.9 13.3 16.0 Capital Exp.(net) (37) (40) (50) (50) Asset Turnover (x) 1.0 0.8 0.7 0.7 Other Invts.(net) 0 110 0 0 Debtors Turn (avg days) 215.9 279.0 296.5 311.1 Invts in Assoc. & JV 0 0 0 0 Creditors Turn (avg days) 56.9 57.1 58.4 61.3 Div from Assoc & JV 0 0 0 0 Inventory Turn (avg days) 26.1 24.8 24.7 25.9 Other Investing CF 3 (217) 11 16 Current Ratio (x) 2.3 1.9 2.3 2.4 Net Investing CF (35) (147) (39) (34) Quick Ratio (x) 2.1 1.8 2.2 2.3 Div Paid (96) (123) (147) (147) Net Debt/Equity (X) 0.2 0.3 0.0 0.0 Chg in Gross Debt (150) 457 0 0 Capex to Debt (%) 4.6 2.9 3.6 3.6 Capital Issues 279 1 427 0 Z-Score (X) 3.3 2.5 2.8 2.8 Other Financing CF (52) (45) (55) (55) N.Cash/(Debt)PS (RMB) (0.28) (0.50) (0.11) (0.05) Net Financing CF (18) 290 224 (202) Opg CFPS (RMB) 0.38 0.39 0.35 0.36 Currency Adjustments 0 0 0 0 Free CFPS (RMB) (0.03) (0.12) 0.10 0.17 Chg in Cash (42) 49 394 76
Interim Income Statement (RMB m) Segmental Breakdown (RMB m) / Key Assumptions
FY Dec 1H2013 2H2013 1H2014 2H2014 FY Dec 2013A 2014A 2015F 2016F Turnover 1,266 1,192 1,353 1,305 Revenues (RMB m) Cost of Goods Sold (969) (924) (1,041) (1,024) RF coaxical cables 1,806 1,827 1,796 1,816 Gross Profit 297 268 312 281 Flame-retardant flexible cables 501 560 616 678 Other Oper. (Exp)/Inc (69) (65) (56) (63) New-type electronic 73 108 114 120 Operating Profit 228 203 255 218 Others 78 162 692 831 Other Non Opg (Exp)/Inc 0 0 0 0 Total 2,458 2,658 3,218 3,444 Associates & JV Inc 0 0 0 0 Net Interest (Exp)/Inc (27) (24) (15) (22) Key Assumptions Exceptional Gain/(Loss) 0 0 (47) 53 Volume sales of RF coaxial
cable (k km) 127.5 147.7 170.8 172.7
Pre-tax Profit 201 179 193 248 Tax (37) (30) (38) (34) ASP (Rmb k) 14.2 12.4 10.5 10.5 Minority Interest 0 0 0 0 Gross margin (%) 23.0 22.3 22.6 22.5 Net Profit 165 149 155 214 Net profit bef Except. 165 149 202 162 Sales Gth (%) 15.7 4.9 6.9 9.5 Opg Profit Gth (%) 20.3 9.4 11.8 7.3 Net Profit Gth (%) 29.3 19.2 (5.9) 43.7 Gross Margins (%) 23.4 22.5 23.0 21.5 Opg Profit Margins (%) 18.0 17.0 18.9 16.7 Net Profit Margins (%) 13.0 12.5 11.5 16.4 Source: Company, DBS Vickers
Industry Focus
China Telecom Sector
Page 19
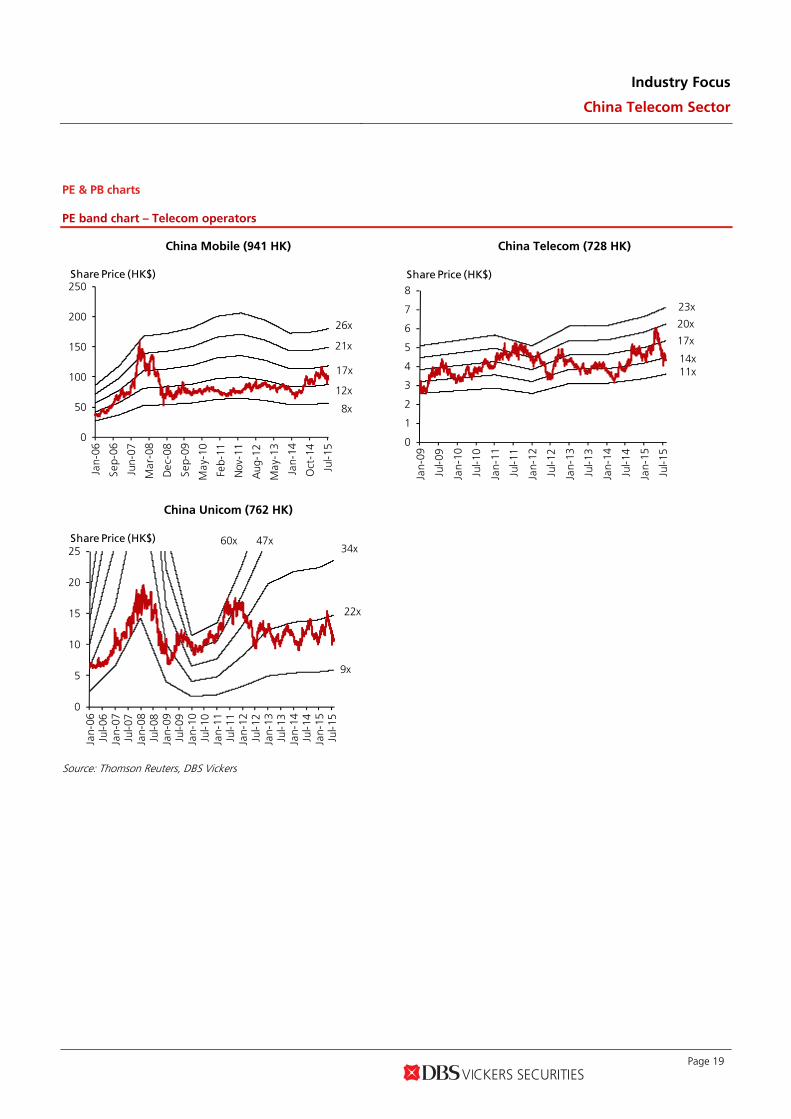
PE & PB charts
PE band chart – Telecom operators
China Mobile (941 HK) China Telecom (728 HK)
0
50
100
150
200
250
Jan-
06
Sep-
06
Jun-
07
Mar
-08
Dec
-08
Sep-
09
May
-10
Feb-
11
Nov
-11
Aug
-12
May
-13
Jan-
14
Oct
-14
Jul-1
5
Share Price (HK$)
26x
21x
17x
12x
8x
0
1
2
3
4
5
6
7
8
Jan-
09
Jul-0
9
Jan-
10
Jul-1
0
Jan-
11
Jul-1
1
Jan-
12
Jul-1
2
Jan-
13
Jul-1
3
Jan-
14
Jul-1
4
Jan-
15
Jul-1
5
Share Price (HK$)
23x
20x
17x
14x11x
China Unicom (762 HK)
0
5
10
15
20
25
Jan-
06Ju
l-06
Jan-
07Ju
l-07
Jan-
08Ju
l-08
Jan-
09Ju
l-09
Jan-
10Ju
l-10
Jan-
11Ju
l-11
Jan-
12Ju
l-12
Jan-
13Ju
l-13
Jan-
14Ju
l-14
Jan-
15Ju
l-15
Share Price (HK$) 60x 47x34x
22x
9x
Source: Thomson Reuters, DBS Vickers
Industry Focus
China Telecom Sector
Page 20
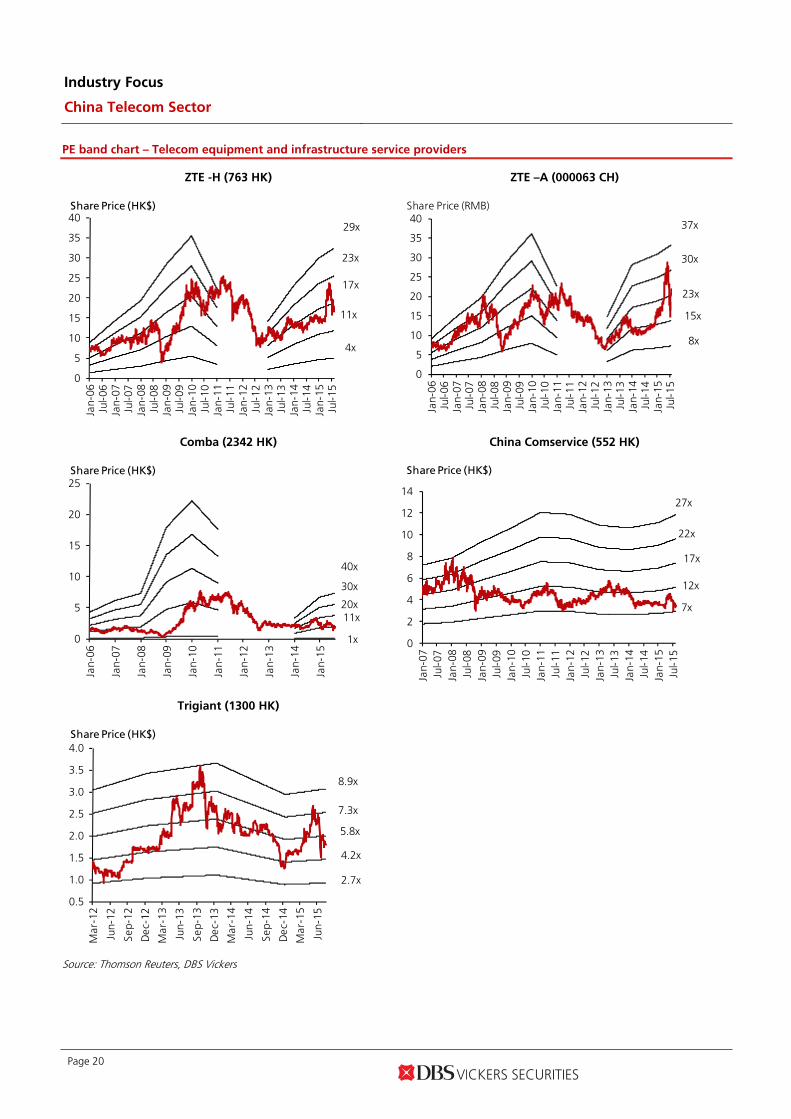
PE band chart – Telecom equipment and infrastructure service providers
ZTE -H (763 HK) ZTE –A (000063 CH)
0
5
10
15
20
25
30
35
40
Jan-
06Ju
l-06
Jan-
07Ju
l-07
Jan-
08Ju
l-08
Jan-
09Ju
l-09
Jan-
10Ju
l-10
Jan-
11Ju
l-11
Jan-
12Ju
l-12
Jan-
13Ju
l-13
Jan-
14Ju
l-14
Jan-
15Ju
l-15
Share Price (HK$)
29x
23x
17x
11x
4x
0
5
10
15
20
25
30
35
40
Jan-
06Ju
l-06
Jan-
07Ju
l-07
Jan-
08Ju
l-08
Jan-
09Ju
l-09
Jan-
10Ju
l-10
Jan-
11Ju
l-11
Jan-
12Ju
l-12
Jan-
13Ju
l-13
Jan-
14Ju
l-14
Jan-
15Ju
l-15
Share Price (RMB)
37x
30x
23x
15x
8x
Comba (2342 HK) China Comservice (552 HK)
0
5
10
15
20
25
Jan-
06
Jan-
07
Jan-
08
Jan-
09
Jan-
10
Jan-
11
Jan-
12
Jan-
13
Jan-
14
Jan-
15
Share Price (HK$)
40x
30x
20x11x
1x
0
2
4
6
8
10
12
14
Jan-
07Ju
l-07
Jan-
08Ju
l-08
Jan-
09Ju
l-09
Jan-
10Ju
l-10
Jan-
11Ju
l-11
Jan-
12Ju
l-12
Jan-
13Ju
l-13
Jan-
14Ju
l-14
Jan-
15Ju
l-15
Share Price (HK$)
27x
22x
17x
12x
7x
Trigiant (1300 HK)
0.5
1.0
1.5
2.0
2.5
3.0
3.5
4.0
Mar
-12
Jun-
12
Sep-
12
Dec
-12
Mar
-13
Jun-
13
Sep-
13
Dec
-13
Mar
-14
Jun-
14
Sep-
14
Dec
-14
Mar
-15
Jun-
15
Share Price (HK$)
8.9x
7.3x
5.8x
4.2x
2.7x
Source: Thomson Reuters, DBS Vickers

Industry Focus
China Telecom Sector
Page 21
PB band chart – Telecom operators
China Mobile (941 HK) China Telecom (728 HK)
0
50
100
150
200
250
300
350
400
Jan-
06
Sep-
06
Jun-
07
Mar
-08
Dec
-08
Sep-
09
May
-10
Feb-
11
Nov
-11
Aug
-12
May
-13
Jan-
14
Oct
-14
Jul-1
5
Share Price (HK$)
6.4x
5.1x
3.8
2.5x
1.2x
2.0
2.5
3.0
3.5
4.0
4.5
5.0
5.5
6.0
6.5
Jan-
09
Jul-0
9
Jan-
10
Jul-1
0
Jan-
11
Jul-1
1
Jan-
12
Jul-1
2
Jan-
13
Jul-1
3
Jan-
14
Jul-1
4
Jan-
15
Jul-1
5
Share Price (HK$)
1.3x
1.2x
1.0x
0.9x
0.7x
China Unicom (762 HK)
0
5
10
15
20
25
30
Jan-
06Ju
l-06
Jan-
07Ju
l-07
Jan-
08Ju
l-08
Jan-
09Ju
l-09
Jan-
10Ju
l-10
Jan-
11Ju
l-11
Jan-
12Ju
l-12
Jan-
13Ju
l-13
Jan-
14Ju
l-14
Jan-
15Ju
l-15
Share Price (HK$)
1.9x
1.6x1.3x
1.0x
0.7x
Source: Thomson Reuters, DBS Vickers

Industry Focus
China Telecom Sector
Page 22
PB band chart – Telecom equipment and infrastructure service providers
ZTE – H (763 HK) ZTE – A (000063 CH)
0
5
10
15
20
25
30
Jan-
06Ju
l-06
Jan-
07Ju
l-07
Jan-
08Ju
l-08
Jan-
09Ju
l-09
Jan-
10Ju
l-10
Jan-
11Ju
l-11
Jan-
12Ju
l-12
Jan-
13Ju
l-13
Jan-
14Ju
l-14
Jan-
15Ju
l-15
Share Price (HK$)
2.9x
2.4x
1.8x
1.2x
0.6x
0
5
10
15
20
25
30
35
Jan-
06Ju
l-06
Jan-
07Ju
l-07
Jan-
08Ju
l-08
Jan-
09Ju
l-09
Jan-
10Ju
l-10
Jan-
11Ju
l-11
Jan-
12Ju
l-12
Jan-
13Ju
l-13
Jan-
14Ju
l-14
Jan-
15Ju
l-15
Share Price (RMB)
4.4x
3.6x
2.7x
1.8x
1.0x
Comba (2342 HK) China Comservice (552 HK)
0
1
2
3
4
5
6
7
8
9
Jan-
06Ju
l-06
Jan-
07Ju
l-07
Jan-
08Ju
l-08
Jan-
09Ju
l-09
Jan-
10Ju
l-10
Jan-
11Ju
l-11
Jan-
12Ju
l-12
Jan-
13Ju
l-13
Jan-
14Ju
l-14
Jan-
15Ju
l-15
Share Price (HK$)
3.1x
2.3x
1.6x
0.9x
0.2x
0
2
4
6
8
10
12
14
16
Jan-
07Ju
l-07
Jan-
08Ju
l-08
Jan-
09Ju
l-09
Jan-
10Ju
l-10
Jan-
11Ju
l-11
Jan-
12Ju
l-12
Jan-
13Ju
l-13
Jan-
14Ju
l-14
Jan-
15Ju
l-15
Share Price (HK$)
3.1x
2.5x
1.9x
1.3x
0.6x
Trigiant (1300 HK)
0.5
1.0
1.5
2.0
2.5
3.0
3.5
4.0
4.5
5.0
Mar
-12
Jun-
12
Sep-
12
Dec
-12
Mar
-13
Jun-
13
Sep-
13
Dec
-13
Mar
-14
Jun-
14
Sep-
14
Dec
-14
Mar
-15
Jun-
15
Share Price (HK$)
2.0x
1.6x
1.3x
0.9x
0.6x
Source: Thomson Reuters, DBS Vickers

Industry Focus
China Telecom Sector
Page 23
PE chart – Telecom operators
China Mobile (941 HK) China Telecom (728 HK)
810121416182022242628
Jan-
06Ju
l-06
Jan-
07Ju
l-07
Jan-
08Ju
l-08
Jan-
09Ju
l-09
Jan-
10Ju
l-10
Jan-
11Ju
l-11
Jan-
12Ju
l-12
Jan-
13Ju
l-13
Jan-
14Ju
l-14
Jan-
15Ju
l-15
x
+1SD: 15.3x
Avg: 12.4x
-1SD: 9.4x
579
1113151719212325
Jan-
09
Jul-0
9
Jan-
10
Jul-1
0
Jan-
11
Jul-1
1
Jan-
12
Jul-1
2
Jan-
13
Jul-1
3
Jan-
14
Jul-1
4
Jan-
15
Jul-1
5
x
Avg: 16.1x
+1SD: 18.4x
-1SD: 13.8x
China Unicom (762 HK)
0
10
20
30
40
50
60
70
Jan-
06Ju
l-06
Jan-
07Ju
l-07
Jan-
08Ju
l-08
Jan-
09Ju
l-09
Jan-
10Ju
l-10
Jan-
11Ju
l-11
Jan-
12Ju
l-12
Jan-
13Ju
l-13
Jan-
14Ju
l-14
Jan-
15Ju
l-15
x
Avg: 25.7x
+1SD: 40.1x
-1SD: 11.2x
Source: Thomson Reuters, DBS Vickers

Industry Focus
China Telecom Sector
Page 24
PE chart – Telecom equipment and infrastructure service providers
ZTE – H (763 HK) ZTE – A (000063 CH)
0
5
10
15
20
25
30
35
Jan-
06Ju
l-06
Jan-
07Ju
l-07
Jan-
08Ju
l-08
Jan-
09Ju
l-09
Jan-
10Ju
l-10
Jan-
11Ju
l-11
Jan-
12Ju
l-12
Jan-
13Ju
l-13
Jan-
14Ju
l-14
Jan-
15Ju
l-15
x
Avg: 16.4x
+1SD: 20.3x
-1SD: 12.5x
0
5
10
15
20
25
30
35
40
Jan-
06Ju
l-06
Jan-
07Ju
l-07
Jan-
08Ju
l-08
Jan-
09Ju
l-09
Jan-
10Ju
l-10
Jan-
11Ju
l-11
Jan-
12Ju
l-12
Jan-
13Ju
l-13
Jan-
14Ju
l-14
Jan-
15Ju
l-15
x
Avg: 21.2x
+1SD: 26.9x
-1SD: 15.5x
Comba (2342 HK) China Comservice (552 HK)
0
5
10
15
20
25
30
Jan-
06M
ay-0
6Se
p-06
Jan-
07M
a y-0
7Se
p-07
Jan-
08M
ay-0
8Se
p-08
Jan-
09M
a y-0
9Se
p-09
Jan-
10M
a y-1
0Se
p-10
Jan-
11M
a y-1
1Se
p-11
Jan-
12M
a y-1
2Se
p-12
Jan-
13M
a y-1
3Se
p-13
Jan-
14M
a y-1
4Se
p-14
Jan-
15M
a y-1
5
x
Avg: 10.2x
+1SD: 15.6x
-1SD: 4.9x
6
11
16
21
26
31
Jan-
07Ju
l-07
Jan-
08Ju
l-08
Jan-
09Ju
l-09
Jan-
10Ju
l-10
Jan-
11Ju
l-11
Jan-
12Ju
l-12
Jan-
13Ju
l-13
Jan-
14Ju
l-14
Jan-
15Ju
l-15
x
Avg: 12.4x
+1SD: 16.6x
-1SD: 8.2x
Trigiant (1300 HK)
0123456789
10
Mar
-12
Jun-
12
Sep-
12
Dec
-12
Mar
-13
Jun-
13
Sep-
13
Dec
-13
Mar
-14
Jun-
14
Sep-
14
Dec
-14
Mar
-15
Jun-
15
x
Avg: 5.3x
+1SD: 6.6x
-1SD: 4.1x
Source: Thomson Reuters, DBS Vickers

Industry Focus
China Telecom Sector
Page 25
PB chart – Telecom operators
China Mobile (941 HK) China Telecom (728 HK)
1.0
2.0
3.0
4.0
5.0
6.0
7.0
Jan-
06Ju
l-06
Jan-
07Ju
l-07
Jan-
08Ju
l-08
Jan-
09Ju
l-09
Jan-
10Ju
l-10
Jan-
11Ju
l-11
Jan-
12Ju
l-12
Jan-
13Ju
l-13
Jan-
14Ju
l-14
Jan-
15Ju
l-15
x
+1SD: 3.3x
Avg: 2.3x
-1SD: 1.4x
0.6
0.7
0.8
0.9
1.0
1.1
1.2
1.3
1.4
Jan-
09
Jul-0
9
Jan-
10
Jul-1
0
Jan-
11
Jul-1
1
Jan-
12
Jul-1
2
Jan-
13
Jul-1
3
Jan-
14
Jul-1
4
Jan-
15
Jul-1
5
x
Avg: 1x
+1SD: 1.1x
-1SD: 0.9x
China Unicom (762 HK)
0.4
0.6
0.8
1.0
1.2
1.4
1.6
1.8
2.0
Jan-
06Ju
l-06
Jan-
07Ju
l-07
Jan-
08Ju
l-08
Jan-
09Ju
l-09
Jan-
10Ju
l-10
Jan-
11Ju
l-11
Jan-
12Ju
l-12
Jan-
13Ju
l-13
Jan-
14Ju
l-14
Jan-
15Ju
l-15
x
Avg: 1.1x
+1SD: 1.4x
-1SD: 0.9x
Source: Thomson Reuters, DBS Vickers

Industry Focus
China Telecom Sector
Page 26
PB chart – Telecom equipment and infrastructure service providers
ZTE – H (763 HK) ZTE – A (000063 CH)
0.0
0.5
1.0
1.5
2.0
2.5
3.0
3.5
Jan-
06Ju
l-06
Jan-
07Ju
l-07
Jan-
08Ju
l-08
Jan-
09Ju
l-09
Jan-
10Ju
l-10
Jan-
11Ju
l-11
Jan-
12Ju
l-12
Jan-
13Ju
l-13
Jan-
14Ju
l-14
Jan-
15Ju
l-15
x
Avg: 1.9x
+1SD: 2.3x
-1SD: 1.4x
0.00.51.01.52.02.53.03.54.04.55.0
Jan-
06Ju
l-06
Jan-
07Ju
l-07
Jan-
08Ju
l-08
Jan-
09Ju
l-09
Jan-
10Ju
l-10
Jan-
11Ju
l-11
Jan-
12Ju
l-12
Jan-
13Ju
l-13
Jan-
14Ju
l-14
Jan-
15Ju
l-15
x
Avg: 2.3x
+1SD: 3x
-1SD: 1.7x
Comba (2342 HK) China Comservice (552 HK)
0.0
0.5
1.0
1.5
2.0
2.5
3.0
3.5
Jan-
06Ju
l-06
Jan-
07Ju
l-07
Jan-
08Ju
l-08
Jan-
09Ju
l-09
Jan-
10Ju
l-10
Jan-
11Ju
l-11
Jan-
12Ju
l-12
Jan-
13Ju
l-13
Jan-
14Ju
l-14
Jan-
15Ju
l-15
x
Avg: 1.3x
+1SD: 2x
-1SD: 0.7x
0.6
1.1
1.6
2.1
2.6
3.1
3.6
Jan-
07Ju
l-07
Jan-
08Ju
l-08
Jan-
09Ju
l-09
Jan-
10Ju
l-10
Jan-
11Ju
l-11
Jan-
12Ju
l-12
Jan-
13Ju
l-13
Jan-
14Ju
l-14
Jan-
15Ju
l-15
x
Avg: 1.4x
+1SD: 1.9x
-1SD: 0.9x
Trigiant (1300 HK)
0.0
0.5
1.0
1.5
2.0
2.5
Mar
-12
Jun-
12
Sep-
12
Dec
-12
Mar
-13
Jun-
13
Sep-
13
Dec
-13
Mar
-14
Jun-
14
Sep-
14
Dec
-14
Mar
-15
Jun-
15
x
Avg: 1.1x
+1SD: 1.4x
-1SD: 0.8x
Source: Thomson Reuters, DBS Vickers
Industry Focus
China Telecom Sector
Page 27
DBSV recommendations are based an Absolute Total Return* Rating system, defined as follows:
STRONG BUY (>20% total return over the next 3 months, with identifiable share price catalysts within this time frame)
BUY (>15% total return over the next 12 months for small caps, >10% for large caps)
HOLD (-10% to +15% total return over the next 12 months for small caps, -10% to +10% for large caps)
FULLY VALUED (negative total return i.e. > -10% over the next 12 months)
SELL (negative total return of > -20% over the next 3 months, with identifiable catalysts within this time frame)
Share price appreciation + dividends GENERAL DISCLOSURE/DISCLAIMER This report is prepared by DBS Vickers (Hong Kong) Limited (“DBSVHK”), a direct wholly-owned subsidiary of DBS Vickers Securities Holdings Pte Ltd ("DBSVH"). This report is intended for clients of DBSV Group only and no part of this document may be (i) copied, photocopied or duplicated in any form or by any means or (ii) redistributed without the prior written consent of DBSVHK. The research set out in this report is based on information obtained from sources believed to be reliable, but we (which collectively refers to DBSVHK and/or DBSVH) do not make any representation or warranty as to its accuracy, completeness or correctness. Opinions expressed are subject to change without notice. This document is prepared for general circulation. Any recommendation contained in this document does not have regard to the specific investment objectives, financial situation and the particular needs of any specific addressee. This document is for the information of addressees only and is not to be taken in substitution for the exercise of judgement by addressees, who should obtain separate independent legal or financial advice. DBSVHK accepts no liability whatsoever for any direct, indirect and/or consequential loss (including any claims for loss of profit) arising from any use of and/or reliance upon this document and/or further communication given in relation to this document. This document is not to be construed as an offer or a solicitation of an offer to buy or sell any securities. DBSVH is a wholly-owned subsidiary of DBS Bank Ltd. DBS Bank Ltd along with its affiliates and/or persons associated with any of them may from time to time have interests in the securities mentioned in this document. DBSVHK, DBS Bank Ltd and their associates, their directors, and/or employees may have positions in, and may effect transactions in securities mentioned herein and may also perform or seek to perform broking, investment banking and other banking services for these companies. Any valuations, opinions, estimates, forecasts, ratings or risk assessments herein constitutes a judgment as of the date of this report, and there can be no assurance that future results or events will be consistent with any such valuations, opinions, estimates, forecasts, ratings or risk assessments. The information in this document is subject to change without notice, its accuracy is not guaranteed, it may be incomplete or condensed and it may not contain all material information concerning the company (or companies) referred to in this report. The valuations, opinions, estimates, forecasts, ratings or risk assessments described in this report were based upon a number of estimates and assumptions and are inherently subject to significant uncertainties and contingencies. It can be expected that one or more of the estimates on which the valuations, opinions, estimates, forecasts, ratings or risk assessments were based will not materialize or will vary significantly from actual results. Therefore, the inclusion of the valuations, opinions, estimates, forecasts, ratings or risk assessments described herein IS NOT TO BE RELIED UPON as a representation and/or warranty by DBSVHK and/or DBSVH (and/or any persons associated with the aforesaid entities), that:
a. such valuations, opinions, estimates, forecasts, ratings or risk assessments or their underlying assumptions will be achieved, and
b. there is any assurance that future results or events will be consistent with any such valuations, opinions, estimates, forecasts, ratings or risk assessments stated therein.
Any assumptions made in this report that refers to commodities, are for the purposes of making forecasts for the company (or companies) mentioned herein. They are not to be construed as recommendations to trade in the physical commodity or in the futures contract relating to the commodity referred to in this report. DBS Vickers Securities (USA) Inc ("DBSVUSA"), a U.S.-registered broker-dealer, does not have its own investment banking or research department, nor has it participated in any investment banking transaction as a manager or co-manager in the past twelve months. ANALYST CERTIFICATION The research analyst primarily responsible for the content of this research report, in part or in whole, certifies that the views about the companies and their securities expressed in this report accurately reflect his/her personal views. The analyst also certifies that no part of his/her compensation was, is, or will be, directly, or indirectly, related to specific recommendations or views expressed in this report. As of the date the report is published, the analyst and his / her spouse and/or relatives and/or associate who are financially dependent on the analyst, do not hold interests in the securities recommended in this report (“interest” includes direct or indirect ownership of securities, directorships and trustee positions).
Industry Focus
China Telecom Sector
Page 28
COMPANY-SPECIFIC / REGULATORY DISCLOSURES 1. DBSVHK and its subsidiaries do not have a proprietary position in the securities recommended in this report as of the date the report is
published.
2. DBSVHK, DBSVUSA, DBS Bank Ltd and/or other affiliates may beneficially own a total of 1% or more of any class of common equity securities of the subject companies mentioned in this document as of the latest available date of the updated information.
3. Compensation for investment banking services: DBSVHK, DBSVUSA, DBS Bank Ltd and/or other affiliates have received compensation, within the past 12 months, and within the next 3 months may receive or intends to seek compensation for investment banking services from China Unicom (762 HK) mentioned in this document.
DBSVUSA does not have its own investment banking or research department, nor has it participated in any investment banking transaction as a manager or co-manager in the past twelve months. Any US persons wishing to obtain further information, including any clarification on disclosures in this disclaimer, or to effect a transaction in any security discussed in this document should contact DBSVUSA exclusively.
RESTRICTIONS ON DISTRIBUTION General This report is not directed to, or intended for distribution to or use by, any person or entity who is a citizen or resident of or
located in any locality, state, country or other jurisdiction where such distribution, publication, availability or use would be contrary to law or regulation.
Australia This document is being distributed in Australia by DBSVHK, which is exempted from the requirement to hold an Australian Financial Services Licence under the Corporation Act 2001 [“CA”] in respect of financial services provided to the recipients. DBSVHK is regulated by the Securities and Futures Commission under the laws of Hong KONG, which differ from Australian laws. Distribution of this report is intended only for “wholesale investors” within the meaning of the CA.
Hong Kong This report is being distributed in Hong Kong by DBS Vickers (Hong Kong) Limited which is licensed and regulated by the Hong Kong Securities and Futures Commission.
Indonesia This report is being distributed in Indonesia by PT DBS Vickers Securities Indonesia.
Malaysia This report is distributed in Malaysia by AllianceDBS Research Sdn Bhd ("ADBSR"). Recipients of this report, received from ADBSR are to contact the undersigned at 603-2604 3333 in respect of any matters arising from or in connection with this report. In addition to the General Disclosure/Disclaimer found at the preceding page, recipients of this report are advised that ADBSR (the preparer of this report), its holding company Alliance Investment Bank Berhad, their respective connected and associated corporations, affiliates, their directors, officers, employees, agents and parties related or associated with any of them may have positions in, and may effect transactions in the securities mentioned herein and may also perform or seek to perform broking, investment banking/corporate advisory and other services for the subject companies. They may also have received compensation and/or seek to obtain compensation for broking, investment banking/corporate advisory and other services from the subject companies.
Wong Ming Tek, Executive Director, ADBSR
Singapore This report is distributed in Singapore by DBS Bank Ltd (Company Regn. No. 196800306E) or DBSVS (Company Regn No. 198600294G), both of which are Exempt Financial Advisers as defined in the Financial Advisers Act and regulated by the Monetary Authority of Singapore. DBS Bank Ltd and/or DBSVS, may distribute reports produced by its respective foreign entities, affiliates or other foreign research houses pursuant to an arrangement under Regulation 32C of the Financial Advisers Regulations. Where the report is distributed in Singapore to a person who is not an Accredited Investor, Expert Investor or an Institutional Investor, DBS Bank Ltd accepts legal responsibility for the contents of the report to such persons only to the extent required by law. Singapore recipients should contact DBS Bank Ltd at 6327 2288 for matters arising from, or in connection with the report.
Thailand This report is being distributed in Thailand by DBS Vickers Securities (Thailand) Co Ltd. Research reports distributed are only intended for institutional clients only and no other person may act upon it.
United Kingdom
This report is being distributed in the UK by DBS Vickers Securities (UK) Ltd, who is an authorised person in the meaning of the Financial Services and Markets Act and is regulated by The Financial Conduct Authority. Research distributed in the UK is intended only for institutional clients.
Dubai
This research report is being distributed in The Dubai International Financial Centre (“DIFC”) by DBS Bank Ltd., (DIFC Branch) having its office at PO Box 506538, 3rd Floor, Building 3, East Wing, Gate Precinct, Dubai International Financial Centre (DIFC), Dubai, United Arab Emirates. DBS Bank Ltd., (DIFC Branch) is regulated by The Dubai Financial Services Authority. This research report is intended only for professional clients (as defined in the DFSA rulebook) and no other person may act upon it.
United States Neither this report nor any copy hereof may be taken or distributed into the United States or to any U.S. person except in compliance with any applicable U.S. laws and regulations. It is being distributed in the United States by DBSV US, which accepts responsibility for its contents. Any U.S. person receiving this report who wishes to effect transactions in any securities referred to herein should contact DBS Vickers Securities (USA) Inc (“DBSVUSA”) directly and not its affiliate.
Other jurisdictions
In any other jurisdictions, except if otherwise restricted by laws or regulations, this report is intended only for qualified, professional, institutional or sophisticated investors as defined in the laws and regulations of such jurisdictions.
DBS Vickers (Hong Kong) Limited
18th Floor Man Yee building, 68 Des Voeux Road Central, Central, Hong Kong
Tel: (852) 2820-4888, Fax: (852) 2868-1523


![Bharti Telecom Performance Appraisal in Bharti Telecom[1]](https://img.dokumen.tips/doc/110x75/547f3ee15806b5b35e8b47d6/bharti-telecom-performance-appraisal-in-bharti-telecom1.jpg)
