Embed Size (px)
Citation preview

GLHN Architects & Engineers, Inc. Chilled Water System New Mexico State University Not For Construction 0874.00 Utility Development Plan June 16, 2009 Stage Two Report
CHILLED WATER SYSTEM
INTRODUCTION New Mexico State University currently uses a chilled water production and distribution system in order to provide space cooling services for 56 buildings on the main campus, comprising nearly 3,800,000 square feet of conditioned space. According to recent history, approximately 18,250,000 ton-hrs of refrigeration is delivered to campus annually at a peak rate of roughly 6,600 tons. CHILLED WATER SYSTEM DESCRIPTION The current chilled water production manifold for the NMSU campus consists of three 1500 ton Carrier 19XR electrically driven centrifugal chillers and two nominal 1570 ton Carrier 16JR-150L double effect absorption chillers. Also included in the production manifold is a thermal storage facility consisting of two 1.5 million gallon tanks underground at the central utility plant capable of storing up to 25,000 ton-hrs of refrigeration. In all, the production manifold is capable of producing up to 6,600 tons of chilled water. Chilled water is delivered to campus through a primary-secondary-tertiary pumping arrangement, representative of dedicated constant speed chiller pumps, independent building booster pumps and the main pumping manifold which moves chilled water from the central utility plant out to the buildings as demanded and back to the central plant. This main secondary pumping manifold consists of four 3300 gpm units capable of producing 210 ft of head for a total delivery capacity to campus of 13,200 gpm. Due to the fact that the thermal storage tank is open to atmosphere and also open to the system without a closed loop separation, the returning pressure of the chilled water must be reduced to a level of about 15 psi. The secondary distributional pumping manifold is thereby arranged in a somewhat unorthodox configuration being able to lower the return chilled water pressure by forcing the flow through charging turbines which are directly connected to the pump and motor assembly in order to supplement the electrical work of the pump motor. Although there are still inherent losses in pressure through this arrangement, given the configuration of the thermal storage facility, this pumping scheme makes the best out of a somewhat unattractive energy drain. Chilled water is delivered to campus via a distribution network consisting of roughly 20,000 linear feet of both supply and return piping routed both in the utility tunnels and underground in a direct bury configuration. Chilled water piping is mostly schedule 40 steel with some lengths of pipe being PVC. Chilled water is delivered to campus at a temperature of 42°F and returns to the central utility plant at a temperature of 54°F for a total campus delta T of 12°F. As it stands, the system does appear to have some trouble delivering the level of demand of chilled water during peak conditions, mostly late in the summer. Because of this fact,

GLHN Architects & Engineers, Inc. Chilled Water System New Mexico State University Not For Construction 0874.00 Utility Development Plan June 16, 2009 Stage Two Report
the system should not be considered adequate for the current needs of the campus and further review is necessary to consider opportunities to alleviate this issue. CHILLED WATER LOADS As stated above, recent annual records indicate an operational peak chilled water delivery capacity of 6,600 tons for an annual consumption of roughly 18,250,000 ton-hrs annually. Due to the lack of and format of recorded data available, these figures, along with the U.S. Department of Energy open source building energy modeling software known as eQUEST, have been used to generate an hourly annual profile of chilled water usage on campus in order to attain the highest resolution of data available for evaluation. Figure 1 below represents the monthly consumption of chilled water by the NMSU main campus, representative of the year 2008.
Figure 1 – 2008 Monthly Chilled Water Usage
As seen in Figure 1, usage peaks in the summer months and dies down to a minimum for building core cooling in the winter, as would be expected, ranging from 800,000 ton-hrs a month in the winter to 2,750,000 ton-hrs a month in the summer. Utilizing the hourly annual chilled water profile developed in eQUEST, a chilled water load envelope for the year has been developed. Average days for each month are generated on an hourly scale in order to obtain a brief comprehensive view of the hourly,
GLHN Architects & Engineers, Inc. Chilled Water System New Mexico State University Not For Construction 0874.00 Utility Development Plan June 16, 2009 Stage Two Report
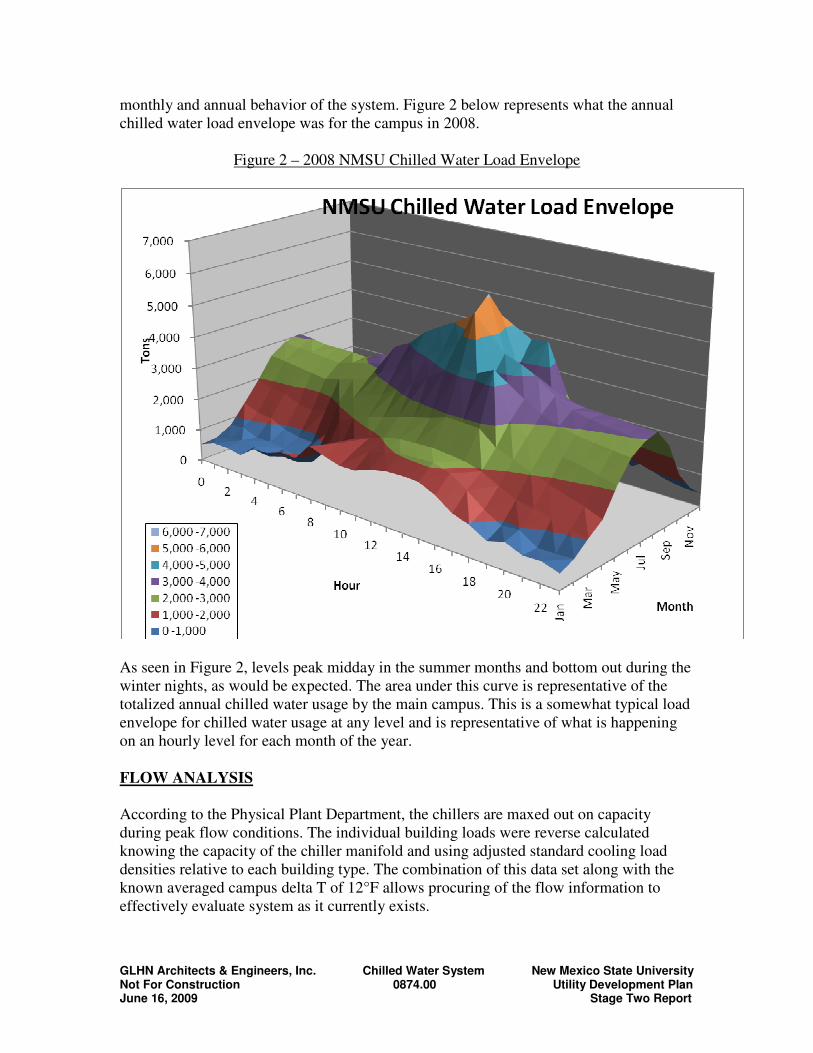
monthly and annual behavior of the system. Figure 2 below represents what the annual chilled water load envelope was for the campus in 2008.
Figure 2 – 2008 NMSU Chilled Water Load Envelope
As seen in Figure 2, levels peak midday in the summer months and bottom out during the winter nights, as would be expected. The area under this curve is representative of the totalized annual chilled water usage by the main campus. This is a somewhat typical load envelope for chilled water usage at any level and is representative of what is happening on an hourly level for each month of the year. FLOW ANALYSIS According to the Physical Plant Department, the chillers are maxed out on capacity during peak flow conditions. The individual building loads were reverse calculated knowing the capacity of the chiller manifold and using adjusted standard cooling load densities relative to each building type. The combination of this data set along with the known averaged campus delta T of 12°F allows procuring of the flow information to effectively evaluate system as it currently exists.

GLHN Architects & Engineers, Inc. Chilled Water System New Mexico State University Not For Construction 0874.00 Utility Development Plan June 16, 2009 Stage Two Report
In order to best procure a comprehensive flow model of the NMSU chilled water distribution system, a software package known as Pipe-FLO has been utilized to simulate existing campus peak flow conditions. It should be noted that this model is a best representation of the campus chilled water system and should not be considered an absolute representation. In order to fill in gaps between available data sets, assumptions have been made to determine individual building cooling densities according to function. It should also be noted that for the purposes of evaluating the distribution system, the pumping arrangement of the model does not include individual building pumps, and it is assumed that, in general, these tertiary pumps pick up nearly all of the head loss through individual building piping systems and are sized to do just that. It should also be understood that as individual building improvements are made in the near future, the delta T for each building may increase or decrease depending on the specific cooling issues relative to that building, whether it is a three way valve system with constant speed pumping and mixing or a situation in which pipes are clogged and restricting proper flow through heat transfer coils. It is for this reason, in addition to the knowledge that projects are currently in planning and operation to optimize the heat transfer systems in delinquent buildings, that in analyzing flow in consideration for expansion, or rather a future state of the system, all building temperature differentials are brought to an average number of 12°F for the purposes of this study. Before examination of the flow model, there are a few configurations that should be noted. There is a separate 14” line leaving the east side of the plant that serves the new science hall and the Zuhl Library with a connection to the main distribution network at the Branson Hall Library and Hershel Zohn Theatre area. This connection is shown as normally closed in this model, corresponding to operator observation at the Physical Plant Department. There is another connection shown as normally closed between Breland Hall and Milton Hall, also according to operator observation. It should also be observed that the existing tunnel connection at the Chamisa Village is unorthodox in that it pulls supply water from the tunnel return line and returns it to the same line. This ultimately means that there is no supply demand for the Chamisa Village in terms of flow. It is assumed this sort of connection was implemented with oversized fan coils and sub-par cooling capacity and ventilation in order to make an addition to a system believed to already be at capacity. Head loss through the existing system is calculated in the existing flow model and shown to be estimated at 136’ for a delivery of 13,093.5 gpm. This is an estimated figure and does not take into account the open atmosphere thermal storage facility or building tertiary pumps. It is, however, a relatively accurate estimation of the energy lost in delivering and returning chilled water up to the building level. In order to plan for expansion it is crucial to understand distributional pipe capacity, which can be indicated in a comprehensive flow model by showing flow velocities. It is apparent in looking at this velocity gradient that there are very high velocities in and around the central plant area, indicating that the roots of the distribution network have become too small to sufficiently support flow to the extents of the system. It can also be seen that the system is approaching unacceptable velocities just to the north of the plant

GLHN Architects & Engineers, Inc. Chilled Water System New Mexico State University Not For Construction 0874.00 Utility Development Plan June 16, 2009 Stage Two Report
and extending east though the Pan Am Tunnel. It is also evident that velocities are approaching unacceptable levels in the Sweet Tunnel due south from the plant. The most noticeable high flow velocity is within the central plant itself, forcing 13,000 gpm through a 20” main distribution header during times of peak flow for a velocity of over 15 ft/s. With high velocities branching off in every direction from the area of chilled water production, there is the indication that additional loads to the system at any location could push the central plant beyond its capacity for flow distribution not only in terms of pumping capacity, but in relation to flow capacity in the existing pipeline network. In calculating existing peak flow values, it was discovered that the central plant’s capacity for chilled water production and distribution did not match the recommended cooling densities in this climatic zone for the buildings on the system. It is currently estimated the central utility plant is capable of providing only 2/3 of the ideal refrigeration to campus during times of peak conditions. Discussions with NMSU facilities staff indicate that during peak conditions, the central plant does in fact have problems with successful delivery of chilled water to every building on campus. During peak flow the central plant and facilities personnel have devised ways of rerouting flow from the plant and around campus by changing valve positions, sometimes hourly, according to what buildings have reported unacceptable service. It is also believed that in order to best condition buildings on campus with consideration to the low chilled water production capacity, many of the campus buildings are receiving less than adequate ventilation air in order to significantly cut down on load. Aside from the issues of chilled water production, distribution capacity has been found to be limited on a similar scale. As the distribution pumping scheme exists, there is no defined distribution header where flow can gather before it is separated off appropriately in different directions to campus. Rather, the distribution pumps are scattered throughout the plant and route all flow to the east side of the building for campus distribution. There does exist a length of pipe routing some pressurized flow from the east to the west side of the plant in order to serve buildings to the north and west of the plant, however, in the flow model this line becomes restricted in capacity during peak flow periods, making for significant head loss in the system and reducing the plant’s capacity to deliver chilled water to this set of buildings. At times this issue becomes so intense that one chiller is routed away from the secondary distribution pumps and delivers as best it can to the distribution system with only pressurization from its dedicated primary pump, according to central plant staff. Outside of the plant there are significant restrictions to flow delivery in all directions in the distribution system with the heaviest restrictions to the north and northeast areas of campus. In addition to the questionable physical nature of the distribution pumping system, sheer pumping capacity alone seems to fall short of the ideal. There have been reports by central plant staff that often during the hotter months of the year, isolation valves in the plant and around the distribution area are constantly being manipulated in order to maintain adequate delivery pressure to buildings at the extents of the system. This is an indication of an undersized pumping array and is just as important to consider as chilled water production when making additions to the campus. There is currently no redundancy

GLHN Architects & Engineers, Inc. Chilled Water System New Mexico State University Not For Construction 0874.00 Utility Development Plan June 16, 2009 Stage Two Report
in either chilled water production or distribution capacities, leaving no contingency for equipment failure or opportunities for expanding the system. CHILLED WATER SYSTEM STRATEGIES FOR CAMPUS EXPANSION New Mexico State University has developed an architectural master plan to aid in facilitating structured campus growth in five year phases out through the year 2034. A chilled water system development plan is a crucial counterpart of this equation. Not only are there significant deficiencies with the existing system, but it will need to change in configuration as well to match the progressing architectural build out of the main campus. As noted above, the current chilled water system is vastly undersized for the area of service which means that not only will the system need to expand for the growth of the campus, it will need to immediately expand to begin to appropriately satisfy the chilled water demand for space cooling. Likewise, immediate expansion is a necessity before consideration of adding any building to the load. SYSTEM EXPANSION FOR GROWTH OF CAMPUS Following are brief descriptions of changes to the chilled system through the set phases of campus development. Cost estimates are also provided with inflation factored in. Cost estimates for distributional piping are not included here and can be referenced in the Utility Tunnel System report. For phased distributional piping improvements, see the phased set of utility layout drawings in the back of this section. Phase 1 – 2014 Accounting for not only the current deficiency in production capacity but also the growth of the campus in the first phase, the chilled water peak load increases from 6,600 tons to about 12,500 tons. This is an extreme increase in the system and according to the net present value analyses described below, warrants the addition of a secondary utility plant to connect to the main system. This utility plant can be built having the capability for modular expansion. In other words, not only can chillers be installed only as they become necessary, but the plant can be continuously built up from its base building in a modular fashion as the additional chillers are required. This option reduces the first cost of building the facility greatly as it only needs to be built up to hold the present capacity of equipment. Also as discussed below in the net present value analysis is the attractiveness of adding an ice storage facility to the secondary utility plant. This item is therefore included in the costs for the first phase of development. The last major item included in the first phase is the re-piping and re-sizing of the existing plant chilled water headers. The headers are undersized to a point of constricting flow to campus, increasing the cost of moving chilled water and need to be reconfigured in such a manner so that manual intervention by means of valve repositioning is not required in order to provide appropriate flow to all corners of the campus. In summation, the suggested additions include two 1030 ton double effect absorbers and peripherals, two 2000 ton electric chillers and peripherals, one 1000 ton glycol chiller and peripherals, 43 ice storage tanks, the base building for a secondary utility plant, and the re-piping of the existing plant

GLHN Architects & Engineers, Inc. Chilled Water System New Mexico State University Not For Construction 0874.00 Utility Development Plan June 16, 2009 Stage Two Report
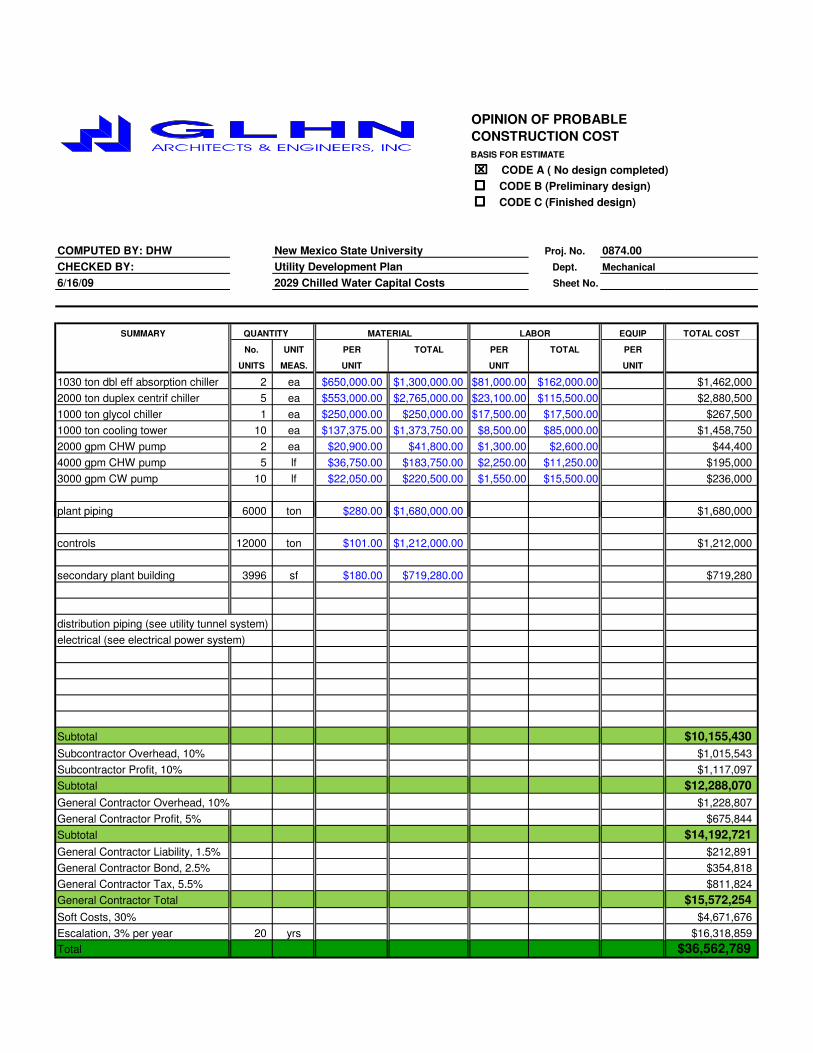
chilled water headers. The combination of these items will be able to meet the foreseen campus peak load while boasting an n+1 redundancy in production and results in a first phase cost of roughly $18,350,000. Additionally, the Arts Complex Ph I, the Bookstore, and Chamisa Ph II are all buildings planned for construction within the next two years. This will possibly not be enough time to expand the current chilled water system to match growth and will need contingency plans to address their chilled water needs. It is recommended that the buildings be outfitted with chilled water distribution systems and temporarily connected to outdoor pad-mounted air cooled reciprocating chillers as standalone systems until the chilled water distribution system is prepared to take on additional load. At this time the main building connections can be disconnected from the air cooled chillers and connected up to the campus chilled water system. The air cooled chillers can then be stored to be used in the future for similar incidents. Cost estimates for outfitting these systems for each of these buildings are included in this report. Phase 2 – 2019 The second phase of development encompasses further growth of the chilled water system and creates an additional peak load of over 2,500 tons. Additions to the system production capacity include one 2000 ton electric chiller and peripherals and results in a second phase cost of roughly $4,519,697. Phase 3 – 2024 This phase of growth harvests an additional peak load of over 3,000 tons and warrants the addition of two 2000 ton electric chillers with peripherals. Estimates for this phase come out to roughly $10,479,000. Phase 4 – 2029 Phase 4 continues the addition of buildings warranting chilled water service and creates an additional peak load of nearly 4,000 tons. The addition of four 2000 ton electric chillers and peripherals will be necessary for this phase and results in costs totaling roughly $17,223,000. Phase 5 – 2034 The final phase of development creates an additional peak chilled water load of nearly 5,500 tons and is mostly on the southern tip of the built out distribution system. At this point in time, should the campus grow according to plan, it may be feasible to create a tertiary chilled water facility in this vicinity and connect it to the main system. Either way, it will be necessary to replace some of the equipment installed in the first phase, as their useful lives will have run their course, and install some new equipment to keep up with the additive loads. In all, this phase will add two 1030 ton absorbers, five 2000 ton electric chillers, one 1000 ton glycol chiller and all the peripherals to match. In all, estimates for this phase come to roughly $36,563,000.

GLHN Architects & Engineers, Inc. Chilled Water System New Mexico State University Not For Construction 0874.00 Utility Development Plan June 16, 2009 Stage Two Report
NET PRESENT VALUE ANALYSIS As mentioned in the Cogeneration System section of this report, the cogeneration model has been outfitted to analyze multiple optional equipment configurations, including the options for ice storage and the comparison between adding two absorbers to the HRSG steam output versus one absorber and one steam driven turbine. Most importantly, the cogeneration model has been outfitted with the capability of projecting system dynamics with respect to the phased build out of the campus. In other words, estimates for the cost of energy consumption in the forms of natural gas and electricity have been generated and used in conjunction with estimates for capital investments in equipment to produce estimates for net present values of the entire 25 year investment as well as leveled annual costs should this be looked at from a “borrowing” perspective. For each run of the net present value analysis, equipment additions have been tailor made to suit each individual scenario. There are a total of 8 scenarios, creating every permutation of the 3 general options. Secondary Utility Plant The first option is to either begin construction of a new utility plant or to tear down and rebuild part of the existing plant. Even if the existing plant were rebuilt there would still be a need for a secondary utility plant, but construction of the new plant could be delayed until about 2019. Plausible locations for the secondary plant include the parking lot immediately east of the Health and Social Services Building, the parking lot just south of the Corbett Center, and the northwest corner of the intramural fields just south of the Activity Center. Since there is an immediate need for improved flow to the northern section of campus and since many of the parking lots around the Corbett Center are already scheduled for demolition, the parking lot immediately east of Health and Social Services and west of the proposed Jordan Parking Garage became a prime candidate. In general, the net present value analysis yielded higher overall costs if the existing plant is rebuilt versus constructing a new facility immediately. Not only does cost analysis indicate near term construction of a secondary facility to be most feasible, but there are many complications to rebuilding an existing facility, especially considering that total shutdown of any branch of equipment is unacceptable, as the campus is constantly requiring these utilities. A preliminary drawing set of a conceptual secondary utility plant are included in this report. Ice Storage System An ice storage option for the chilled water system can be an extremely attractive investment, especially working in conjunction with a demand based electrical rate. Ice storage allows for a dedicated glycol chiller to operate at night during off-peak hours to create chilled water potential via the creation of ice. During the daytime, the glycol loop, connected to the main chilled water system by means of a heat exchanger, is able to extract heat from the chilled water system and use it to melt the ice in the storage tanks, creating “free cooling” during times of more expensive consumption and cutting the

GLHN Architects & Engineers, Inc. Chilled Water System New Mexico State University Not For Construction 0874.00 Utility Development Plan June 16, 2009 Stage Two Report
electrical demand charges by reducing the amount of energy consumption during peak energy hours. A preliminary system is sized to meet the needs of the first phase of growth and includes one 1000 ton glycol chiller working in conjunction with 43 ice storage tanks for a total possible discharge of 5000 tons and a total daily storage capacity of about 14,000 ton-hours. Should this option be considered, further optimization of the system size should be performed in order to maximize savings. In the 8 alternate net present value runs, the ice storage option consistently yielded lower overall expenditures versus excluding it from the chilled water system expansion. In addition to the obvious setbacks of attempting a rebuild of the existing utility plant, there would not be the appropriate spatial requirements to add ice storage to the existing plant and the campus would not be able to reap the benefits of such a facility until construction of the secondary utility plant. Dual Double Effect Absorbers vs. Single Effect Absorber w/ Steam Turbine The heat recovery steam generator outputs a peak load of roughly 22,000 lbs/hr of 100 psi steam. Currently this steam can be sent to campus for space heating in winter months or routed to one of two absorption chillers to create chilled water in summer months. The existing absorbers are significantly de-rated and are in constant need of maintenance. Since these machines are candidates for replacement, the question remains as to what will be most effective replacement in terms of energy usage and economy. Two options have been considered an analyzed. One is to replace them in kind with two new and efficient absorption chillers. The alternate option is to stage a steam turbine and a single stage absorber in series. In this configuration, during the summer months, the steam turbine would take in steam at 100 psi and generate 275 kW of electricity while outputting 15 psi steam to the single effect absorber for the production of chilled water. Either of these two options will effect in a reduction of on-peak electrical consumption and will help to lower overall demand charges by reducing consumption during peaking hours of the day. According to the net present value analysis, each isolated comparison of these two options came out significantly close to one another. Were they to be completely even, it may be beneficial to lean towards the two absorbers versus the absorber and steam turbine due to the increased complexity of the latter system. Overall, the comparison between all 8 scenarios yields 2 closely matched candidates. The least costly scenario was the result from scenario number 3 and consisted of immediate construction of a new utility plant, the inclusion of an ice storage facility, and the addition of two new double effect absorption chillers. This scenario ran a 25 year net present value of roughly $205,123,000 with a leveled annual cost of $11,441,000 and an annual savings from the worst case scenario of $933,000. The close second was scenario number 4, differing from 3 only by the inclusion of a single effect absorber and steam turbine rather than two double effect absorbers. This scenario came in with a 25 year net present value of roughly $206,577,000 with a leveled annual cost of $11,522,000 and an annual savings of $852,000. The next best scenario resulted in a net present value of $214,784,000. The worst case was scenario number 6, consisting of renovation of the existing plant, no ice storage, and the use of a single effect absorber in conjunction with a steam driven turbine. This scenario resulted in a 25 year net present value of $221,844,000 with a leveled annual cost of $12,374,000.

GLHN Architects & Engineers, Inc. Chilled Water System New Mexico State University Not For Construction 0874.00 Utility Development Plan June 16, 2009 Stage Two Report
STAGE 1 PRODUCTION DEFICIENCIES Deficiencies on the production side of the chilled water system have been addressed along with expansion of the system for the growth of the campus. STAGE 1 DISTRIBUTION DEFICIENCIES Undersized Pipe Sizes in and Around the Central Utility Plant During an in depth flow analysis it became evident that the chilled water line sizes in and around the central plant area are nearly too small for acceptable flow velocities and that the main distribution header is significantly smaller than ideal, forcing a peak flow of over 15 ft/s. Were the pumping manifold sufficient to successfully deliver flow during peak demand, this would only be an indication of unnecessary energy loss through friction in the pipe, but in consideration of campus and chilled water distribution expansion, the current pipe sizes and configurations in and around the central plant could pose some serious problems in successfully delivering service to all areas of campus. The re-piping of the chilled water plant header has been addressed in expansion for growth and the line sizes around the area of the existing utility plant will grow in capacity once a secondary plant is installed, alleviating the need for the current plant to push chilled water out to every extent of campus. Distribution Pumping Arrangement Another deficiency noted here, common to many existing chilled water systems, is the overall primary-secondary-tertiary pumping arrangement on campus. Were the system constructed brand new today, it would be recommended to use what is known as a direct primary scheme in which there would be only one set of pumps able to output variable flow to campus and sized to take on the entire head loss from the chiller array to the top of the tallest and farthest building and back. The existing arrangement is a cause for some significant energy loss through constant pumping and 3-way valve arrangements, moving an unnecessary amount of flow. The University is currently investing in a program to retrofit existing buildings with a 2-way valve arrangement, alleviating the need for tertiary pumps. This action will ultimately result in significant energy savings in system pumping. Cool Pool Pumping Arrangement Another notable deficiency that had been addressed in a previous study by GLHN is the fact that the thermal energy storage facility is not only open to atmosphere but open to the campus distribution system as well. This means that in order to keep the “cool pool” from overflowing, system pressure has to be killed off in the return chilled water supply. This in turn means that to successfully pump flow back out to campus, the secondary pumping manifold has to take the flow from almost atmospheric pressure back up to 60 or 70 psi, resulting in significant excess energy costs. It should also be noted that the depth of the cool pool is quite shallow and does not allow for appropriate stratification of the varying temperatures between the top and bottom levels. It is recommended that previously submitted materials by GLHN be reviewed and considered in order to generate additional distributional pumping savings

GLHN Architects & Engineers, Inc. Chilled Water System New Mexico State University Not For Construction 0874.00 Utility Development Plan June 16, 2009 Stage Two Report
Campus Delta T The current 12°F delta T across campus is an acceptable temperature gradient. However, it is not infeasible to obtain a delta T on the order of 16°F for a campus such as this by means of eliminating 3-way valves and constant speed pumps. This issue is addressed above in the distributional pumping arrangement. Absorption Chillers This deficiency is addressed in the planning for campus growth and includes replacement of the existing machines. EMCS It has been observed that the existing data monitoring system for the chilled water system is grossly undersized and fails to capture a comprehensive view of the operation of the distribution system. Not only does the existing system have holes in data capture, processing and storing, there are many buildings that have incomplete monitoring capabilities as currently configured. This deficiency has already been picked up by the University and is currently being improved upon by a dedicated team of personnel.
GLHN Architects & Engineers, Inc. Chilled Water System New Mexico State University Not For Construction 0874.00 Utility Development Plan June 16, 2009 Stage Two Report
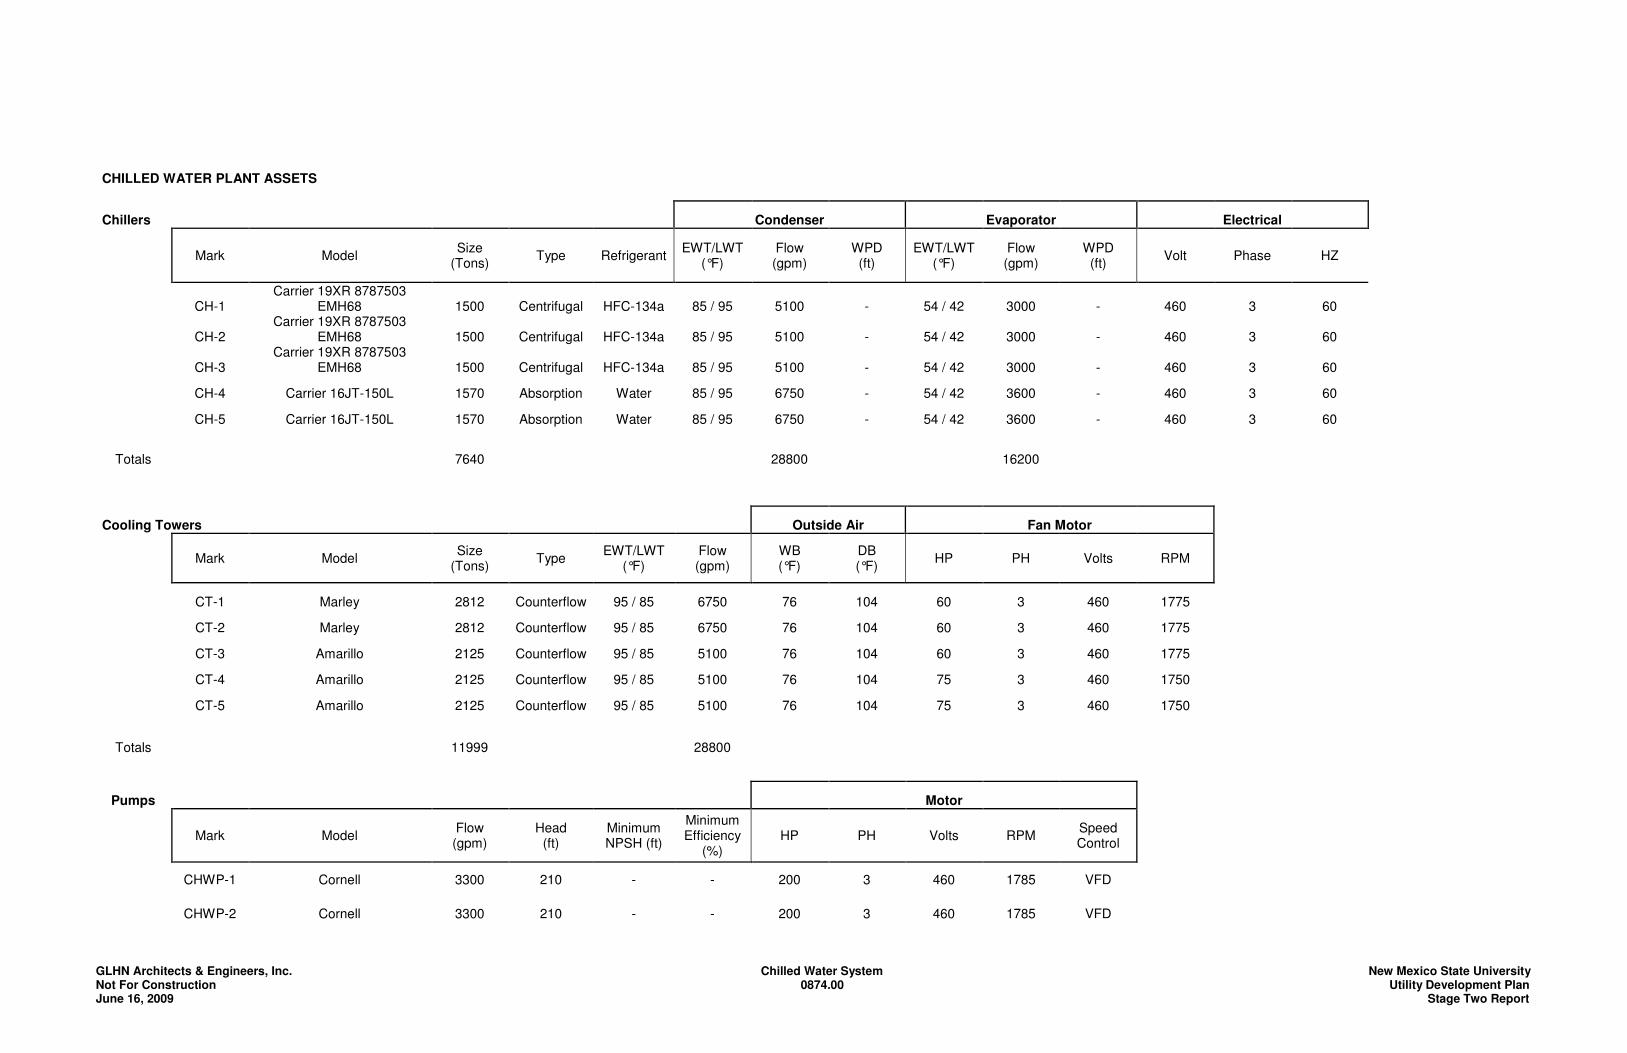
CHILLED WATER PLANT ASSETS
Chillers
Condenser Evaporator Electrical
Mark Model Size (Tons) Type Refrigerant EWT/LWT
(°F) Flow (gpm)
WPD (ft)
EWT/LWT (°F)
Flow (gpm)
WPD (ft) Volt Phase HZ
CH-1 Carrier 19XR 8787503
EMH68 1500 Centrifugal HFC-134a 85 / 95 5100 - 54 / 42 3000 - 460 3 60
CH-2 Carrier 19XR 8787503
EMH68 1500 Centrifugal HFC-134a 85 / 95 5100 - 54 / 42 3000 - 460 3 60
CH-3 Carrier 19XR 8787503
EMH68 1500 Centrifugal HFC-134a 85 / 95 5100 - 54 / 42 3000 - 460 3 60
CH-4 Carrier 16JT-150L 1570 Absorption Water 85 / 95 6750 - 54 / 42 3600 - 460 3 60
CH-5 Carrier 16JT-150L 1570 Absorption Water 85 / 95 6750 - 54 / 42 3600 - 460 3 60
Totals 7640 28800 16200
Cooling Towers Outside Air Fan Motor
Mark Model Size (Tons) Type EWT/LWT
(°F) Flow (gpm)
WB (°F)
DB (°F) HP PH Volts RPM
CT-1 Marley 2812 Counterflow 95 / 85 6750 76 104 60 3 460 1775
CT-2 Marley 2812 Counterflow 95 / 85 6750 76 104 60 3 460 1775
CT-3 Amarillo 2125 Counterflow 95 / 85 5100 76 104 60 3 460 1775
CT-4 Amarillo 2125 Counterflow 95 / 85 5100 76 104 75 3 460 1750
CT-5 Amarillo 2125 Counterflow 95 / 85 5100 76 104 75 3 460 1750
Totals 11999 28800
Pumps Motor
Mark Model Flow (gpm)
Head (ft)
Minimum NPSH (ft)
Minimum Efficiency
(%) HP PH Volts RPM Speed
Control
CHWP-1 Cornell 3300 210 - - 200 3 460 1785 VFD
CHWP-2 Cornell 3300 210 - - 200 3 460 1785 VFD

GLHN Architects & Engineers, Inc. Chilled Water System New Mexico State University Not For Construction 0874.00 Utility Development Plan June 16, 2009 Stage Two Report
CHWP-3 Cornell 3300 210 - - 200 3 460 1785 VFD
CHWP-4 Cornell 3300 210 - - 200 3 460 1785 VFD
Totals 13200
Charg-1 Cornell 4000 80 - - 125 3 460 1800 VFD
Charg-2 Cornell 4000 80 - - 125 3 460 1800 VFD
Totals 8000
- -
CHP-1 Aurora 3100 95 - - 100 3 460 1750 Constant
CHP-2 Aurora 3100 95 - - 100 3 460 1750 Constant
CHP-3 Aurora 3100 95 - - 100 3 460 1750 Constant
Totals 9300
CHP-4 Aurora 3600 150 - - 200 3 460 1750 Constant
CHP-5 Aurora 3600 150 - - 200 3 460 1750 Constant
Totals 7200
CWP-1 Aurora 5100 65 - - 100 3 460 1188 Constant
CWP-2 Aurora 5100 65 - - 100 3 460 1188 Constant
CWP-3 Aurora 5100 65 - - 100 3 460 1188 Constant
CWP-4 Aurora 6750 95 - - 200 3 460 1188 Constant
CWP-5 Aurora 6750 95 - - 200 3 460 1150 Constant
Totals 28800

Official_Building_Master_List
Current Future
New Mexico State University Lab (SF/Ton) 507 300
Utility Development Plan Acad (SF/Ton) 592 350
2009 Housing (SF/Ton) 761 450
Chilled Water Distribution System Admin (SF/Ton) 592 350
GSF Tons GPM GSF Tons GPM GSF Tons GPM GSF Tons GPM GSF Tons GPM GSF Tons GPM
EXISTING BUILDINGS
225 Astronomy Building 1959 1320 Frenger Mall ACAD - LAB 15,486 31 61 15,486 52 103 15,486 52 103 15,486 52 103 15,486 52 103 15,486 52 103 7
278 Branson Library 1951 1305 Frenger Mall ACAD 159,696 270 540 159,696 456 913 159,696 456 913 159,696 456 913 159,696 456 913 159,696 456 913 6
184 Breland Hall 1954 1525 Stewart St. ACAD - LAB 95,313 188 376 95,313 318 635 95,313 318 635 31,771 106 212 31,771 106 212 31,771 106 212 7
386 Business Complex Building 1983 1320 University Ave. ACAD - CLASSROOM 54,992 93 186 54,992 157 314 54,992 157 314 54,992 157 314 54,992 157 314 54,992 157 314 3
605 Chamisa Village 2006 1725 Stewart Street HOUSING 114,056 150 300 114,056 253 507 114,056 253 507 114,056 253 507 114,056 253 507 114,056 253 507 7
187 Chemistry Building 1957 1175 North Horseshoe ACAD - LAB 115,878 229 457 115,878 386 773 115,878 386 773 115,878 386 773 115,878 386 773 115,878 386 773 2
364 Clara Belle Williams Hall 1981 1395 International Mall ACAD 24,671 42 83 24,671 70 141 24,671 70 141 24,671 70 141 24,671 70 141 24,671 70 141 3
126 Computer Center 1966 1275 Stewart St. ACAD - LAB 40,288 79 159 40,288 134 269 40,288 134 269 40,288 134 269 40,288 134 269 40,288 134 269 6
285 Corbett Center 1968 1600 International Mall AUX 213,313 361 721 213,313 609 1,219 213,313 609 1,219 213,313 609 1,219 213,313 609 1,219 213,313 609 1,219 3
60 Dan W. Williams Hall 1938 1390 E. University Ave. ACAD - LAB 36,857 73 145 36,857 123 246 0 0 0 0 0 0 0 0 0 0 0 0 3
60A Dan W. Williams Hall Annex 1984 1390 E. University Ave. ACAD - LAB 11,926 24 47 11,926 40 80 0 0 0 0 0 0 0 0 0 0 0 0 3
56 Dove Hall 1936 1305 North Horseshoe ADMIN 13,476 23 46 13,476 39 77 13,476 39 77 13,476 39 77 13,476 39 77 13,476 39 77 2
541 Ed and Harold Foreman Engineering Complex 1997 1060 Frenger Mall ACAD - LAB 84,526 167 333 84,526 282 564 84,526 282 564 84,526 282 564 84,526 282 564 84,526 282 564 6
338 Educational Services Center 1978 1780 East University Ave. ADMIN 50,366 85 170 50,366 144 288 50,366 144 288 50,366 144 288 50,366 144 288 50,366 144 288 4
363 Engineering Complex I 1980 1025 Stewart St. ACAD - LAB 55,585 110 219 55,585 185 371 55,585 185 371 55,585 185 371 55,585 185 371 55,585 185 371 6
34 Foster Hall 1930 1200 S. Horseshoe ACAD - LAB 98,084 193 387 98,084 327 654 98,084 327 654 98,084 327 654 98,084 327 654 98,084 327 654 6
154 Garcia Annex 1949 3024 Locust St. ADMIN 28,895 49 98 28,895 83 165 28,895 83 165 28,895 83 165 28,895 83 165 28,895 83 165 7
275 Garcia Residence Hall 1968 1715 International Mall HOUSING 208,371 274 548 208,371 463 926 208,371 463 926 208,371 463 926 208,371 463 926 208,371 463 926 3
188 Gardiner Hall 1957 1255 North Horseshoe ACAD - LAB 63,224 125 249 63,224 211 421 63,224 211 421 63,224 211 421 63,224 211 421 63,224 211 421 2
244 Gerald Thomas Hall 1963 940 College Dr. ACAD - LAB 139,950 276 552 139,950 467 933 139,950 467 933 139,950 467 933 139,950 467 933 139,950 467 933 2
10 Goddard Hall 1913 1100 South Horseshoe ACAD - LAB 31,942 63 126 31,942 106 213 31,942 106 213 31,942 106 213 31,942 106 213 31,942 106 213 2
288 Guthrie Hall 1968 1325 International Mall ACAD - CLASSROOM 41,531 70 140 41,531 119 237 41,531 119 237 41,531 119 237 41,531 119 237 41,531 119 237 3
172 Hadley Hall 1953 2855 Weddell St. ADMIN 38,199 65 129 38,199 109 218 38,199 109 218 38,199 109 218 38,199 109 218 38,199 109 218 2
323 Hardman Hall 1974 2902 McFie Circle ACAD - CLASSROOM 30,370 51 103 0 0 0 0 0 0 0 0 0 0 0 0 0 0 0 3
590 Health and Social Services Building 2003 1335 International Mall ACAD - CLASSROOM 64,663 109 219 64,663 185 370 64,663 185 370 64,663 185 370 64,663 185 370 64,663 185 370 3
249 Herschell Zohn Theatre 1963 3014 McFie Circle ACAD - CLASSROOM 23,572 40 80 0 0 0 0 0 0 0 0 0 0 0 0 0 0 0 7
250 Jacobs Hall 1963 2908 McFie Circle ACAD - LAB 22,433 44 88 0 0 0 0 0 0 0 0 0 0 0 0 0 0 0 3
321 James B. Delamater Activity Center 1973 1600 Stewart St. ACAD - GYMNASIUM 114,109 193 386 114,109 326 652 114,109 326 652 114,109 326 652 114,109 326 652 114,109 326 652 7
190 Jett Annex 1957 1025 Frenger Mall ACAD - LAB 6,529 13 26 6,529 22 44 6,529 22 44 6,529 22 44 6,529 22 44 6,529 22 44 6
189 Jett Hall 1956 1040 South Horseshoe ACAD - LAB 84,091 166 332 84,091 280 561 84,091 280 561 84,091 280 561 84,091 280 561 84,091 280 561 2
397 John Whitlock Hernandez Hall 1988 3035 S. Espina St. ACAD - LAB 44,107 87 174 44,107 147 294 44,107 147 294 44,107 147 294 44,107 147 294 44,107 147 294 6
33 Kent Hall 1929 1280 E. University Ave. ACAD - CLASSROOM 20,473 35 69 20,473 58 117 20,473 58 117 20,473 58 117 20,473 58 117 20,473 58 117 2
368 Knox Hall 1981 2980 South Espina St. ACAD - LAB 75,737 149 299 75,737 252 505 75,737 252 505 75,737 252 505 75,737 252 505 75,737 252 505 6
83 Milton Hall 1941 2915 McFie Circle ACAD - CLASSROOM 99,311 168 336 99,311 284 567 99,311 284 567 99,311 284 567 99,311 284 567 99,311 284 567 3
260 Monagle Residence Hall 1965 1525 International Mall HOUSING 121,457 160 319 121,457 270 540 0 0 0 0 0 0 0 0 0 0 0 0 3
389 Music Building 1983 1075 North Horseshoe ACAD - CLASSROOM 56,153 95 190 56,153 160 321 56,153 160 321 56,153 160 321 56,153 160 321 56,153 160 321 2
330 New Mexico Dept. of Agriculture 1975 3190 South Espina St. IO 28,288 48 96 28,288 81 162 28,288 81 162 28,288 81 162 28,288 81 162 28,288 81 162 6
287 O'Donnell Hall 1968 1220 Stewart St. ACAD - LAB 93,858 185 370 93,858 313 626 93,858 313 626 93,858 313 626 93,858 313 626 93,858 313 626 6
269 OFS Central Heating Plant 1966 3060 Sweet St. POM 21,071 36 71 21,071 60 120 21,071 60 120 21,071 60 120 21,071 60 120 21,071 60 120 6
284 Pan American Center 1968 1810 E. University Ave. AUX 215,633 365 729 215,633 616 1,232 215,633 616 1,232 215,633 616 1,232 215,633 616 1,232 215,633 616 1,232 4
604 Pinon Hall 2006 1760 E. University HOUSING 97,395 128 256 97,395 216 433 97,395 216 433 97,395 216 433 97,395 216 433 97,395 216 433 3
263 PSL, Clinton P. Anderson Hall 1965 1050 Stewart St. ACAD - LAB 135,847 268 536 135,847 453 906 135,847 453 906 135,847 453 906 135,847 453 906 135,847 453 906 6
248 Regents Row 1962 3034 McFie Circle ADMIN 82,386 139 279 82,386 235 471 82,386 235 471 82,386 235 471 0 0 0 0 0 0 7
185 Rhodes-Garrett-Hamiel Res Hall 1955 2735 Jordan St. HOUSING 18,522 24 49 18,522 41 82 18,522 41 82 18,522 41 82 18,522 41 82 18,522 41 82 3
79 Rhodes-Garrett-Hamiel Res Hall 1941 2715 Jordan St. HOUSING 19,604 26 52 19,604 44 87 19,604 44 87 19,604 44 87 19,604 44 87 19,604 44 87 3
80 Rhodes-Garrett-Hamiel Res Hall 1941 2725 Jordan St. HOUSING 27,709 36 73 27,709 62 123 27,709 62 123 27,709 62 123 27,709 62 123 27,709 62 123 3
391 Science Hall 1987 1290 Frenger Mall ACAD - LAB 114,918 227 453 114,918 383 766 114,918 383 766 114,918 383 766 114,918 383 766 114,918 383 766 6
551 Skeen Hall 1999 945 College Dr. ACAD - LAB 135,896 268 536 135,896 453 906 135,896 453 906 135,896 453 906 135,896 453 906 135,896 453 906 2
365 Speech Building 1981 1405 International Mall ACAD - CLASSROOM 28,322 48 96 28,322 81 162 28,322 81 162 28,322 81 162 28,322 81 162 28,322 81 162 3
261 Student Health Center 1965 3080 Breland Dr. AUX 16,456 28 56 16,456 47 94 16,456 47 94 16,456 47 94 16,456 47 94 16,456 47 94 7
301 Thomas & Brown Hall 1972 1125 Frenger Mall ACAD - LAB 49,711 98 196 49,711 166 331 49,711 166 331 49,711 166 331 49,711 166 331 49,711 166 331 6
276 Walden Hall 1966 1200 Frenger Mall ACAD - LAB 36,259 72 143 36,259 121 242 36,259 121 242 36,259 121 242 36,259 121 242 36,259 121 242 6
35 William B. Conroy Honors Center 1907 2745 South Espina St. ACAD - CLASSROOM 9,505 16 32 9,505 27 54 9,505 27 54 9,505 27 54 9,505 27 54 9,505 27 54 2
585 Wooten Hall 2002 ACAD - LAB 29,600 58 117 29,600 99 197 29,600 99 197 29,600 99 197 29,600 99 197 29,600 99 197 6
32 Young Hall 1928 1300 South Horseshoe ACAD - CLASSROOM 12,713 21 43 12,713 36 73 12,713 36 73 12,713 36 73 12,713 36 73 12,713 36 73 2
461 Zuhl Library 1992 2911 McFie Circle ACAD 95,952 162 324 95,952 274 548 95,952 274 548 95,952 274 548 95,952 274 548 95,952 274 548 7
2014 2019 2024Notes
2029 2034Dwg Area
Bldg. #
Building Name Year Built Address Category2009
Page 1

Official_Building_Master_List
Totals 3,769,275 6,600 13,200 3,692,900 10,925 21,851 3,522,660 10,493 20,986 3,459,118 10,281 20,562 3,376,732 10,046 20,092 3,376,732 10,046 20,092
FIVE-YEAR ADDITIONS
05-01 Arts Complex - Phase 1 2014 - ACAD - CLASSROOM 234,000 669 1,337 234,000 669 1,337 234,000 669 1,337 234,000 669 1,337 234,000 669 1,337 2
05-02 Institute for Public Policy (Domenici Center) 2014 - ACAD - CLASSROOM 55,980 160 320 55,980 160 320 55,980 160 320 55,980 160 320 55,980 160 320 3
05-03 Student Service Facility, Ph. 1 2014 - ADMIN 37,500 107 214 37,500 107 214 37,500 107 214 37,500 107 214 37,500 107 214 3
05-04 Native American Cultural Center 2014 - ACAD - CLASSROOM 26,900 77 154 26,900 77 154 26,900 77 154 26,900 77 154 26,900 77 154 7
05-05 Tech. Lab/Classroom Facility 2014 - ACAD - CLASSROOM/LAB 60,000 200 400 60,000 200 400 60,000 200 400 60,000 200 400 60,000 200 400 3 1
05-08 Bookstore 2014 - AUX 35,000 100 200 35,000 100 200 35,000 100 200 35,000 100 200 35,000 100 200 3
05-09 NMDA Building Renovations and Additions 2014 - IO 60,000 171 343 60,000 171 343 60,000 171 343 60,000 171 343 60,000 171 343 6
05-10 Addition to the Health and Social Services Building 2014 - ACAD - CLASSROOM 7,387 21 42 7,387 21 42 7,387 21 42 7,387 21 42 7,387 21 42 3
05-13 Chamisa Dorms, Ph. 2 2014 - HOUSING 55,628 124 247 55,628 124 247 55,628 124 247 55,628 124 247 55,628 124 247 7 2
Totals 0 0 0 572,395 1,629 3,257 572,395 1,629 3,257 572,395 1,629 3,257 572,395 1,629 3,257 572,395 1,629 3,257
NOTES:
1 following demolition of Hardman Hall (323), Jacobs Hall (250), and the Zohn Theatre (249)
2 SF based on assumption that Ph. 2 will double the size of the facility
TEN-YEAR ADDITIONS
10-01 West Mixed Use/Graduate Housing 2019 - HOUSING 64,800 144 288 64,800 144 288 64,800 144 288 64,800 144 288 3 1
10-02 East Mixed Use/Graduate Housing, Ph. 1 2019 - HOUSING 116,100 258 516 116,100 258 516 116,100 258 516 116,100 258 516 3 1,2
10-03 Student Service Facility, Ph. 2 2019 - ADMIN 37,500 107 214 37,500 107 214 37,500 107 214 37,500 107 214 3 3,4
10-04 New Undergraduate Housing 2019 - HOUSING 56,520 126 251 56,520 126 251 56,520 126 251 56,520 126 251 3 3,5
10-06 New Married Student Housing 2019 - HOUSING 165,660 368 736 165,660 368 736 165,660 368 736 165,660 368 736 7 5
10-07 Student Activities Expansion 2019 - AUX 87,160 249 498 87,160 249 498 87,160 249 498 87,160 249 498 7 6,9
10-08 New Academic Bulidings 2019 - ACAD - CLASSROOM 263,250 752 1,504 263,250 752 1,504 263,250 752 1,504 263,250 752 1,504 6 1,7
10-14 Jordan Street Gateway 2019 - AUX/Housing 190,000 422 844 190,000 422 844 190,000 422 844 190,000 422 844 3 8
10-16 Arts Complex - Phase II (Visual Arts) 2019 - ACAD - CLASSROOM 71,500 204 409 71,500 204 409 71,500 204 409 71,500 204 409 2
Totals 0 0 0 0 0 0 1,052,490 2,631 5,261 1,052,490 2,631 5,261 1,052,490 2,631 5,261 1,052,490 2,631 5,261
NOTES:
1 SF based on building footprint for three stories
2 following demolition of Delta Zeta and Zeta Tau Alpha sorority houses (213, 163)
3 following demolition of Monagle Hall (260)
4 SF based on assumption that Ph. 2 will double the size of the facility
5 SF based on footprint for three stories
6 following demolition of Rentfrow Gymnasium (211)7
8 following demolition of D.W. Williams Hall and Annex (60, 60A)
9 SF based on building footprint for single story
FIFTEEN-YEAR ADDITIONS15-01 East Mixed Use/Graduate Housing, Ph. 2 2024 - HOUSING 117,720 262 523 117,720 262 523 117,720 262 523 3 1,2
15-02 Zuhl Library Expansion 2024 - ACAD 110,850 317 633 110,850 317 633 110,850 317 633 7 1,3
15-03 Academic/Lab Building 2024 - ACAD - LAB 26,220 87 175 26,220 87 175 26,220 87 175 6 1
15-04 Academic Building 2024 - ACAD - CLASSROOM 117,600 336 672 117,600 336 672 117,600 336 672 7 1
15-05 Academic/Lab Building 2024 - ACAD - LAB 218,190 727 1,455 218,190 727 1,455 218,190 727 1,455 6 1,4
15-06 Research/Lab Building 2024 - ACAD - LAB 233,250 778 1,555 233,250 778 1,555 233,250 778 1,555 6 1,5
15-07 Academic Lab Building 2024 - ACAD - LAB 90,930 303 606 90,930 303 606 90,930 303 606 7 1
15-14 O'Donnell Hall - Phase II 2024 - ACAD - CLASSROOM 35,000 100 200 35,000 100 200 35,000 100 200 6
15-15 Arts Complex - Phase III (Performance Hall) 2024 - ACAD - CLASSROOM 76,500 219 437 76,500 219 437 76,500 219 437 2
Totals 0 0 0 0 0 0 0 0 0 1,026,260 3,128 6,256 1,026,260 3,128 6,256 1,026,260 3,128 6,256
NOTES:
1 SF based on building footprint for three stories
2 following demolition of Chi Omega sorority houses (268)
3 following demolition of Breland Hall Addition (north part of 184)
4 following demolition of Bull Barn (193), Heardsmen Residence (199), Stucky Hall (282), Animal Husbandry (290), and the Feeding Research Building (303)
5 following demolition of PSL West Shop (280), Guardhouse (281), Machine Shop (216), Rocket Shop (243) and East Shop (279)6
7 SF based on building footprint for two stories
TWENTY-YEAR ADDITIONS20-01 Academic/Lab Building 2029 - ACAD - LAB 118,260 394 788 118,260 394 788 7 1,2
20-02 Academic/Research Building 2029 - ACAD - CLASSROOM 686,350 1,961 3,922 686,350 1,961 3,922 6 3,4
20-03 Academic/Research Building 2029 - ACAD - CLASSROOM 273,440 781 1,563 273,440 781 1,563 7 3,5
following demolition of East and West Greek Complexes (271, 272, 273, 274, 414), Wells Hall (355), Cosmic Ray Lab (398), Theatre Scene Shop (385), Housing Warehouse (467), Ag Service Storage (316) and Flammable Storage (320), SF based on building footprint for two stories
following demolition of Animal Science (376, 241, 198), Tejada Extension Annex (245), Animal Husbandry Barn (162), Sheep Barns (194), Cattle Feed Barn (240), Small Animal Lab (246), Livestock Judging Pavillion (195) and Neale Hall (164)
Page 2

Official_Building_Master_List
20-04 Family Housing, Ph. 2 2029 - HOUSING 255,064 567 1,134 255,064 567 1,134 7 3
20-08 Arts Complex - Phase IV (Music, Dance, CMI) 2029 - ACAD -CLASSROOM 36,000 103 206 36,000 103 206 2
Totals 0 0 0 0 0 0 0 0 0 0 0 0 1,369,114 3,806 7,612 1,369,114 3,806 7,612
NOTES:
1 SF based on building footprint for three stories
2 following demolition of Regent's Row Dorms (248)
3 SF based on building footprint for two stories
4 following demolition of Sutherland Village (206)
5 following demolition of Tombaugh Observatory (317, 318, 319) and PE Restroom (314)
BEYOND TWENTY-YEAR ADDITIONS25-01 Academic/Research Buildings 2034 - ACAD - CLASSROOMS 864,366 2,470 4,939 9 1,4
25-02 Academic/Research Buildings 2034 - ACAD - CLASSROOMS 439,110 1,255 2,509 10 2,4
25-03 Academic/Research Buildings 2034 - ACAD - CLASSROOMS 338,655 968 1,935 10 3,4
25-04 Arts Complex - Phase V 2034 - ACAD - CLASSROOMS 251,388 718 1,437 2 4
Totals 0 0 0 0 0 0 0 0 0 0 0 0 0 0 0 1,893,519 5,410 10,820
NOTES:
1 following demolition of Tom Fort Village and Cole Village
2 following demolition of Cervantes Housing
3 following demolition of Genesis Center (394, 395) and Academic Research Center ( 412)
4 SF based on building footprint for three stories
OVERALL TOTALS: 3,769,275 6,600 13,200 4,265,295 12,554 25,108 5,147,545 14,752 29,504 6,110,263 17,669 35,337 7,396,991 21,239 42,479 9,290,510 26,649 53,299
POM - Productions and Operations Management
IO - Independent Operation
AUX - Auxiliary
Page 3

OPINION OF PROBABLECONSTRUCTION COSTBASIS FOR ESTIMATE
��������CODE A ( No design completed)� �� �� �� �CODE B (Preliminary design)� �� �� �� �CODE C (Finished design)
COMPUTED BY: DHW New Mexico State University Proj. No. 0874.00 CHECKED BY: Utility Development Plan Dept. Mechanical
6/16/09 2009 Chilled Water Capital Costs Sheet No.
SUMMARY QUANTITY MATERIAL LABOR EQUIP TOTAL COST
No. UNIT PER TOTAL PER TOTAL PER
UNITS MEAS. UNIT UNIT UNIT
1030 ton dbl eff absorption chiller 2 ea $650,000.00 $1,300,000.00 $81,000.00 $162,000.00 $1,462,0002000 ton duplex centrif chiller 2 ea $553,000.00 $1,106,000.00 $23,100.00 $46,200.00 $1,152,2001000 ton glycol chiller 1 ea $250,000.00 $250,000.00 $17,500.00 $17,500.00 $267,500ice storage tanks 43 ea $14,500.00 $623,500.00 $500.00 $21,500.00 $645,0001000 ton cooling tower 4 ea $137,375.00 $549,500.00 $8,500.00 $34,000.00 $583,5002000 gpm CHW pump 2 ea $20,900.00 $41,800.00 $1,300.00 $2,600.00 $44,4004000 gpm CHW pump 2 lf $36,750.00 $73,500.00 $2,250.00 $4,500.00 $78,0003000 gpm CW pump 4 lf $22,050.00 $88,200.00 $1,550.00 $6,200.00 $94,400
plant piping 10000 ton $280.00 $2,800,000.00 $2,800,000repipe existing plant headers 1 ea $500,000.00 $500,000.00 $500,000
controls 6000 ton $101.00 $606,000.00 $606,000
secondary plant building 5402 sf $180.00 $972,360.00 $972,360
distribution piping (see utility tunnel system)electrical (see electrical power system)
Subtotal $9,205,360Subcontractor Overhead, 10% $920,536Subcontractor Profit, 10% $1,012,590Subtotal $11,138,486General Contractor Overhead, 10% $1,113,849General Contractor Profit, 5% $612,617Subtotal $12,864,951General Contractor Liability, 1.5% $192,974General Contractor Bond, 2.5% $321,624General Contractor Tax, 5.5% $735,875General Contractor Total $14,115,424Soft Costs, 30% $4,234,627Escalation, 3% per year yrsTotal $18,350,051

OPINION OF PROBABLECONSTRUCTION COSTBASIS FOR ESTIMATE
��������CODE A ( No design completed)� �� �� �� �CODE B (Preliminary design)� �� �� �� �CODE C (Finished design)
COMPUTED BY: DHW New Mexico State University Proj. No. 0874.00 CHECKED BY: Utility Development Plan Dept. Mechanical
6/16/09 2014 Chilled Water Capital Costs Sheet No.
SUMMARY QUANTITY MATERIAL LABOR EQUIP TOTAL COST
No. UNIT PER TOTAL PER TOTAL PER
UNITS MEAS. UNIT UNIT UNIT
2000 ton duplex centrif chiller 1 ea $553,000.00 $553,000.00 $23,100.00 $23,100.00 $576,1001000 ton cooling tower 2 ea $137,375.00 $274,750.00 $8,500.00 $17,000.00 $291,7504000 gpm CHW pump 1 lf $36,750.00 $36,750.00 $2,250.00 $2,250.00 $39,0003000 gpm CW pump 2 lf $22,050.00 $44,100.00 $1,550.00 $3,100.00 $47,200
plant piping 2000 ton $280.00 $560,000.00 $560,000
controls 2000 ton $101.00 $202,000.00 $202,000
secondary plant building 1332 sf $180.00 $239,760.00 $239,760
distribution piping (see utility tunnel system)electrical (see electrical power system)
Subtotal $1,955,810Subcontractor Overhead, 10% $195,581Subcontractor Profit, 10% $215,139Subtotal $2,366,530General Contractor Overhead, 10% $236,653General Contractor Profit, 5% $130,159Subtotal $2,733,342General Contractor Liability, 1.5% $41,000General Contractor Bond, 2.5% $68,334General Contractor Tax, 5.5% $156,347General Contractor Total $2,999,023Soft Costs, 30% $899,707Escalation, 3% per year 5 yrs $620,967Total $4,519,697

OPINION OF PROBABLECONSTRUCTION COSTBASIS FOR ESTIMATE
��������CODE A ( No design completed)� �� �� �� �CODE B (Preliminary design)� �� �� �� �CODE C (Finished design)
COMPUTED BY: DHW New Mexico State University Proj. No. 0874.00 CHECKED BY: Utility Development Plan Dept. Mechanical
6/16/09 2019 Chilled Water Capital Costs Sheet No.
SUMMARY QUANTITY MATERIAL LABOR EQUIP TOTAL COST
No. UNIT PER TOTAL PER TOTAL PER
UNITS MEAS. UNIT UNIT UNIT
2000 ton duplex centrif chiller 2 ea $553,000.00 $1,106,000.00 $23,100.00 $46,200.00 $1,152,2001000 ton cooling tower 4 ea $137,375.00 $549,500.00 $8,500.00 $34,000.00 $583,5004000 gpm CHW pump 2 lf $36,750.00 $73,500.00 $2,250.00 $4,500.00 $78,0003000 gpm CW pump 4 lf $22,050.00 $88,200.00 $1,550.00 $6,200.00 $94,400
plant piping 4000 ton $280.00 $1,120,000.00 $1,120,000
controls 4000 ton $101.00 $404,000.00 $404,000
secondary plant building 2664 sf $180.00 $479,520.00 $479,520
distribution piping (see utility tunnel system)electrical (see electrical power system)
Subtotal $3,911,620Subcontractor Overhead, 10% $391,162Subcontractor Profit, 10% $430,278Subtotal $4,733,060General Contractor Overhead, 10% $473,306General Contractor Profit, 5% $260,318Subtotal $5,466,685General Contractor Liability, 1.5% $82,000General Contractor Bond, 2.5% $136,667General Contractor Tax, 5.5% $312,694General Contractor Total $5,998,046Soft Costs, 30% $1,799,414Escalation, 3% per year 10 yrs $2,681,674Total $10,479,134

OPINION OF PROBABLECONSTRUCTION COSTBASIS FOR ESTIMATE
��������CODE A ( No design completed)� �� �� �� �CODE B (Preliminary design)� �� �� �� �CODE C (Finished design)
COMPUTED BY: DHW New Mexico State University Proj. No. 0874.00 CHECKED BY: Utility Development Plan Dept. Mechanical
6/16/09 2024 Chilled Water Capital Costs Sheet No.
SUMMARY QUANTITY MATERIAL LABOR EQUIP TOTAL COST
No. UNIT PER TOTAL PER TOTAL PER
UNITS MEAS. UNIT UNIT UNIT
2000 ton duplex centrif chiller 4 ea $553,000.00 $2,212,000.00 $23,100.00 $92,400.00 $2,304,4001000 ton cooling tower 4 ea $137,375.00 $549,500.00 $8,500.00 $34,000.00 $583,5004000 gpm CHW pump 4 lf $36,750.00 $147,000.00 $2,250.00 $9,000.00 $156,0003000 gpm CW pump 4 lf $22,050.00 $88,200.00 $1,550.00 $6,200.00 $94,400
plant piping 4000 ton $280.00 $1,120,000.00 $1,120,000
controls 8000 ton $101.00 $808,000.00 $808,000
secondary plant building 2664 sf $180.00 $479,520.00 $479,520
distribution piping (see utility tunnel system)electrical (see electrical power system)
Subtotal $5,545,820Subcontractor Overhead, 10% $554,582Subcontractor Profit, 10% $610,040Subtotal $6,710,442General Contractor Overhead, 10% $671,044General Contractor Profit, 5% $369,074Subtotal $7,750,561General Contractor Liability, 1.5% $116,258General Contractor Bond, 2.5% $193,764General Contractor Tax, 5.5% $443,332General Contractor Total $8,503,915Soft Costs, 30% $2,551,175Escalation, 3% per year 15 yrs $6,168,380Total $17,223,470
OPINION OF PROBABLECONSTRUCTION COSTBASIS FOR ESTIMATE
��������CODE A ( No design completed)� �� �� �� �CODE B (Preliminary design)� �� �� �� �CODE C (Finished design)
COMPUTED BY: DHW New Mexico State University Proj. No. 0874.00 CHECKED BY: Utility Development Plan Dept. Mechanical
6/16/09 2029 Chilled Water Capital Costs Sheet No.
SUMMARY QUANTITY MATERIAL LABOR EQUIP TOTAL COST
No. UNIT PER TOTAL PER TOTAL PER
UNITS MEAS. UNIT UNIT UNIT
1030 ton dbl eff absorption chiller 2 ea $650,000.00 $1,300,000.00 $81,000.00 $162,000.00 $1,462,0002000 ton duplex centrif chiller 5 ea $553,000.00 $2,765,000.00 $23,100.00 $115,500.00 $2,880,5001000 ton glycol chiller 1 ea $250,000.00 $250,000.00 $17,500.00 $17,500.00 $267,5001000 ton cooling tower 10 ea $137,375.00 $1,373,750.00 $8,500.00 $85,000.00 $1,458,7502000 gpm CHW pump 2 ea $20,900.00 $41,800.00 $1,300.00 $2,600.00 $44,4004000 gpm CHW pump 5 lf $36,750.00 $183,750.00 $2,250.00 $11,250.00 $195,0003000 gpm CW pump 10 lf $22,050.00 $220,500.00 $1,550.00 $15,500.00 $236,000
plant piping 6000 ton $280.00 $1,680,000.00 $1,680,000plant piping 6000 ton $280.00 $1,680,000.00 $1,680,000
controls 12000 ton $101.00 $1,212,000.00 $1,212,000
secondary plant building 3996 sf $180.00 $719,280.00 $719,280
distribution piping (see utility tunnel system)electrical (see electrical power system)
Subtotal $10,155,430Subcontractor Overhead, 10% $1,015,543Subcontractor Profit, 10% $1,117,097Subtotal $12,288,070General Contractor Overhead, 10% $1,228,807General Contractor Profit, 5% $675,844Subtotal $14,192,721General Contractor Liability, 1.5% $212,891General Contractor Bond, 2.5% $354,818General Contractor Tax, 5.5% $811,824General Contractor Total $15,572,254Soft Costs, 30% $4,671,676Escalation, 3% per year 20 yrs $16,318,859Total $36,562,789

OPINION OF PROBABLECONSTRUCTION COSTBASIS FOR ESTIMATE
��������CODE A ( No design completed)� �� �� �� �CODE B (Preliminary design)� �� �� �� �CODE C (Finished design)
COMPUTED BY: DHW New Mexico State University Proj. No. 0874.00 CHECKED BY: Utility Development Plan Dept. Mechanical
6/16/09 Arts Complex, Ph I - Initial CHW Delivery Sheet No.
SUMMARY QUANTITY MATERIAL LABOR EQUIP TOTAL COST
No. UNIT PER TOTAL PER TOTAL PER
UNITS MEAS. UNIT UNIT UNIT
330 ton air cooled recip chiller 2 ea $193,000.00 $386,000.00 $7,725.00 $15,450.00 $401,45010" supply and return piping 100 lf $406.00 $40,600.00 $40,6001500 gpm chilled water pump 2 ea $12,800.00 $25,600.00 $1,050.00 $2,100.00 $27,700
concrete slab 600 sf $4.11 $2,466.00 $7.56 $4,536.00 $7,002
electrical 660 ton $100.00 $66,000.00 $66,000controls 660 ton $50.00 $33,000.00 $33,000
Subtotal $575,752Subcontractor Overhead, 10% $57,575Subcontractor Profit, 10% $63,333Subtotal $696,660General Contractor Overhead, 10% $69,666General Contractor Profit, 5% $38,316Subtotal $804,642General Contractor Liability, 1.5% $12,070General Contractor Bond, 2.5% $20,116General Contractor Tax, 5.5% $46,026General Contractor Total $882,853Soft Costs, 15% $132,428Escalation, 3% per year 2 yrs $61,831Total $1,077,112

OPINION OF PROBABLECONSTRUCTION COSTBASIS FOR ESTIMATE
��������CODE A ( No design completed)��������CODE B (Preliminary design)��������CODE C (Finished design)
COMPUTED BY: DHW New Mexico State University Proj. No. 0874.00 CHECKED BY: Utility Development Plan Dept. Mechanical
6/16/09 Bookstore - Initial CHW Delivery Sheet No.
SUMMARY QUANTITY MATERIAL LABOR EQUIP TOTAL COST
No. UNIT PER TOTAL PER TOTAL PER
UNITS MEAS. UNIT UNIT UNIT
100 ton air cooled recip chiller 1 ea $68,500.00 $68,500.00 $6,075.00 $6,075.00 $74,5754" supply and return piping 100 lf $232.00 $23,200.00 $23,200200 gpm chilled water pump 2 ea $3,475.00 $6,950.00 $540.00 $1,080.00 $8,030
concrete slab 300 sf $4.11 $1,233.00 $7.56 $2,268.00 $3,501
electrical 100 ton $100.00 $10,000.00 $10,000controls 100 ton $50.00 $5,000.00 $5,000
Subtotal $124,306Subcontractor Overhead, 10% $12,431Subcontractor Profit, 10% $13,674Subtotal $150,410General Contractor Overhead, 10% $15,041General Contractor Profit, 5% $8,273Subtotal $173,724General Contractor Liability, 1.5% $2,606General Contractor Bond, 2.5% $4,343General Contractor Tax, 5.5% $9,937General Contractor Total $190,610Soft Costs, 15% $28,591Escalation, 3% per year 2 yrs $13,349Total $232,551

OPINION OF PROBABLECONSTRUCTION COSTBASIS FOR ESTIMATE
��������CODE A ( No design completed)��������CODE B (Preliminary design)��������CODE C (Finished design)
COMPUTED BY: DHW New Mexico State University Proj. No. 0874.00 CHECKED BY: Utility Development Plan Dept. Mechanical
6/16/09 Chamisa, Ph II - Initial CHW Delivery Sheet No.
SUMMARY QUANTITY MATERIAL LABOR EQUIP TOTAL COST
No. UNIT PER TOTAL PER TOTAL PER
UNITS MEAS. UNIT UNIT UNIT
130 ton air cooled recip chiller 1 ea $88,000.00 $88,000.00 $6,350.00 $6,350.00 $94,3506" supply and return piping 100 lf $290.00 $29,000.00 $29,000300 gpm chilled water pump 2 ea $4,075.00 $8,150.00 $700.00 $1,400.00 $9,550
concrete slab 300 sf $4.11 $1,233.00 $7.56 $2,268.00 $3,501
electrical 130 ton $100.00 $13,000.00 $13,000controls 130 ton $50.00 $6,500.00 $6,500
Subtotal $155,901Subcontractor Overhead, 10% $15,590Subcontractor Profit, 10% $17,149Subtotal $188,640General Contractor Overhead, 10% $18,864General Contractor Profit, 5% $10,375Subtotal $217,879General Contractor Liability, 1.5% $3,268General Contractor Bond, 2.5% $5,447General Contractor Tax, 5.5% $12,463General Contractor Total $239,057Soft Costs, 15% $35,859Escalation, 3% per year 2 yrs $16,742Total $291,658

New Mexico State UniversityUtility Development PlanStage 2 - 06-16-09Utility Net Present Value AnalysisSummary
�������� ���������
�������������������������������������������������������������������
� ������������������������������������� �������������� �������������������������������
� ���������������������������� �������������������������������������������
� ���������������������������� ������������� �������������� �������������������������������
! �"�#�����������$��������������������������������������������������������������
% �"�#�����������$�������������������������������� �������������� �������������������������������
& �"�#�����������$����������������������� �������������������������������������������
' �"�#�����������$����������������������� ������������� �������������� �������������������������������
�������� ()*+�$�����,������
-��
,��������$������
"����������������
��������#
.� !�'& �&/ . ������%&� .���� ��
� .� ��&'���� . �/'��� / .�/��&'!
� ������������ ��������� �������
� .��%�!&%�%%� . �!���� % .'! �!''
! .����&/&�/%/ . ��� !���' .!'��%&
% .�� �'������ . ���&��'�! .�
& .� !�! !���� . ������&&� .�!����!
' .� '�'�%���% . ����%�� & . %&�&''
�! �����������
�0&�1 ������������ ��2���������������"��������3���� �����/#
�0��1 ���������
�0&�1 ���������
� ������������

New Mexico State UniversityUtility Development PlanStage 2 - 06-16-09Utility Net Present Value AnalysisScenario 1
���������������� �
������������������
����� ������
��������������� ����� ��������� ��!"#����
�����$%&# ! "���'�"(�#)&#$�����!�#�)#"��
��#*�&!�"����
# !#(����$%+!,�-���$� .
-#����$� .&�)�,
�,�&/� �"���&!��&�!%0
���!����'� !)��! �1,��)��!
�����&�)��!�#!�����,��# !
� $8,214,112 2�3.456.36� 2�7.67�.�5�
3 $8,214,112 28.�34.33�
� $8,214,112 28.�34.33�
9 $8,214,112 28.�34.33�
4 $8,214,112 28.�34.33�
: $8,455,265 29.8��.5�� 23�.�5:.78:
6 $8,455,265 28.4::.�6:
5 $8,455,265 28.4::.�6:
8 $8,455,265 28.4::.�6:
7 $8,455,265 28.4::.�6:
3� $8,827,196 25.643.44� 236.468.696
33 $8,827,196 28.8�5.376
3� $8,827,196 28.8�5.376
39 $8,827,196 28.8�5.376
34 $8,827,196 28.8�5.376
3: $9,346,643 233.565.48� 2�3.334.3�9
36 $9,346,643 27.946.649
35 $9,346,643 27.946.649
38 $9,346,643 27.946.649
37 $9,346,643 27.946.649
�� $9,946,761 23�.756.�4� 23�.63�.3�� 29:.:99.3�3
�3 $9,946,761 27.746.563
�� $9,946,761 27.746.563
�9 $9,946,761 27.746.563
�4 $9,946,761 27.746.563
�: $10,838,691 23�.898.673
��������������� ������������

New Mexico State UniversityUtility Development PlanStage 2 - 06-16-09Utility Net Present Value AnalysisScenario 2
���������������� �
������������������
����� ������
�� ������������� ������������ ������������ !"!�#$%��� "
�!�! &'(%"#"$! �)!$* %+(%&!�! �#�%�+%$!�
� %,!(#!$�!�
%"#%*��! &'-#. /��!&�"�
/%��! &�"�(�+�."
�. (0�"!$!�!(# �(�#'1
���#����)!"#+!�#"�2.��+!�#
�!���(!+!�#�%#�����.��%"#
� $8,296,297 345�678�967 35��97:��6;
� $8,296,297 37�48:�489
4 $8,296,297 37�48:�489
5 $8,296,297 37�48:�489
6 $8,296,297 37�48:�489
; $8,530,348 35�74��94� 3�4�5;���:7
: $8,530,348 37�;5��567
9 $8,530,348 37�;5��567
7 $8,530,348 37�;5��567
8 $8,530,348 37�;5��567
�� $8,895,845 35�74��94� 3�4�9�:�;:;
�� $8,895,845 37�78;�76;
�4 $8,895,845 37�78;�76;
�5 $8,895,845 37�78;�76;
�6 $8,895,845 37�78;�76;
�; $9,404,245 3���7�7�66� 34��4�4�:7;
�: $9,404,245 38�6�6�46;
�9 $9,404,245 38�6�6�46;
�7 $9,404,245 38�6�6�46;
�8 $9,404,245 38�6�6�46;
4� $9,994,764 3���6:4��:� 3�4�:68�7�� 356���:�946
4� $9,994,764 38�886�9:6
44 $9,994,764 38�886�9:6
45 $9,994,764 38�886�9:6
46 $9,994,764 38�886�9:6
4; $10,877,177 3���799��99
��������������� ������������

New Mexico State UniversityUtility Development PlanStage 2 - 06-16-09Utility Net Present Value AnalysisScenario 3
���������������� �
������������������
��������� ������
��������������� ����� ������ !"#"�$%&���!#
�"�"!'()&#$#%"!�*"%+!&,)&'"�"!�$�&�,&%"�
�!&-")$"%�"�!
&#$&+��"!'(.$/!0��"'�#1
0&��"!'�#1)�, /#
/!)2�#"%"�")$!�)�$(3
� �$����*"#$,"�$#�4/� ,"�$
�" ��)","�$�&$�����/��&#$
� $8,046,323 56718�617�� 5�918:81���
6 $8,046,323 581��:1���
� $8,046,323 581��:1���
� $8,046,323 581��:1���
� $8,046,323 581��:1���
9 $8,287,476 5�18��17�� 56�16�816;:
: $8,287,476 581�871�7:
7 $8,287,476 581�871�7:
8 $8,287,476 581�871�7:
; $8,287,476 581�871�7:
6� $8,659,408 571:�61��� 56:1���18�8
66 $8,659,408 581:9;1��8
6� $8,659,408 581:9;1��8
6� $8,659,408 581:9;1��8
6� $8,659,408 581:9;1��8
69 $9,178,855 56�18�81��� 56;1;871�;9
6: $9,178,855 5;16781899
67 $9,178,855 5;16781899
68 $9,178,855 5;16781899
6; $9,178,855 5;16781899
�� $9,778,972 56�1�9�16:� 581;;81��� 5�;1��;1���
�6 $9,778,972 5;17781;7�
�� $9,778,972 5;17781;7�
�� $9,778,972 5;17781;7�
�� $9,778,972 5;17781;7�
�9 $10,670,903 56�1:7�1;��
��������������� ������������

New Mexico State UniversityUtility Development PlanStage 2 - 06-16-09Utility Net Present Value AnalysisScenario 4
���������������� �
������������������
��������� ������
�� ������������� ������������ ��������� !"#$%$!&'(���#%
�$!$#)*+(%&%'$# ,$'-#(.+()$!$#�& (!.('$�
�#(/$+&$'�$�#
(%&(-�!$#)*0&1#2 !$)�%�
2( �$#)�%�+�."1%
"1#+3�%$'$�$+&# + &*4
�" &���!,$%&.$!&%�51 ".$!&
�$"��+$.$!&�(&���!!1��(%&
� $8,128,509 6�7�8�9���8 6:;�7<��8�;
� $8,128,509 68��:8�9�7
: $8,128,509 68��:8�9�7
� $8,128,509 68��:8�9�7
� $8,128,509 68��:8�9�7
9 $8,362,560 6��8:��;:� 6�:��8��:8�
< $8,362,560 68��<:�9<�
; $8,362,560 68��<:�9<�
8 $8,362,560 68��<:�9<�
7 $8,362,560 68��<:�9<�
�� $8,728,057 6��8:��;:� 6�:�9�8�;;;
�� $8,728,057 68�;:8��9;
�: $8,728,057 68�;:8��9;
�� $8,728,057 68�;:8��9;
�� $8,728,057 68�;:8��9;
�9 $9,236,456 6���<:7��<� 6:��8<9�<�<
�< $9,236,456 67�:�<��9<
�; $9,236,456 67�:�<��9<
�8 $9,236,456 67�:�<��9<
�7 $9,236,456 67�:�<��9<
:� $9,826,976 68��:��7<� 68�8<<�:9� 6:<�8����8<
:� $9,826,976 67�8:<�7;<
:: $9,826,976 67�8:<�7;<
:� $9,826,976 67�8:<�7;<
:� $9,826,976 67�8:<�7;<
:9 $10,709,389 6���;�7��87
��������������� ������������

New Mexico State UniversityUtility Development PlanStage 2 - 06-16-09Utility Net Present Value AnalysisScenario 5
���������������� �
������ �������� ����������������
����� ������
��������������� ����� ������������ !"�����
�����#$%"� �!���&�!'�"(%"#����� �"�("!��
��")�% �!����
"� "'����#$* +�,���#��-
,"����#��-%�(�+�
�+�%.���!���% ��%� $/
��� ����&�� (�� ��0+��(��
�����%�(�� �" �����+��"�
� $8,214,112 1�2-343-3�� 155-674-28�
8 $8,214,112 14-�83-88�
� $8,214,112 14-�83-88�
5 $8,214,112 14-�83-88�
3 $8,214,112 14-�83-88�
2 $8,455,265 14-934-��� 189-��5-362
6 $8,455,265 14-322-�62
9 $8,455,265 14-322-�62
4 $8,455,265 14-322-�62
7 $8,455,265 14-322-�62
8� $8,827,196 14-6�9-8�� 189-323-586
88 $8,827,196 14-4�9-876
8� $8,827,196 14-4�9-876
85 $8,827,196 14-4�9-876
83 $8,827,196 14-4�9-876
82 $9,346,643 19-638-33� 186-744-�45
86 $9,346,643 17-536-635
89 $9,346,643 17-536-635
84 $9,346,643 17-536-635
87 $9,346,643 17-536-635
�� $9,946,761 188-36�-86� 188-79�-3�� 155-548-5�8
�8 $9,946,761 17-736-968
�� $9,946,761 17-736-968
�5 $9,946,761 17-736-968
�3 $9,946,761 17-736-968
�2 $10,838,691 18�-454-678
��������������� ������������

New Mexico State UniversityUtility Development PlanStage 2 - 06-16-09Utility Net Present Value AnalysisScenario 6
���������������� �
������ �������� ����������������
����� ������
�� ������������� ������������ ������������� ! �"#$����!
� � �%&'$!"!# ��( #)�$*'$% � ��"�$�*$# �
��$+ '" #� ��
$!"$)�� �%&,"-�.�� %�!�
.$�� �%�!�'�*�-!
�-�'/�! # � '"��'�"&0
���"����( !"* �"!�1-��* �"
� ���' * �"�$"�����-��$!"
� $8,296,297 234�564�677 289�465�379
� $8,296,297 27�36:�364
3 $8,296,297 27�36:�364
8 $8,296,297 27�36:�364
5 $8,296,297 27�36:�364
9 $8,530,348 27�457�3�� 2�4�347�957
: $8,530,348 27�98��857
4 $8,530,348 27�98��857
7 $8,530,348 27�98��857
6 $8,530,348 27�98��857
�� $8,895,845 27�:34��3� 2�4�933�6:9
�� $8,895,845 27�769�759
�3 $8,895,845 27�769�759
�8 $8,895,845 27�769�759
�5 $8,895,845 27�769�759
�9 $9,404,245 28�73��43� 2�8�335�6:9
�: $9,404,245 26�5�5�359
�4 $9,404,245 26�5�5�359
�7 $9,404,245 26�5�5�359
�6 $9,404,245 26�5�5�359
3� $9,994,764 2���3:���:� 2�3�488�:�� 288�677�935
3� $9,994,764 26�665�4:5
33 $9,994,764 26�665�4:5
38 $9,994,764 26�665�4:5
35 $9,994,764 26�665�4:5
39 $10,877,177 2���744��44
��������������� ������������

New Mexico State UniversityUtility Development PlanStage 2 - 06-16-09Utility Net Present Value AnalysisScenario 7
���������������� �
������ �������� ����������������
��������� ������
��������������� ����� ������� !"!�#$%��� "
�!�! &'(%"#"$! �)!$* %+(%&!�! �#�%�+%$!�
� %,!(#!$�!�
%"#%*��! &'-#. /��!&�"0
/%��! &�"0(�+�."
�. (1�"!$!�!(# �(�#'2
���#����)!"#+!�#"�3.��+!�#
�!���(!+!�#�%#�����.��%"#
� $8,214,112 4�50�6�0��� 4��0786059�
9 $8,214,112 460�9�099�
� $8,214,112 460�9�099�
� $8,214,112 460�9�099�
� $8,214,112 460�9�099�
5 $8,455,265 460:�60��� 49:0���0�75
7 $8,455,265 460�550�75
: $8,455,265 460�550�75
6 $8,455,265 460�550�75
8 $8,455,265 460�550�75
9� $8,659,408 4705:�065� 4950���0�56
99 $8,659,408 4607580��6
9� $8,659,408 4607580��6
9� $8,659,408 4607580��6
9� $8,659,408 4607580��6
95 $9,178,855 4�06��0:�� 49�088805:5
97 $9,178,855 4809:60655
9: $9,178,855 4809:60655
96 $9,178,855 4809:60655
98 $9,178,855 4809:60655
�� $9,778,972 4990�7�097� 49�079�09�� 4��06590���
�9 $9,778,972 480::608:�
�� $9,778,972 480::608:�
�� $9,778,972 480::608:�
�� $9,778,972 480::608:�
�5 $10,670,903 49�07:�08��
��������������� ������������

New Mexico State UniversityUtility Development PlanStage 2 - 06-16-09Utility Net Present Value AnalysisScenario 8
���������������� �
������ �������� ����������������
��������� ������
�� ������������� ������������ ���������� !"#$# %&'���"$
�# #"()*'$%$&#"�+#&,"'-*'(# #"�%�' -'&#�
�"'.#*%#&�#�"
'$%',� #"()/%0"1� #(�$�
1'��#"(�$�*�-!0$
!0"*2�$#&#�#*%"�*�%)3
�!�%��� +#$%-# %$�40�!-# %
�#!��*#-# %�'%��� 0��'$%
� $8,296,297 567��87�899 5�:�78��69:
� $8,296,297 59�68;�687
6 $8,296,297 59�68;�687
� $8,296,297 59�68;�687
� $8,296,297 59�68;�687
: $8,530,348 59�7�9�6�� 5�7�679�:�9
; $8,530,348 59�:�����9
7 $8,530,348 59�:�����9
9 $8,530,348 59�:�����9
8 $8,530,348 59�:�����9
�� $8,728,057 5;�:7��9:� 5�:���6�8�7
�� $8,728,057 59�769��:7
�6 $8,728,057 59�769��:7
�� $8,728,057 59�769��:7
�� $8,728,057 59�769��:7
�: $9,236,456 5��96��76� 5����:7��7;
�; $9,236,456 58�6�;��:;
�7 $9,236,456 58�6�;��:;
�9 $9,236,456 58�6�;��:;
�8 $9,236,456 58�6�;��:;
6� $9,826,976 5����;6��;� 5�6�9�9�;:� 5����87�79;
6� $9,826,976 58�96;�87;
66 $9,826,976 58�96;�87;
6� $9,826,976 58�96;�87;
6� $9,826,976 58�96;�87;
6: $10,709,389 5���7�8��98
��������������� ������������

New Mexico State UniversityUtility Development Plan
Stage 2 - 06-16-09
Simple Payback for Ice Storage Facility
Assumptions:
Annual Avoided
Electrical
Demand
Annual Avoided On-
Peak Electrical
Consumption
Annual Cost of
Production (off-
peak charging)
Total Annual
Savings
-$90,692 -$122,557 $45,460 $167,789
1000 Ton Glycol Chiller: $250,000
43 Ice Storage Tanks: $623,500
Plant Piping: $80,000
Subtotal: $953,500
Contractor O&P: $190,700
Subtotal: $1,144,200
Contractor Liability, Bond, Tax: $108,699
Contractor Total: $1,252,899
Soft Costs: $187,935
Total: $1,440,834
Simple Payback Period (years): 8.6
Ice Storage Facility consists of one 1000 ton
glycol chiller and 43 312 ton-hr tanks for a
total of 13,188 ton-hrs of ice storage with a
discharge capacity of 4310 tons
The below numbers are reflective of on peak
operation under EPE proposed rate 26 and
are derived from the cogeneration model
included in this report
The below numbers are a product of an
11,000 ton total campus peak load
The figures below represent a preliminary
feasibility study only, thus warranting a
sensitivity study for optimization


Ø:
12
in
Flo
w:
10
16
US
gp
mV
el:
2.9
14
ft/
se
c
dP
: (5
.42
1)
psi
Ø: 16 inFlow: 4140 US gpmVel: 7.524 ft/secdP: 9.084 psi
Ø: 16 inFlow: 3688 US gpmVel: 6.701 ft/secdP: 8.398 psi
Ø:
24
in
Flo
w:
84
46
US
gp
mV
el:
6.7
47
ft/
se
c
Ø:
4 in
Flo
w:
20
6 U
S g
pm
Ve
l:
5.1
96
ft/
se
c
dP
: 1
.79
4 p
si
Ø: 12 inFlow: 1643 US gpmVel: 4.714 ft/secdP: 6.029 psi
Ø: 12 inFlow: 1437 US gpmVel: 4.123 ft/secdP: 2.636 psi
Ø: 12 inFlow: 1643 US gpmVel: 4.714 ft/secdP: 0.425 psi
Ø:
6 in
Flo
w:
43
7 U
S g
pm
Ve
l:
4.8
57
ft/
se
c
dP
: 0
.74
psi
Ø:
12
in
Flo
w:
40
9 U
S g
pm
Ve
l:
1.1
73
ft/
se
c
dP
: 0
.01
9 p
si
Ø:
12
in
Flo
w:
13
37
US
gp
mV
el:
3.8
36
ft/
se
c
dP
: 0
.31
5 p
si
Ø: 12 inFlow: 1893 US gpmVel: 5.431 ft/secdP: 5.189 psi
Ø: 12 inFlow: 1484 US gpmVel: 4.257 ft/secdP: 1.557 psi
Ø: 12 inFlow: 146.9 US gpmVel: 0.422 ft/secdP: (5.6) psi
Ø:
12
in
Flo
w:
14
96
US
gp
mV
el:
4.2
92
ft/
se
c
dP
: (4
.90
9)
psi
Ø: 12 inFlow: 1867 US gpmVel: 5.357 ft/secdP: 0.856 psi
Ø: 12 inFlow: 1458 US gpmVel: 4.184 ft/secdP: (4.056) psi
Ø: 12 inFlow: 121.2 US gpmVel: 0.348 ft/secdP: (1.29) psi
Ø:
12
in
Flo
w:
15
22
US
gp
mV
el:
4.3
66
ft/
se
c
dP
: (4
.88
6)
psi
Ø: 12 inFlow: 2979 US gpmVel: 8.546 ft/secdP: 14.81 psi
Ø: 12 inFlow: 1448 US gpmVel: 4.154 ft/secdP: (7.654) psi
Ø: 6 inFlow: 933 US gpmVel: 10.37 ft/secdP: 1.601 psi
Ø:
8 in
Flo
w:
42
1 U
S g
pm
Ve
l:
2.7
02
ft/
se
c
dP
: 0
.10
1 p
si
Ø: 10 inFlow: 1564 US gpmVel: 6.369 ft/secdP: 2.086 psi
Ø:
10
in
Flo
w:
14
38
US
gp
mV
el:
5.8
58
ft/
se
c
dP
: (0
.18
9)
psi
Ø:
10
in
Flo
w:
66
2.6
US
gp
mV
el:
2.6
98
ft/
se
c
dP
: 5
.84
1 p
si
Ø:
10
in
Flo
w:
58
5.6
US
gp
mV
el:
2.3
85
ft/
se
c
dP
: 0
.09
2 p
si
Ø: 8 inFlow: 857.1 US gpmVel: 5.502 ft/secdP: 1.948 psi
Ø: 3 inFlow: Vel: 3dP: (3
Ø: 3 in
Flow: 152 US gpm
Vel: 6.603 ft/sec
dP: 3.48 psi
Ø: 4 inFlow: 218 US gpmVel: 5.499 ft/secdP: (0.629) psi
Ø: 12 inFlow: 1Vel: 4.dP: 0.4
Ø:
5 in
Flo
w:
11
7 U
S g
pm
Ve
l:
1.8
78
ft/
se
c
dP
: 0
.18
psi
Ø:
10
in
Flo
w:
13
99
US
gp
mV
el:
5.6
99
ft/
se
c
dP
: 0
.87
5 p
si
Ø:
5 in
Flo
w:
77
3 U
S g
pm
Ve
l:
12
.41
ft/
se
c
dP
: 5
.11
1 p
si
Ø: 8 inFlow: 791 US gpmVel: 5.077 ft/secdP: 1.672 psi
Ø:
8 in
Flo
w:
93
5.4
US
gp
mV
el:
6.0
05
ft/
se
c
dP
: 2
.48
7 p
si
Ø: 3 inFlow: 54 US gpmVel: 2.346 ft/secdP: (4.446) psi
Ø:
6 in
Flo
w:
32
1 U
S g
pm
Ve
l:
3.5
68
ft/
se
c
dP
: 0
.16
7 p
si
Ø: 8 inFlow: 375 US gpmVel: 2.407 ft/secdP: 5.714 psi
Ø:
8 in
Flo
w:
95
2.8
US
gp
mV
el:
6.1
16
ft/
se
c
dP
: (3
.02
9)
psi
Ø: 12 inFlow: 2186 US gpmVel: 6.272 ft/secdP: 2.827 psi
Ø:
8 in
Flo
w:
92
0 U
S g
pm
Ve
l:
5.9
05
ft/
se
c
dP
: 2
.42
2 p
si
Ø: 12 inFlow: 2414 US gpmVel: 6.926 ft/secdP: 14.74 psi
Ø: 12 inFlow: 2970 US gpmVel: 8.52 ft/secdP: (2.133) psi
Ø: 8
inF
low
: 906
US
gp
mV
el:
5.8
16 ft/
sec
dP
: 0
.566
psi
Ø:
6 in
Flo
w:
54
2 U
S g
pm
Ve
l: 6
.025
ft/
s ec
dP
: 2
.88
2 p
si
Ø:
6 in
Flo
w:
35
6.4
US
gp
mV
el:
3.9
61
ft/
se
c
dP
: 1
.56
2 p
si
Ø:
6 in
Flo
w:
576
.6 U
S g
pm
Ve
l : 6
.41
ft /sec
dP
: 3
.242
psi
Ø: 12 inFlow: 1483 US gpmVel: 4.254 ft/secdP: 3.753 psi
Ø:
12
in
Flo
w:
17
28
US
gp
mV
el:
4.9
57
ft/
se
c
dP
: 6
.57
6 p
si
US
gp
mft
/se
c
psi
Ø:
10
in
Flo
w:
16
22
US
gp
mV
el:
6.6
06
ft/
se
c
dP
: 3
.01
5 p
si
Ø:
10
in
Flo
w:
12
62
US
gp
mV
el:
5.1
39
ft/
se
c
dP
: 7
.59
5 p
si
Ø:
10
in
Flo
w:
63
0.2
US
gp
mV
el:
2.5
66
ft/
se
c
dP
: 5
.82
4 p
si
Ø: 10 inFlow: 1630 US gpmVel: 6.638 ft/secdP: 2.258 psi
Ø:
8 in
Flo
w:
92
7.9
US
gp
mV
el:
5.9
56
ft/
se
c
dP
: 2
.46
2 p
si
Ø: 8 inFlow: 375 US gpmVel: 2.407 ft/secdP: 0.109 psi
Ø: 3 inFlow: 54 US gpmVel: 2.346 ft/secdP: 6.879 psi
P: 57.35 psi g
P:
45
.09
psi g
P:
40
.19
psi g
P:
67
.89
psi g
P: 96.85 psi g
P: 54.92 psi g
P: 92.63 psi g P: 95.46 psi g
P:
95
.76
psi g
P:
90
.15
psi g
P: 90.41 psi g
P: 57.34 psi g
Branson Library 01FCV @ 152 US gpm
Old ChemistryFCV @ 773 US gpmdP: 24.73 psi
Gardiner HallFCV @ 421 US gpmdP: 39.58 psi
Gerald Thomas HallFCV @ 933 US gpmdP: 18.4 psi
Goddard HallFCV @ 213 US gpmdP: 32.04 psi
Hadley HallFCV @ 218 US gpmdP: 39.16 psi
Kent HalFCV @ 1dP: 43.95
Music CenterFCV @ 321 US gpmdP: 31.23 psi
Conroy Honors CenterFCV @ 54 US gpmdP: 29.13 psi
Skeen HallFCV @ 906 US gpmdP: 26.76 psi
05-01 Arts Complex, Ph 1 FCV @ 1337 US gpmdP: 27.67 psi
10-16 Arts Complex, Ph 2FCV @ 409 US gpmdP: 28.74 psi
15-15 Arts Complex, Ph 3FCV @ 437 US gpmdP: 29.14 psi
20-08 Arts Complex, Ph 4FCV @ 206 US gpmdP: 25.22 psi
25-04 Arts Complex, Ph 5FCV @ 1437 US gpmdP: 26.42 psi

Ø:
24
in
Flo
w:
89
54
US
gp
mV
el:
7.1
53
ft/
se
c
dP
: 3
.35
psi
Ø:
24
in
Flo
w:
51
05
US
gp
mV
el:
4.0
78
ft/
se
c
dP
: 8
.00
9 p
si
Ø:
4 in
Flo
w:
20
0 U
S g
pm
Ve
l:
5.0
45
ft/
se
c
dP
: 1
5.1
5 p
si
Ø:
6 in
Flo
w:
32
2 U
S g
pm
Ve
l:
3.5
79
ft/
se
c
dP
: 1
3.5
9 p
si
Ø:
6 in
Flo
w:
32
2 U
S g
pm
Ve
l:
3.5
79
ft/
se
c
dP
: 1
6.6
1 p
si
Ø:
6 in
Flo
w:
25
1 U
S g
pm
Ve
l:
2.7
9 f
t/se
c
dP
: 1
.99
8 p
si
Ø:
6 in
Flo
w:
38
7 U
S g
pm
Ve
l:
4.3
02
ft/
se
c
dP
: 7
.85
psi
Ø:
4 in
Flo
w:
12
9 U
S g
pm
Ve
l:
3.2
54
ft/
se
c
dP
: 7
.71
7 p
si
Ø:
3 in
Flo
w:
42
US
gp
mV
el:
1.8
24
ft/
se
c
dP
: 0
.24
3 p
si
Ø:
12
in
Flo
w:
19
17
US
gp
mV
el:
5.5
01
ft/
se
c
dP
: 7
.70
8 p
si
Ø:
4 in
Flo
w:
20
0 U
S g
pm
Ve
l:
5.0
45
ft/
se
c
dP
: 1
6.1
psi
Ø:
24
in
Flo
w:
74
39
US
gp
mV
el:
5.9
43
ft/
se
c
dP
: (1
5.0
6)
psi
Ø: 24 inFlow: 7117 US gpmVel: 5.686 ft/secdP: 0.5 psi
Ø: 24 inFlow: 6917 US gpmVel: 5.526 ft/secdP: 0.304 psi
Ø: 24 inFlow: 6395 US gpmVel: 5.109 ft/secdP: 0.312 psi
Ø: 24 inFlow: 6266 US gpmVel: 5.006 ft/secdP: 0.373 psi
Ø: 24 inFlow: 5879 US gpmVel: 4.697 ft/secdP: 0.544 psi
Ø:
24
in
Flo
w:
53
56
US
gp
mV
el:
4.2
79
ft/
se
c
Ø: 24 inFlow: 5874 US gpmVel: 4.692 ft/secdP: 0.543 psi
Ø: 24 inFlow: 6261 US gpmVel: 5.002 ft/secdP: 0.372 psi
Ø: 24 inFlow: 6390 US gpmVel: 5.105 ft/secdP: 0.312 psiØ: 24 in
Flow: 6912 US gpmVel: 5.522 ft/secdP: 0.304 psi
Ø: 24 inFlow: 7112 US gpmVel: 5.681 ft/secdP: 0.499 psi
Ø:
24
in
Flo
w:
74
34
US
gp
mV
el:
5.9
39
ft/
se
c
dP
: 0
.50
3 p
si
Ø: 6 inFlow: 400 US gpmVel: 4.446 ft/secdP: 0.511 psi
Ø:
4 in
Flo
w:
21
4 U
S g
pm
Ve
l:
5.3
98
ft/
se
c
dP
: 2
.14
1 p
si
Ø:
4 in
Flo
w:
21
4 U
S g
pm
Ve
l:
5.3
98
ft/
se
c
dP
: 0
.94
1 p
si
Ø:
24
in
Flo
w:
98
26
US
gp
mV
el:
7.8
49
ft/
se
c
dP
: (5
.91
2)
psi
Ø:
24
in
Flo
w:
93
82
US
gp
mV
el:
7.4
95
ft/
se
c
dP
: 1
7.2
6 p
si
Ø:
24
in
Flo
w:
10
25
4 U
S g
pm
Ve
l:
8.1
91
ft/
se
c
dP
: 2
.02
4 p
si
Ø:
12
in
Flo
w:
25
90
US
gp
mV
el:
7.4
31
ft/
se
c
dP
: (0
.52
5)
psi
Ø:
12
in
Flo
w:
26
04
US
gp
mV
el:
7.4
71
ft/
se
c
dP
: 1
2.2
1 p
si
Ve
l:
6.7
47
ft/
se
c
dP
: (4
.39
6)
psi
Ø: 24 inFlow: 10130 US gpmVel: 8.092 ft/secdP: (4.291) psi
Ø: 24 inFlow: 10983 US gpmVel: 8.774 ft/secdP: (4.061) psi
Ø:
6 in
Flo
w:
32
0 U
S g
pm
Ve
l:
3.5
57
ft/
se
c
dP
: 0
.26
1 p
si
Ø: 8
in
Flow: 6
08 U
S gpm
Vel:
3.903
ft/s
ec
dP: 0.8
11 p
si
Ø: 8 inFlow: 288 US gpmVel: 1.849 ft/secdP: 5.84 psi
Ø: 12 in
Flow: 1305 US gpm
Vel: 3.743 ft/sec
dP: 2.102 psi
Ø:
6 in
Flo
w:
40
6 U
S g
pm
Ve
l:
4.5
13
ft/
se
c
dP
: 1
.94
6 p
si
Ø: 12 in
Flow: 898.7 US gpm
Vel: 2.578 ft/sec
dP: 1.677 psi
Ø:
6 in
Flo
w:
29
2 U
S g
pm
Ve
l:
3.2
46
ft/
se
c
dP
: (7
.62
6)
psi
Ø:
5 in
Flo
w:
16
5 U
S g
pm
Ve
l:
2.6
49
ft/
se
c
dP
: 0
.99
8 p
si
Ø:
6 in
Flo
w:
97
8 U
S g
pm
Ve
l:
10
.87
ft/
se
c
dP
: 6
.57
5 p
si
Ø: 12 in
Flow: 371.3 U
S gpm
Vel: 1.065 ft/
sec
dP: 25.54 psi
Ø: 12 inFlow: 2114 US gpm
Vel: 6.066 ft/sec
dP: 4.877 psi
Ø: 6 inFlow: 567 US gpm
Vel: 6.302 ft/sec
dP: 4.686 psi
Flo
w:
73
7.5
US
gp
m
Ø:
8 in
Flo
w:
73
7.5
US
gp
mV
el:
4.7
34
ft/
se
c
dP
: (1
.83
5)
psi
Ø:
8 in
Flo
w:
11
37
US
gp
mV
el:
7.3
01
ft/
se
c
dP
: 1
.55
9 p
si
Ø: 8 inFlow: 500.8 US gpmVel: 3.215 ft/secdP: 0.998 psi Ø: 12 in
Flow: 1875 US gpmVel: 5.38 ft/secdP: 0.571 psi
Ø: 3 inFlow: 73 US gpmVel: 3.171 ft/secdP: (3.035) psi
Ø: 5 inFlow: 77 US gpmVel: 1.236 ft/secdP: 0.138 psi
Ø:
8 in
Flo
w:
23
7 U
S g
pm
Ve
l:
1.5
21
ft/
se
c
dP
: 0
.04
8 p
si
Ø: 5 inFlow: 303 US gpmVel: 4.864 ft/secdP: 8.002 psi
Ø: 8 inFlow: 370 US gpmVel: 2.375 ft/secdP: 7.165 psi
Ø: 8
in
Flow: 6
08 US g
pm
Vel:
3.903
ft/se
c
dP: 0.8
06 p
si
Ø:
6 in
Flo
w:
31
4 U
S g
pm
Ve
l:
3.4
9 f
t/se
c
dP
: 0
.25
7 p
si
Ø: 12 inFlow: 1516 US gpmVel: 4.35 ft/secdP: 0.447 psi
Ø: 12 in
Flow: 406 U
S gpm
Vel: 1.165 ft/
sec
dP: 1.512 psi
Ø: 12 in
Flow: 1676 US gpm
Vel: 4.808 ft/sec
dP: 13.58 psi
Ø: 12 in
Flow: 2082 US gpm
Vel: 5.973 ft/sec
dP: (3.99) psi
Flo
w:
67
3.9
US
gp
mV
el:
4.3
25
ft/
se
c
dP
: 0
.53
psi
Ø:
8 in
Flo
w:
67
3.9
US
gp
mV
el:
4.3
25
ft/
se
c
dP
: 3
.66
6 p
si
Ø:
8 in
Flo
w:
10
74
US
gp
mV
el:
6.8
93
ft/
se
c
dP
: 1
.37
6 p
si
Ø: 8 inFlow: 578.3 US gpmVel: 3.712 ft/secdP: 8.382 psi
Ø:
12
in
Flo
w:
19
31
US
gp
mV
el:
5.5
4 f
t/se
c
dP
: (1
0.6
7)
psi
Ø: 8
in
Flow: 2
88 U
S gpm
Vel:
1.84
9 ft/
sec
dP: (
5.36
9) p
si
P: 41.19 psi g
P: 3
9.9
9 p
si g
P: 42.62 psi g
P:
27
.53
psi g
P: 41.11 psi g
P: 85.1 psi g
P: 84.7 psi g
P: 63.5 psi g
P: 65.18 psi g
Business AdministrationFCV @ 314 US gpmdP: 44.71 psi
Guthrie HallFCV @ 237 US gpmdP: 43.62 psi
Health & Social Services BldgFCV @ 370 US gpmdP: 44.55 psi
Kent HallFCV @ 117 US gpmdP: 43.95 psi
Milton HallFCV @ 567 US gpmdP: 37.27 psi
Young HallFCV @ 73 US gpmdP: 35.57 psi
Corbett CenterFCV @ 813 US gpmdP: 21.18 psi
New Corbett Equip RmFCV @ 406 US gpmdP: 36.93 psi
Dove HallFCV @ 77 US gpmdP: 42.33 psi
Rhodes-Garrett-Hamiel Res HallFCV @ 292 US gpmdP: 34.84 psi
Clara Belle / SpeechFCV @ 303 US gpmdP: 42.84 psi
05-02 Inst. for Public PolicyFCV @ 320 US gpmdP: 43.1 psi
05-03 Student Serv Fac, Ph 1 FCV @ 214 US gpmdP: 39.35 psi
10-03 Student Serv Fac, Ph 2FCV @ 214 US gpmdP: 36.1 psi
05-05 Tech. Lab/Clsrm FacilityFCV @ 400 US gpmdP: 39.12 psi
BookstoreFCV @ 200 US gpmdP: 43.09 psi
05-10 Addition to H&SSFCV @ 42 US gpmdP: 43.78 psi
10-01 W. Mixed Use/Grad HousngFCV @ 288 US gpmdP: 43.29 psi
10-02 E. MixUse/Grad Hsng, Ph1FCV @ 129 US gpmdP: 43.35 psi
10-02 E MixUse/Grad Hsng, Ph1FCV @ 387 US gpmdP: 42.36 psi
10-04 New Undergrad HousingFCV @ 251 US gpmdP: 41.03 psi
10-14 Jordan St. GatewayFCV @ 322 US gpmdP: 44.81 psi
10-14 Jordan St GatewayFCV @ 322 US gpmdP: 42.53 psi
10-14 Jordan Street GatewayFCV @ 200 US gpmdP: 41.08 psi
P: 48.64 psi g
P:
86
.57
psi g
P: 38.96 psi g
P: 92.23 psi g
P:
85
.16
psi g
P:
22
.01
psi g
P:
69
.6 p
si g
P: 37.57 psi g
CUP2 CHWPSet @ 30409 US gpmTH: (143.1) ft
10-01dP: 1 psi
Secondary Utility Plant

Ø:
24
in
Flo
w:
51
00
US
gp
mV
el:
4.0
74
ft/
se
c
dP
: (0
.87
1)
psi
Ø: 6 inFlow: 523 US gpmVel: 5.813 ft/secdP: 2.908 psi
Ve
l:
4.2
79
ft/
se
c
dP
: 0
.40
8 p
si
Ø:
24
in
Flo
w:
53
51
US
gp
mV
el:
4.2
75
ft/
se
c
dP
: 0
.40
8 p
si
Ø:
4 in
Flo
w:
15
4 U
S g
pm
Ve
l:
3.8
85
ft/
se
c
dP
: 5
.09
3 p
si
Ø: 12 inFlow: 2716 US gpmVel: 7.791 ft/secdP: 10.96 psi
Ø: 12 inFlow: 1232 US gpm
Vel: 3.535 ft/sec
dP: 11.6 psi
Ø: 12 inFlow: 1995 US gpm
Vel: 5.722 ft/sec
dP: (10.51) psi
Ø: 5 in
Flo
w: 288 U
S g
pm
Vel:
4.6
23 ft/se
c
dP
: (3
.691)
psi
Ø: 12 inFlow: 2283 US gpmVel: 6.549 ft/secdP: 5.761 psi
Ø:
8 in
Flo
w:
43
3 U
S g
pm
Ve
l:
2.7
79
ft/
se
c
dP
: (6
.89
3)
psi
Ø:
10
in
Flo
w:
92
6 U
S g
pm
Ve
l:
3.7
71
ft/
se
c
dP
: 0
.28
psi
Flow: 1305 US gpm
Ø: 12 inFlow: 1943 US gpmVel: 5.576 ft/secdP: (1.19) psi
Ø: 12 inFlow: 1510 US gpmVel: 4.333 ft/secdP: (6.384) psi
Ø: 12 inFlow: 1222 US gpm
Vel: 3.507 ft/sec
dP: 7.387 psi
P: 24.52 psi g
P: 17.13 psi gP: 23.51 psi gP
: 3
1.5
2 p
si g
P: 67.28 psi g P: 52.43 psi g
P: 46.67 psi g
P: 57.19 psi g
EducationalServicesCntr FCV @ 288 US gpmdP: 31.57 psi
Garcia Residence HallFCV @ 926 US gpmdP: 39.8 psi
Pan American CenterFCV @ 1232 US gpmdP: 31.09 psi
Pinon Residence HallFCV @ 433 US gpmdP: 34.61 psi
15-01 E MixUse/Grad Hsng, Ph 2FCV @ 523 US gpmdP: 39.96 psi

Ø:
12
in
Flo
w:
70
4.5
US
gp
mV
el:
2.0
21
ft/
se
c
dP
: (8
.41
) p
si
Ø:
12
in
Flo
w:
61
3.2
US
gp
mV
el:
1.7
59
ft/
se
c
dP
: 8
.54
6 p
si
Ø: 8 inFlow: 1258 US gpmVel: 8.074 ft/secdP: 1.236 psi
Ø: 8 inFlow: 588 US gpmVel: 3.774 ft/secdP: 0.294 psi
Ø: 12 inFlow: 1553 US gpmVel: 4.456 ft/secdP: 3.673 psi
Ø: 12 inFlow: 1746 US gpmVel: 5.008 ft/secdP: (1.771) psi
ØFVd
Ø:
4 in
Flo
w:
20
0 U
S g
pm
Ve
l:
5.0
45
ft/
se
c
dP
: 1
.03
5 p
si
Flo
w:
43
36
US
gp
mV
el:
3.4
64
ft/
se
c
dP
: (1
.68
6)
psi
Ø:
24
in
Flo
w:
43
68
US
gp
mV
el:
3.4
9 f
t/se
c
dP
: 2
.56
4 p
si
Ø:
12
in
Flo
w:
14
55
US
gp
mV
el:
4.1
74
ft/
se
c
dP
: 2
.67
1 p
si
Ø: 4 inFlow: 175 US gpmVel: 4.414 ft/secdP: 0.632 psi
Ø:
12
in
Flo
w:
53
7.3
US
gp
mV
el:
1.5
41
ft/
se
c
dP
: 0
.09
8 p
si
Ø:
12
in
Flo
w:
19
2.8
US
gp
mV
el:
0.5
53
ft/
se
c
dP
: 0
.02
6 p
si
Ø:
12
in
Flo
w:
79
9.5
US
gp
mV
el:
2.2
94
ft/
se
c
dP
: 0
.29
8 p
si
Ø: 12 inFlow: 2255 US gpmVel: 6.468 ft/secdP: 4.396 psiØ: 12 in
Flow: 2346 US gpmVel: 6.73 ft/secdP: 4.741 psi
Ø:
12
in
Flo
w:
89
0.8
US
gp
mV
el:
2.5
56
ft/
se
c
dP
: 0
.36
5 p
si
Ø:
32
in
Flo
w:
90
10
US
gp
mV
el:
3.9
28
ft/
se
c
dP
: 0
.24
psi
Ø:
32
in
Flo
w:
88
16
US
gp
mV
el:
3.8
43
ft/
se
c
dP
: 0
.23
1 p
si
Ø: 12 inFlow: 1504 US gpmVel: 4.315 ft/secdP: 9.367 psi
Ø: 12 inFlow: 1504 US gpmVel: 4.315 ft/secdP: (7.878) psi
Ø: 10 inFlow: 1763 US gpmVel: 7.179 ft/secdP: 1.154 psi
Ø: 10 inFlow: 1706 US gpmVel: 6.948 ft/secdP: (7.382) psi
Ø: 16 inFlow: 1821 US gpmVel: 3.309 ft/secdP: 0.092 psi
Ø: 32 inFlow: 13000 US gpmVel: 5.668 ft/secdP: 0.054 psi
Ø: 5
inF
low
: 29
4 U
S g
pm
Ve
l: 4
.71
9 f
t/sec
dP
: 0
.46
8 p
si
Ø:
6 in
Flo
w:
60
5 U
S g
pm
Ve
l:
6.7
25
ft/
se
c
dP
: 5
.01
6 p
si
Ø:
6 in
Flo
w:
54
4 U
S g
pm
Ve
l:
6.0
47
ft/
se
c
dP
: 1
.54
2 p
si
Ø: 8 inFlow: 906 US gpmVel: 5.816 ft/secdP: 6.176 psi
Ø: 8 inFlow: 906 US gpmVel: 5.816 ft/secdP: 1.908 psi
Ø: 14 inFlow: 831.9Vel: 1.975 dP: (8.316)
Ø:
10
in
Flo
w:
12
13
US
gp
mV
el:
4.9
41
ft/
se
c
dP
: 5
.27
2 p
si
Ø: 14 inFlow: 1254 US gpmVel: 2.977 ft/secdP: (8.271) psi
Ø:
6 in
Flo
w:
65
4 U
S g
pm
Ve
l:
7.2
69
ft/
se
c
dP
: 4
.46
8 p
si
Ø: 14 inFlow: 600.2 US gpmVel: 1.425 ft/secdP: 2.876 psi
Ø:
6 in
Flo
w:
39
1 U
S g
pm
Ve
l:
4.3
46
ft/
se
c
dP
: 1
.83
6 p
si
Ø:
6 in
Flo
w:
19
7 U
S g
pm
Ve
l:
2.1
9 f
t/se
c
dP
: 0
.22
3 p
si
Ø: 8 inFlow: 1201 US gpmVel: 7.711 ft/secdP: 1.608 psi
Ø:
4 in
Flo
w:
50
5 U
S g
pm
Ve
l:
12
.74
ft/
se
c
dP
: 4
.54
1 p
si
Ø: 10 inFlow: 1706 US gpmVel: 6.948 ft/secdP: 1.084 psi
Ø:
5 in
Flo
w:
93
5 U
S g
pm
Ve
l:
15
.01
ft/
se
c
dP
: 1
0.7
9 p
si
Ø: 12 inFlow: 1987 US gpmVel: 5.701 ft/secdP: (8.907) psi
Ø:
6 in
Flo
w:
62
6 U
S g
pm
Ve
l:
6.9
58
ft/
se
c
dP
: 1
.06
3 p
si
Ø:
6 in
Flo
w:
26
9 U
S g
pm
Ve
l:
2.9
9 f
t/se
c
dP
: 0
.34
8 p
si
Ø: 8 inFlow: 505 US gpmVel: 3.242 ft/secdP: 0.338 psi
Ø:
12
in
Flo
w:
10
51
US
gp
mV
el:
3.0
15
ft/
se
c
dP
: 2
.56
psi
Ø:
8 in
Flo
w:
76
6 U
S g
pm
Ve
l:
4.9
17
ft/
se
c
dP
: 5
.17
7 p
si
Ø:
14
in
Flo
w:
65
.93
US
gp
mV
el:
0.1
57
ft/
se
c
dP
: 8
.49
psi
Ø: 16 inFlow: 2228 US gpmVel: 4.048 ft/secdP: (8.353) psi
Ø:
12
in
Flo
w:
15
15
US
gp
mV
el:
4.3
48
ft/
se
c
dP
: 1
2.8
3 p
si
Ø:
14
in
Flo
w:
65
7.4
US
gp
mV
el:
1.5
61
ft/
se
c
dP
: 4
.32
1 p
si
Ø:
4 in
Flo
w:
24
2 U
S g
pm
Ve
l:
6.1
05
ft/
se
c
dP
: 1
.09
1 p
si
Ø: 14 inFlow: 358.2 US gpmVel: 0.85 ft/secdP: 1.427 psi
Ø: 14 inFlow: 1016 US gpmVel: 2.411 ft/secdP: (4.127) psi
Ø:
14
in
Flo
w:
70
4.8
US
gp
mV
el:
1.6
73
ft/
se
c
dP
: (4
.15
5)
psi
Ø:
12
in
Flo
w:
10
80
US
gp
mV
el:
3.0
99
ft/
se
c
dP
: (1
.66
) p
si
Ø: 12 inFlow: 1694 US gpmVel: 4.86 ft/secdP: (0.78) psi
Ø: 8 inFlow: 505 US gpmVel: 3.242 ft/secdP: 4.585 psi
Ø:
12
in
Flo
w:
16
28
US
gp
mV
el:
4.6
71
ft/
se
c
dP
: 0
.11
5 p
si
Ø: 10 inFlow: 1763 US gpmVel: 7.179 ft/secdP: 9.664 psi
Ø: 8 inFlow: 553.4 US gpmVel: 3.552 ft/secdP: 0.364 psi
Ø:
6 in
Flo
w:
35
6.4
US
gp
mV
el:
3.9
61
ft/
se
c
dP
: 1
.56
2 p
si
Ø: 14 inFlow: 767.2 US gpmVel: 1.821 ft/secdP: 4.313 psi
Ø: 14 inFlow: 62.41 US gpmVel: 0.148 ft/secdP: (4.243) psi
Ø: 14 inFlow: 304.4 US gpmVel: 0.723 ft/secdP: 2.842 psi
Ø: 14 inFlow: 958.4 US gpmVel: 2.275 ft/secdP: 0.13 psi
Ø:
14
in
Flo
w:
45
8.5
US
gp
mV
el:
1.0
89
ft/
se
c
dP
: (2
8.1
9)
psi
Ø:
10
in
Flo
w:
13
97
UV
el:
5.6
9 f
t/s
dP
: 2
.76
5 p
s
P: 51.72 psi g
P: 56.03 psi g
P: 69.57 psi g
P:
67
.97
psi g
P: 54.21 psi g
P:
52
.46
psi g
P:
55
.87
psi g
P: 79.9 psi g
P: 92.65 psi g
P: 88.52 psi g
P: 92.84 psi g
P:
90
.28
psi g
P: 87.79 psi g
P: 97.69 psi gP: 95.81 psi g
FCV @ 152 US gpmdP: 33.65 psi
Computer CenterFCV @ 269 US gpmdP: 33.6 psi
Engineering Complex IFCV @ 371 US gpmdP: 3.939 psi
Foster HallFCV @ 654 US gpmdP: 32.4 psi
dP: 32.04 psi
Jet AnnexFCV @ 44 US gpmdP: 29.06 psi
Jet HallFCV @ 561 US gpmdP: 27.41 psi
Engineering Complex II FCV @ 294 US gpmdP: 32.34 psi
Knox HallFCV @ 505 US gpmdP: 18.61 psi
O'Donnell HallFCV @ 626 US gpmdP: 31.81 psi
OFS Central Heating PlantFCV @ 120 US gpmdP: 34.62 psi
Thomas & Brown HallFCV @ 331 US gpmdP: 32.13 psi
Walden HallFCV @ 242 US gpmdP: 33.39 psi
CHWSP-1Set @ 13000 US gpmTH: (113.9) ft
Engineering Complex III 564FCV Fully OpendP: 0 psi
PSL Anderson BldgFCV @ 906 US gpmdP: 26.93 psi
Wooten FCV @ 197 US gpmdP: 24.77 psi
ScienceFCV @dP: 33.9
10-08 New Academic BuildingsFCV @ 1504 US gpmdP: 24.24 psi
15-03 Academic Lab BldgFCV @ 175 US gpmdP: 34.18 psi
15-05 Academic/Lab BldgsFCV @ 1455 US gpmdP: 25.36 psi
15-14 O'Donnell Hall, Ph 2
FCV @ 200 US gpm
dP: 32.53 psi

Ø: 12 inFlow: 1014 US gpmVel: 2.908 ft/secdP: 5.854 psi
Ø: 12 inFlow: 1187 US gpmVel: 3.406 ft/secdP: (3.274) psi
Ø:
18
in
Flo
w:
48
31
US
gp
mV
el:
6.9
35
ft/
se
c
dP
: 7
.65
3 p
si
Ø:
18
in
Flo
w:
51
31
US
gp
mV
el:
7.3
66
ft/
se
c
dP
: 8
.07
4 p
si
Ø: 12 inFlow: 840.7 US gpmVel: 2.412 ft/secdP: 1.559 psi
Ø:
8 in
Flo
w:
78
8 U
S g
pm
Ve
l:
5.0
58
ft/
se
c
dP
: (0
.74
8)
psi
Ø: 12 inFlow: 1051 US gpmVel: 3.016 ft/secdP: (4.733) psi
Ø:
6 in
Flo
w:
60
6 U
S g
pm
Ve
l:
6.7
36
ft/
se
c
dP
: 1
.26
4 p
si
Ø: 12 inFlow: 798.9 US gpmVel: 2.292 ft/secdP: (1.283) psi
Ø: 12 inFlow: 234.7 US gpmVel: 0.673 ft/secdP: 4.258 psi
Ø:
8 in
Flo
w:
67
2 U
S g
pm
Ve
l:
4.3
14
ft/
se
c
dP
: 7
.00
8 p
si
Ø: 12 inFlow: 2799 US gpmVel: 8.029 ft/secdP: (0.372) psi
Ø: 12 inFlow: 1354 US gpmVel: 3.886 ft/secdP: 9.903 psi
Ø: 8 inFlow: 633 US gpmVel: 4.063 ft/secdP: 1.507 psi
Ø:
12
in
Flo
w:
24
22
US
gp
mV
el:
6.9
49
ft/
se
c
dP
: 1
.33
4 p
si
Ø: 12 inFlow: 2510 US gpm
Vel: 7.201 ft/sec
dP: 11.33 psi
Ø:
6 in
Flo
w:
49
8 U
S g
pm
Ve
l:
5.5
35
ft/
se
c
dP
: 0
.82
1 p
si
Ø: 12 inFlow: 192.9 US gpmVel: 0.553 ft/secdP: (4.234) psi
Ø: 12 inFlow: 2127 US gpmVel: 6.101 ft/secdP: (4.476) psi
Ø:
12
in
Flo
w:
18
77
US
gp
mV
el:
5.3
85
ft/
se
c
dP
: 0
.95
psi
Ø:
12
in
Flo
w:
16
65
US
gp
mV
el:
4.7
77
ft/
se
c
dP
: 1
.01
4 p
si
Ø: 12 inFlow: 3055 US gpm
Vel: 8.765 ft/sec
dP: 0.998 psi
Flow: 2114 US gpm
Vel: 6.066 ft/sec
dP: 4.877 psi
Ø: 12 in
Flow: 1547 US gpm
Vel: 4.439 ft/s
ec
dP: 7.291 psi
Ø:
8 in
Flo
w:
73
7.5
US
gp
mV
el:
4.7
34
ft/
se
c
dP
: 6
.34
1 p
si
Ø:
8 in
Flo
w:
73
7.5
US
gp
mV
el:
4.7
34
ft/
se
c
dP
: 0
.62
9 p
si
Ø:
6 in
Flo
w:
30
4 U
S g
pm
Ve
l:
3.3
79
ft/
se
c
dP
: 4
.51
6 p
si
Ø: 14 inFlow: 600.8 US gpmVel: 1.426 ft/secdP: (1.383) psi
Ø:
4 in
Flo
w:
10
3 U
S g
pm
Ve
l:
2.5
98
ft/
se
c
dP
: 6
.25
2 p
si
Flow: 831.9 US gpmVel: 1.975 ft/secdP: (8.316) psi
Ø:
8 in
Flo
w:
45
7 U
S g
pm
Ve
l:
2.9
34
ft/
se
c
dP
: 4
.60
7 p
si
Ø: 12 inFlow: 2026 US gpmVel: 5.814 ft/secdP: 2.628 psi
Ø:
6 in
Flo
w:
65
2 U
S g
pm
Ve
l:
7.2
47
ft/
se
c
dP
: 1
.45
3 p
si
Ø: 12 inFlow: 2678 US gpmVel: 7.684 ft/secdP: 7.178 psi
Ø: 12 inFlow: 1145 US gpmVel: 3.286 ft/secdP: 3.834 psi
Ø:
6 in
Flo
w:
94
US
gp
mV
el:
1.0
45
ft/
se
c
dP
: (2
.04
5)
psi
Ø: 10 inFlow: 548 US gpmVel: 2.232 ft/secdP: 3.438 psi
Ø: 12 in
Flow: 606.8 US gpm
Vel: 1.741 ft/s
ec
dP: 0.282 psi
Ø: 10 inFlow: 548 US gpmVel: 2.232 ft/secdP: (6.463) psi
Ø: 12 inFlow: 3451 US gpmVel: 9.899 ft/secdP: (3.177) psi
Ø: 12 inFlow: 1240 US gpmVel: 3.558 ft/secdP: (5.313) psi
Ø: 12 inFlow: 1093 US gpmVel: 3.136 ft/secdP: 5.215 psi
Ø: 14 inFlow: 307.5 US gpmVel: 0.73 ft/secdP: (24.02) psi
Ø: 14 inFlow: 121.2 US gpmVel: 0.288 ft/secdP: 4.245 psi
Ø:
8 in
Flo
w:
67
3.9
US
gp
mV
el:
4.3
25
ft/
se
c
dP
: 0
.58
8 p
si
Ø:
8 in
Flo
w:
67
3.9
US
gp
mV
el:
4.3
25
ft/
se
c
dP
: 0
.53
psi
P:
44
.64
psi g
P: 45.38 psi g
P:
42
.2 p
si g
P: 77.56 psi g
P:
75
.54
psi g
P: 68.36 psi g
P: 8
9.0
4 p
si g
Astronomy BldgFCV @ 103 US gpmdP: 34.93 psi
Branson Library 02FCV @ 457 US gpmdP: 35.45 psi
Branson Library 03FCV @ 304 US gpmdP: 35.62 psi
Breland HallFCV @ 212 US gpmdP: 30.76 psi
Garcia AnnexFCV @ 165 US gpmdP: 21.78 psi
Activity CenterFCV @ 652 US gpmdP: 21.35 psi
Science HallFCV @ 766 US gpmdP: 33.98 psi
Student Health CenterFCV @ 94 US gpmdP: 31.55 psi
Zuhl Library 319.84FCV @ 548 US gpmdP: 34.88 psi
10-07 Student Activities Exp.FCV @ 498 US gpmdP: 32.11 psi
Zuhl Library ExpansionFCV @ 633 US gpmdP: 32.49 psi
15-04 Academic BldgsFCV @ 672 US gpmdP: 21.82 psi
15-07 Academic/Lab BldgFCV @ 606 US gpmdP: 30.52 psi
20-01 Academic Lab BldgFCV @ 788 US gpmdP: 29.8 psi
P: 50.69 psi g
P:
81
.39
psi g

Ø: 8 inFlow: 736 US gpmVel: 4.724 ft/secdP: (2.705) psi
Ø: 12 inFlow: 515.6 US gpmVel: 1.479 ft/secdP: 7.903 psi
Ø:
6 in
Flo
w:
24
7 U
S g
pm
Ve
l:
2.7
45
ft/
se
c
dP
: 2
.49
4 p
si
Ø: 12 inFlow: 256.5 US gpmVel: 0.736 ft/secdP: (4.214) psi
Ø: 12 inFlow: 762.6 US gpmVel: 2.188 ft/secdP: (1.905) psi
Ø: 12 inFlow: 256.5 US gpmVel: 0.736 ft/secdP: 3.57 psi
Ø: 12 inFlow: 9.522 US gpmVel: 0.027 ft/secdP: 4.244 psi
Ø:
12
in
Flo
w:
76
2.6
US
gp
mV
el:
2.1
88
ft/
se
c
dP
: (1
.93
2)
psi
Ø:
12
in
Flo
w:
76
2.6
US
gp
mV
el:
2.1
88
ft/
se
c
dP
: 0
.49
5 p
si
Ø: 12 inFlow: 515.6 US gpmVel: 1.479 ft/secdP: 0.106 psi
Ø:
12
in
Flo
w:
9.5
22
US
gp
mV
el:
0.0
27
ft/
se
c
dP
: (2
.12
2)
psi
Ø:
12
in
Flo
w:
9.5
22
US
gp
mV
el:
0.0
27
ft/
se
c
dP
: (2
.12
2)
psi
P:
58
.41
psi g
P: 28.76 psi g
Chamisa Village FCV @ 507 US gpm
~N{031}dP: 10.25 psi
05-04 Native Americ Cult CntrFCV @ 154 US gpmdP: 29.51 psi
05-13 Chamisa Dorms, Ph 2FCV @ 247 US gpmdP: 29.81 psi
10-06 New Married Student HsgFCV @ 736 US gpmdP: 19.46 psi

Ø:
20
in
Flo
w:
11
41
US
gp
mV
el:
1.3
18
ft/
se
c
dP
: 0
.07
7 p
si
Ø:
20
in
Flo
w:
11
09
US
gp
mV
el:
1.2
81
ft/
se
c
dP
: 0
.07
3 p
si
Ø:
24
in
Flo
w:
27
81
US
gp
mV
el:
2.2
22
ft/
se
c
dP
: (6
.25
7)
psi
Ø: 12 inFlow: 1961 US gpmVel: 5.626 ft/secdP: 9.185 psi
Ø: 12 inFlow: 1961 US gpmVel: 5.626 ft/secdP: 4.874 psi
Ø:
24
in
Flo
w:
28
13
US
gp
mV
el:
2.2
47
ft/
se
c
dP
: 6
.47
6 p
si
Ø:
24
in
Flo
w:
43
36
US
gp
mV
el:
3.4
64
ft/
se
c
dP
: (1
.68
6)
psi
Ø: 12 inFlow: 1555 US gpmVel: 4.461 ft/secdP: 2.403 psi
NM Dept. of AgricultureFCV @ 505 US gpmdP: 30.13 psi
15-06 Academic Research LabFCV @ 1555 US gpmdP: 33.75 psi
20-02 Academic/Res BldgsFCV @ 1961 US gpmdP: 32.62 psi
20-02 Academ/Res BldgsFCV @ 1961 US gpmdP: 32.62 psi
P:
83
.33
psi g
P: 48.33 psi g
P: 83.4 psi g
P:
48
.26
psi g

Ø: 12 inFlow: 1563 US gpmVel: 4.484 ft/secdP: 0.645 psi
Ø: 20 inFlow: 1109 US gpmVel: 1.281 ft/secdP: 6.554 psi
Ø:
24
in
Flo
w:
11
41
US
gp
mV
el:
0.9
11
ft/
se
c
dP
: 6
.40
2 p
si
Ø:
24
in
Flo
w:
27
04
US
gp
mV
el:
2.1
6 f
t/se
c
dP
: 0
.32
6 p
si
Ø: 20 inFlow: 1141 US gpmVel: 1.318 ft/secdP: (6.166) psi
Ø:
24
in
Flo
w:
11
09
US
gp
mV
el:
0.8
86
ft/
se
c
dP
: (6
.33
1)
psi
Ø:
24
in
Flo
w:
26
72
US
gp
mV
el:
2.1
34
ft/
se
c
dP
: 0
.31
9 p
si
Ø:
8 in
Flo
w:
11
34
US
gp
mV
el:
7.2
79
ft/
se
c
dP
: 3
.36
8 p
si
P:
81
.07
psi g
P:
48
.02
psi g
P: 54.42 psi g
P:
89
.96
psi g
20-03 Academic/ Research bldgsFCV @ 1563 US gpmdP: 30.74 psi

Ø:
8 in
Flo
w:
11
34
US
gp
mV
el:
7.2
79
ft/
se
c
dP
: 6
.75
6 p
si
20-04 Family Housing, Ph2 FCV @ 1134 US gpmdP: 7.272 psi
Lineup:
System:
Date:
Company:
Project:
by:
Flow:
Pressure:
Size:
Elevation:
Velocity:
Length:
Volume:
Darcy-Weisbach PIPE-FLO 2007
0874.00 NMSU CHW - 2034
06/11/09 10:36 am
GLHN
0874.00 NMSU UDP
DHW
CHW - Stage 2 - Campus Build Out
US gpm
psi g
in
ft
ft/sec
ft
gallons
2034 Distribution (12°dT)