Embed Size (px)
Citation preview
!HYDROGRAPHIC SURVEYING!
UNDERWATER MAPPING USING MULTI-BEAM SENSORS!SS Breda Wreck Multi-Beam Survey!!!
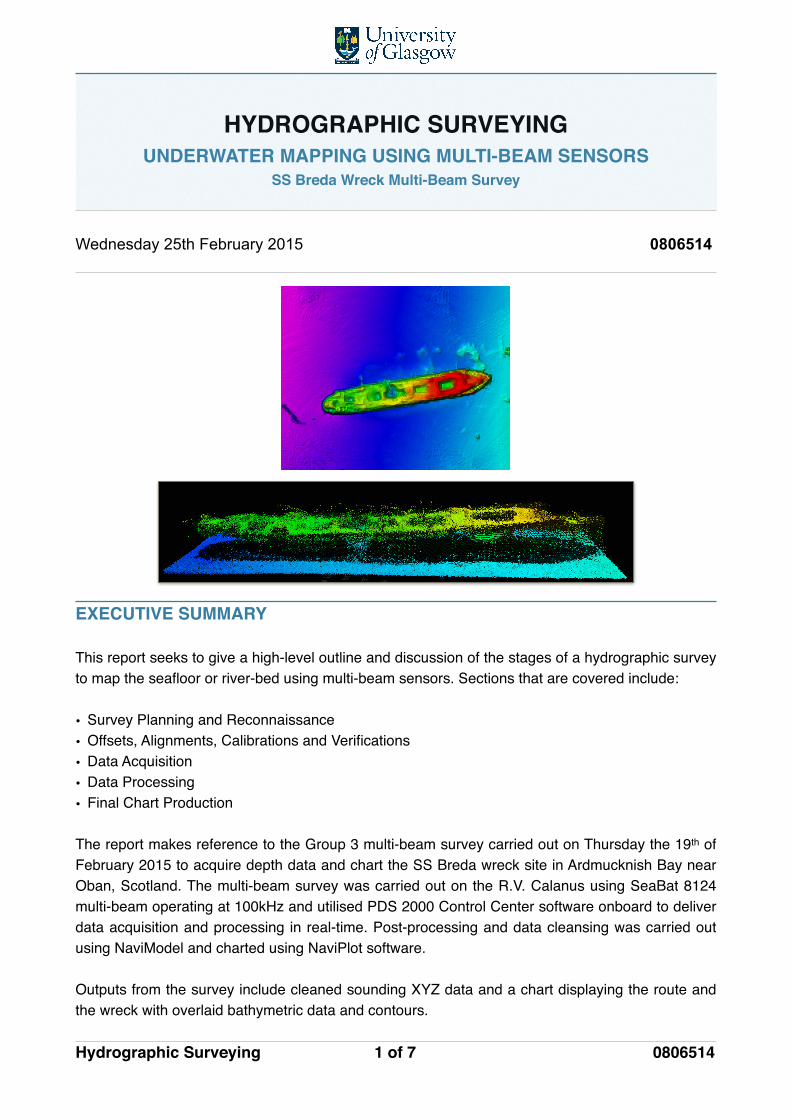
Wednesday 25th February 2015 0806514 !!!!!!! !!!!!!!EXECUTIVE SUMMARY!!This report seeks to give a high-level outline and discussion of the stages of a hydrographic survey to map the seafloor or river-bed using multi-beam sensors. Sections that are covered include:!!• Survey Planning and Reconnaissance!• Offsets, Alignments, Calibrations and Verifications!• Data Acquisition!• Data Processing!• Final Chart Production!!The report makes reference to the Group 3 multi-beam survey carried out on Thursday the 19th of February 2015 to acquire depth data and chart the SS Breda wreck site in Ardmucknish Bay near Oban, Scotland. The multi-beam survey was carried out on the R.V. Calanus using SeaBat 8124 multi-beam operating at 100kHz and utilised PDS 2000 Control Center software onboard to deliver data acquisition and processing in real-time. Post-processing and data cleansing was carried out using NaviModel and charted using NaviPlot software.!!Outputs from the survey include cleaned sounding XYZ data and a chart displaying the route and the wreck with overlaid bathymetric data and contours.!!
0806514� of �1 7Hydrographic Surveying
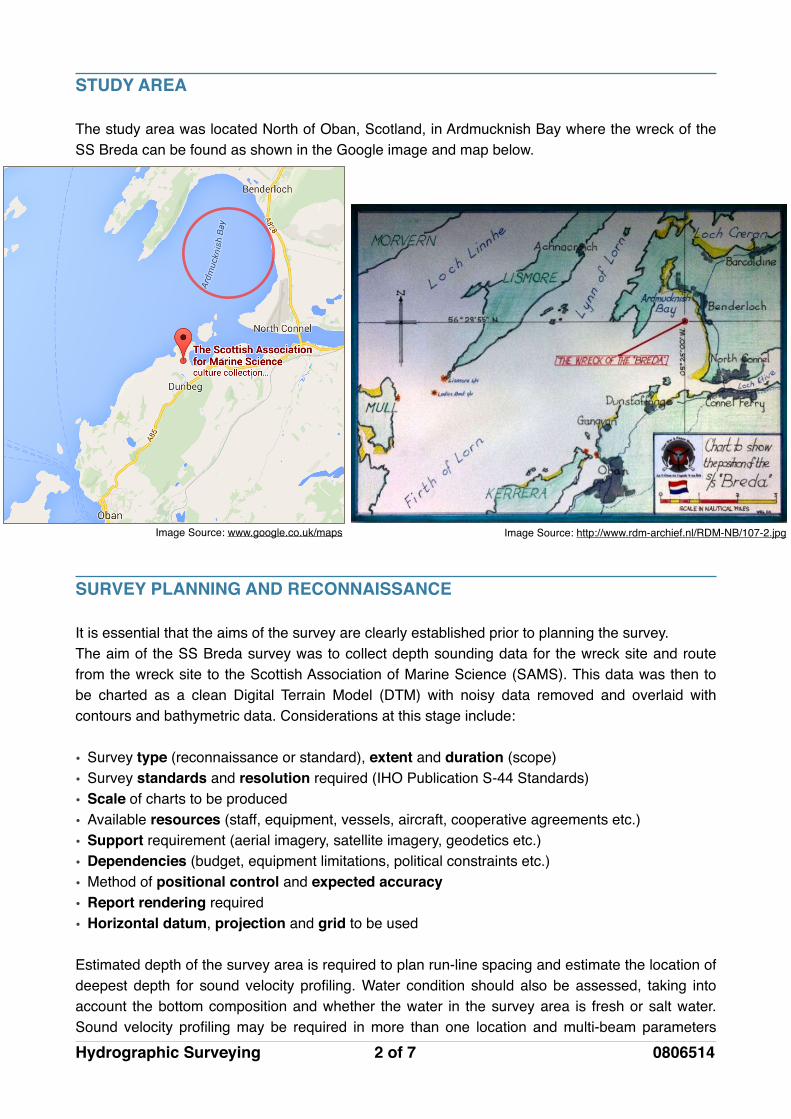
STUDY AREA!!The study area was located North of Oban, Scotland, in Ardmucknish Bay where the wreck of the SS Breda can be found as shown in the Google image and map below.!!!!!!!!!!!!!!!!!!!!SURVEY PLANNING AND RECONNAISSANCE!!It is essential that the aims of the survey are clearly established prior to planning the survey.!The aim of the SS Breda survey was to collect depth sounding data for the wreck site and route from the wreck site to the Scottish Association of Marine Science (SAMS). This data was then to be charted as a clean Digital Terrain Model (DTM) with noisy data removed and overlaid with contours and bathymetric data. Considerations at this stage include:!!• Survey type (reconnaissance or standard), extent and duration (scope)!• Survey standards and resolution required (IHO Publication S-44 Standards)!• Scale of charts to be produced!• Available resources (staff, equipment, vessels, aircraft, cooperative agreements etc.)!• Support requirement (aerial imagery, satellite imagery, geodetics etc.)!• Dependencies (budget, equipment limitations, political constraints etc.)!• Method of positional control and expected accuracy!• Report rendering required!• Horizontal datum, projection and grid to be used!!Estimated depth of the survey area is required to plan run-line spacing and estimate the location of deepest depth for sound velocity profiling. Water condition should also be assessed, taking into account the bottom composition and whether the water in the survey area is fresh or salt water. Sound velocity profiling may be required in more than one location and multi-beam parameters
0806514� of �2 7Hydrographic Surveying
Image Source: http://www.rdm-archief.nl/RDM-NB/107-2.jpgImage Source: www.google.co.uk/maps
may need adjustment to compensate for varying energy absorption due to different bottom compositions. Individual survey run-lines should pass over one type of environment if possible and the surveyor should be aware of areas of change. The area should also be assessed for any hazards that may be present and vessel traffic that may impact the survey. The speed of the vessel during survey should be determined with the aim of minimising noise that is generated at speed. Ping spacing and maximum ping rate should be considered when calculating the optimum vessel speed that will meet bottom search requirements.!!No scale and accuracy was set for the SS Breda survey due to its educational nature.!!!OFFSETS, ALIGNMENTS, CALIBRATIONS AND VERIFICATIONS!!OFFSETS AND ALIGNMENTS!Positioning sensors such as the Global Navigation Satellite System (GNSS), the heading sensor (GyroCompass) and the motion reference unit (MRU) must be aligned to the vessel reference frame and the horizontal and vertical offsets should be measured and accounted for prior to data acquisition. The vessel reference point, normally the vessel centre of gravity, should be used as the origin for all offsets. Sensor reference points are normally displayed on the equipment exterior. The centre of gravity of the device is normally measured to when the reference point is not displayed externally. Offsets should be recorded on the vessel General Arrangement drawing.!!Offsets and alignments are required to transfer GNSS position from the mounted GNSS receiver to the sensor locations in order to generate correctly geo-referenced survey data. Misalignments and inaccurate offset measurements may induce a pitch/roll bias that propagates and causes positional error. Measurement of offsets and alignments to the vessel reference frame are commonly performed by dimensional control surveyors every five years using a total station when the vessel is in dry-dock. However, on-going quality control is used to capture any changes. It should also be noted that it is crucial to adopt the correct sign conventions. Incorrect multi-beam transducer alignment measurements may result in depth errors as well as positional errors, potentially leading to client rejection of the survey data due to poor data quality.!!CALIBRATIONS!It is essential that the sensors are calibrated prior to data acquisition to account for the true attitude of the vessel reference frame. Poorly calibrated sensors can lead to positional and depth errors that may result in a distrust and rejection of the data due to an unacceptable level of data quality.!!Correct minus Observed (C-O) can be calculated to calibrate the heading sensor, the calculated C-O can be applied as a correction to the heading sensor readings. Sensor mounting angle corrections can also be calculated by comparing the sensor orientation with the listing of the vessel reference frame.!!Heading sensor calibration can be done through the use of a total station when the vessel is securely tied to a quay using fore and aft offset measurements compared to the quay heading. RTK moving baseline may be more commonly used to compute the relative RTK positioning between two receivers using the heading and vertical angle between the two antennas.!
0806514� of �3 7Hydrographic Surveying
The motion sensor can be aligned with the vessel reference frame in dry dock using precise total station measurements of the vessel pitch, roll and heading and comparing these computed values to the motion sensor observations. A C-O can be used to compute the correction values that can then be applied to the sensor observations. Motion sensor calibration can also be performed offshore by turning off the total station internal inclinometer and measuring 3D points that represent the vessel reference frame. Similarly a C-O can be calculated by comparing computed values to the motion sensor observations and the corrections can be applied to the observed values. Standard deviation (commonly to 2 sigma) can be used to check the quality of the C-O values.!!Multi-beam calibration involves calculating the latency, roll, pitch and yaw of the sonar head with respect to the vessel reference frame. The mounting angles are solved for in the order of roll first, latency second, pitch third and yaw fourth. The order that the mounting angles are solved in is important and done to isolate each effect and prevent any crossover (i.e. confusion of which effect is acting on the vessel). The target resolutions of each solution are as follows:!!1) Roll:! 0.01o!
2) Latency:! 10ms!3) Pitch:! 0.1o!4) Heading:! 0.1o!!For a successful patch test the highest resolution positioning system available (RTK) should be used in cooperation with appropriate topography and precise line steering for the necessary sensor calibrations.!!Sound velocity profiling is absolutely critical to obtaining accurate calculated depths. Incorrect sound velocity can result in significant error in depth computations as it is a crucial component of the formula that calculates depth (Distance = Velocity * Time).!!Timing is also crucial. In order for the depth to be calculated effectively in real-time using the hydrographic surveying software (e.g. PDS2000 Control Center) the computer clock must be synchronised with Coordinated Universal Time (UTC) using the one pulse per second (1PPS) from a GNSS receiver that aligns the computer clock to UTC every second.!!Using accurate timing and sound velocity profiling will increase the accuracy of the computed depths and increase confidence in the acquired data set.!!VERIFICATIONS!Verifications are used to confirm that the offsets and alignments values and sensor operational performance are of an acceptable standard. Performing these checks means that the acquired data can be submitted with a high level of confidence.!!Periodic checks against similar sensors, continuous performance monitoring and application of correctly calculated C-Os can verify computed sounding positions and depths. Error spotting to ensure the correct C-Os are applied and checks to ensure sensor position is as stated as part of dimensional control is required as verification.
0806514� of �4 7Hydrographic Surveying

DATA ACQUISITION (SS Breda)!!SAFETY & CHECKLIST!Before data was acquired a vessel safety briefing and pre-survey checklist were carried out to ensure the safe and effective operation of the survey.!!HARDWARE!Hardware used included:!!• R.V. Calanus Survey Vessel!• Gyro!• Motion Reference Unit (MRU)!• Conductivity Temperature Density (CTD) Profiler!• SeaBat 8124 Multi-Beam Echo Sounder (MBES)!• Global Navigation Satellite System (GNSS)!• PC!• Helmsman Display - duplicate view for the skipper!!Necessary equipment was powered on and a sound velocity profile was generated using data from a Conductivity Temperature Density (CTD) profiler that was deployed near the wreck site.!!Multi-beam sonar tuning was carried out by setting the:!• Mode (equi-angle for this survey)!• Frequency (100kHz for this survey)!• UTC time synchronisation with GNSS 1PPS!• Sound velocity (using SVP data from the CTD profiler)!• Pitch and roll correction values!• Range (manually modified but some systems can auto-adjust)!• Power!• Pulse length!• Gain value!• Maximum ping rate!• Absorption and spreading values!!SOFTWARE!PDS2000 Control Center software was used to acquire and process data in real-time to form a DTM of the seafloor. Configuration of the system was carried out including clock synchronisation check, coordinate system selection, sensor offsets, height source, multi-beam calibration values and sound velocity profile import and selection. Equi-angle mode was used to give increased sounding density over the wreck, allowing greater detail to be obtained. More overlap was required to increase sounding density, resulting in more survey run-lines. Multi-beam tuning values were set on the PDS2000 Control Center software to apply compensations to the acquired depth data.!!RUN-LINES!Multiple intersecting run-lines were used to survey the wreck from different orientations to ensure the wreck was captured as fully as possible within the data set.
0806514� of �5 7Hydrographic Surveying

DATA PROCESSING (SS Breda)!!SOFTWARE!PDS2000 Control Center software was used to process the data and display as a DTM in real-time aboard the vessel.!!NaviModel software was used to process the sounding XYZ point data into a DTM. The XYZ data was transformed into a geo-referenced surface of the surveyed run-lines. The rainbow colour ramp was chosen to emphasise deeper areas as purple/blue and show higher altitude as red/orange. This shows the wreck to be a hazard that rises approximately 10-15m from the seafloor.!!The raw data required cleaning to disregard noisy soundings. This was done using the point edit tool by drawing a polygon and erasing noisy data that appeared in the pop-up display. The screenshot, right, shows the noisy (red) points that represent unnatural spikes on the seafloor.!
!The screenshot, left, shows a section of the bow of the wreck after noise cleaning.!!Cleaning was done in sections to put less strain on computer processing power and speed up the process.!!A cross-sectional profile was also generated to show the height across the width of the vessel.!!
The screenshots below show the before cleaning (left) and after cleaning (right) of the shipwreck area. The noisy lines have been removed to emphasise features and give a clearer appearance.
0806514� of �6 7Hydrographic Surveying
BEFORE AFTER
CLEANED!BOW
NOISY DATA

FINAL CHART PRODUCTION (SS Breda)!!NaviPlot software was used to plot the survey data onto a chart in three separate frames.!!TOP-LEFT FRAME!Bathymetric data was plotted on top of the cleaned shipwreck area shown in the top-left frame, below. This data represents direct sounding measurements from the wreck. The rainbow palette was used to emphasise the deep depths shown in purple/blue and emphasise the higher altitudes of the ship wreck in red/orange. The highest point of the wreck appears to be at a depth of approximately 13.5m.!!BOTTOM-LEFT FRAME!The contours are displayed in the bottom-left frame. The coloured contours are of similar depths shown in the palette in the top-frame, deeper depths are shown by purple/blue and the higher altitudes are shown by red/orange.!!RIGHT FRAME!The right frame shows the full route taken from the Scottish Association for Marine Science (SAMS) near Oban to the SS Breda wreck site in Ardmucknish Bay.!!!!!!!!!!!!!!!!!!!!!!!!!Nautical charts are commonly used to find the way, follow a route or avoid danger.!Typically charts are produced as either raster (scanned paper) or vector (interactive electronic).
0806514� of �7 7Hydrographic Surveying


![[MS-RPL]: Report Page Layout (RPL) Binary Stream Format€¦ · MS-RPL] —. stream report. report page. report report report](https://img.dokumen.tips/doc/110x75/5fd9f7a7a90b7c34145fa364/ms-rpl-report-page-layout-rpl-binary-stream-format-ms-rpl-a-stream-report.jpg)